Automated tumour-stroma interface zone detection for Anti-tumour response assessment by immunogradient indicators

a technology of immunogradient indicators and tumour stroma, which is applied in the field of automatic detection of tumour stroma interface zone detection for anti-tumour response assessment by immunogradient indicators, can solve the problems of not providing an explicit definition, surely reducing analysis capacity, and the informative power and clinical utility of til and other tme-context assays may be underachieved

Pending Publication Date: 2022-05-05
VILNIUS UNIV
View PDF0 Cites 0 Cited by
  • Summary
  • Abstract
  • Description
  • Claims
  • Application Information

AI Technical Summary

Benefits of technology

[0029]Another benefit was demonstrated by the discovery of a time-dependent prognostic effect in the hormone receptor positive BC patient cohort was revealed with only the IZ gradient-type indicators, but not in the stratification by the CD8+ cell mean density on tumour aspect of the IZ. This finding proves the principle that the Immunogradient indicators have advantages over existing methods of measuring anti-tumour immune response in pathology slides. The specific names for the indicators can be modified depending on the context of the assay, which can be aimed at tasks other than tissue immune response assessment.

Problems solved by technology

However, it does not provide an explicit definition of “the border”; it actually requires an expert's judgement to manually draw it.
This remains a source of bias as it leads to inter- and intra-observer variance in tumours with irregular and highly infiltrative growth patterns, and it surely decreases the capacity of analysis, even if other analysis steps are automated.
Consequently, the informative power and clinical utility of TIL and other TME-context assays may be underachieved.

Method used


Image

  • Automated tumour-stroma interface zone detection for Anti-tumour response assessment by immunogradient indicators
  • Automated tumour-stroma interface zone detection for Anti-tumour response assessment by immunogradient indicators
  • Automated tumour-stroma interface zone detection for Anti-tumour response assessment by immunogradient indicators

Examples


Embodiment Construction

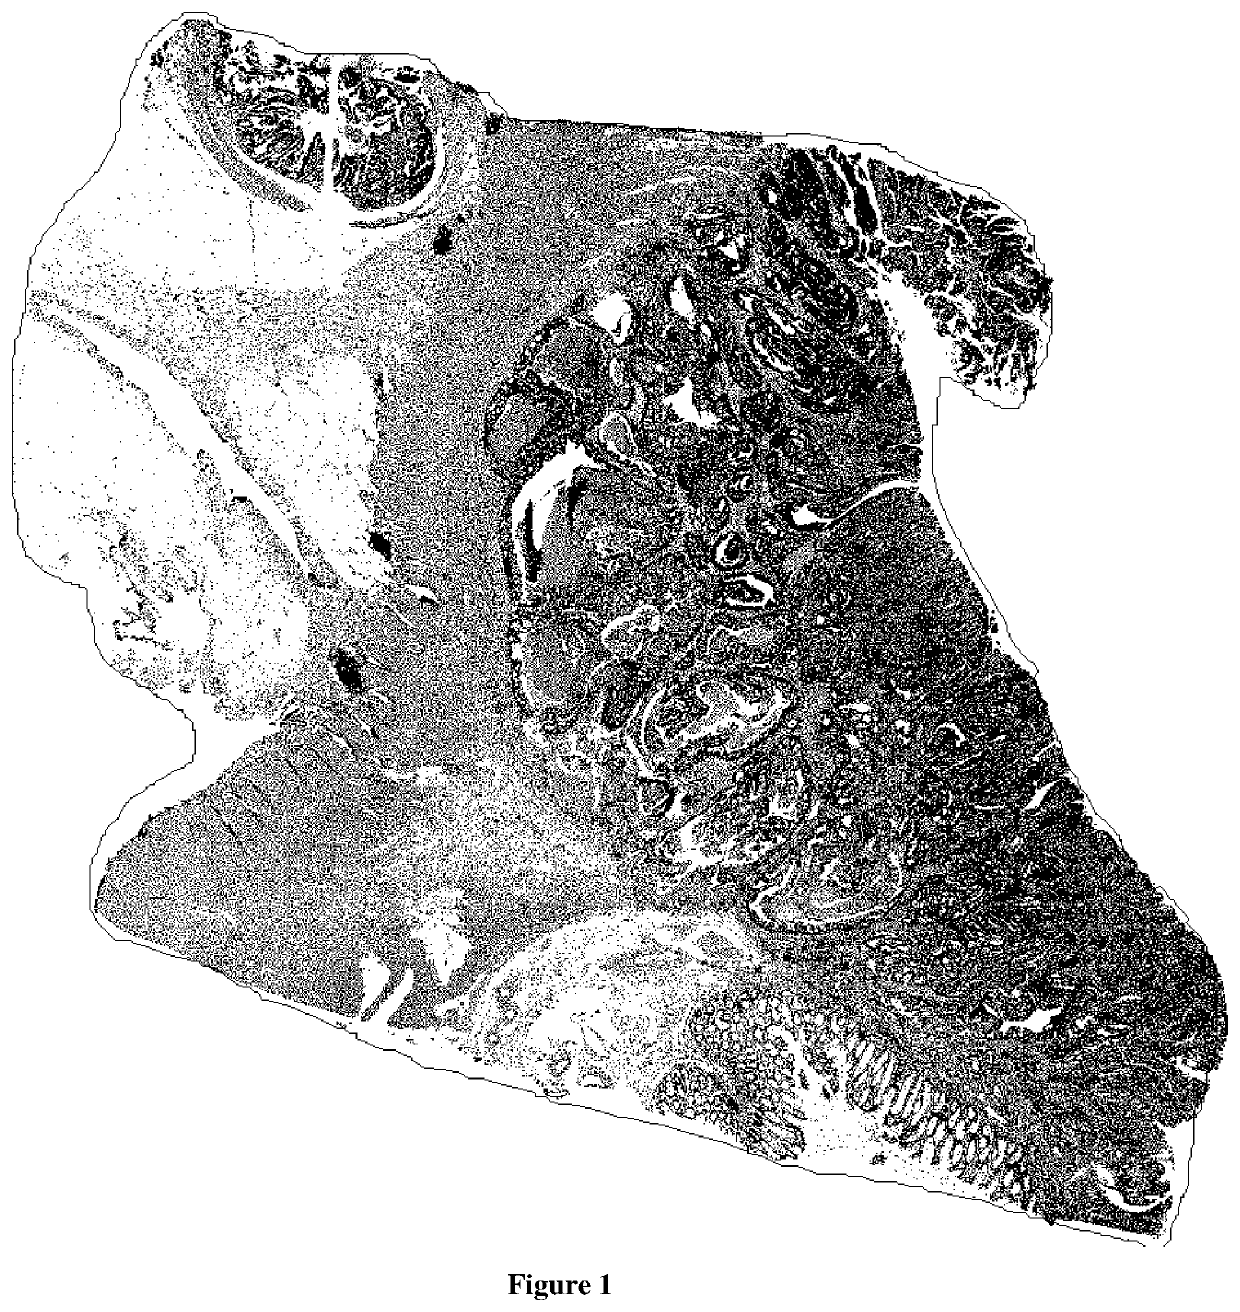
[0043]The procedure for staining and imaging by microscopy was done by mounting 3 μm thick FFPE tissue sections of BC and CRC tumours on positively charged slides (other appropriate microscopy slides can be used), IHC was performed by Roche Ventana BenchMark ULTRA automated slide stainer (Ventana Medical Systems, Tucson, Ariz., USA). Antibodies against cytotoxic T cell marker CD8 (clone C8 / 144B, DAKO; antibody dilution 1:400) was used followed by ultraView Universal DAB Detection kit (Ventana Medical Systems, Tucson, Ariz., USA). The sections were counterstained with Mayer's haematoxylin. The IHC slides were digitized at ×20 objective magnification (0.5 μm resolution) using a ScanScope XT Slide Scanner (Leica Aperio Technologies, Vista, Calif., USA) (FIG. 1). The method can be accomplished on any manual or automated IHC, immunofluorescence, or other microscopy staining and imaging technique that produces data on cancer tissue compartments and biomarker of interest, positioned within...


PUM


Abstract

We present a new method to automatically sample the tumour/stroma interface zone (IZ) from microscopy image analysis data. It first delineates the tumour edge using a set of explicit rules in grid-subsampled tissue areas; then the IZ of controlled width is sampled and ranked by the distance from the edge to compute TIL density profiles across the IZ. From this data, a set of novel Immunogradient indicators are computed to reflect TIL “gravitation” towards the tumour. We applied the method on CD8 immunohistochemistry images of surgically excised breast and colorectal cancers to predict overall patient survival. In both patient cohorts, we found strong and independent prognostic value of the Immunogradient indicators, outperforming methods currently available. We conclude that data-driven, automated, human operator-independent IZ sampling enables precise spatial immune response measurement in the tumour/host interaction frontline for prediction of disease and therapy outcomes.

Description

FIELD OF INVENTION[0001]This invention relates to a method of Tumour-Stroma interface zone detection from immunogradient indicators in cancer patients, that can be used to determine the prognosis of patient survival.BACKGROUND OF THE INVENTION[0002]One of the most prominent discoveries in modern genetics—analysis of the whole human genome sequence—has made it possible to determine specific genetic mutations associated with cancer. This has led to the definition of cancer as a cell disease caused by genetic mutations [1, 2]. Although genetic mechanisms explain many aspects of tumour progression, many hallmarks of cancer, including host immune and inflammatory response, angiogenesis, and metabolic disarrangements evolve in the context of tumour microenvironment (TME) [3]. In particular, a major driving force of local tumour-host tissue interactions are inflammatory and immune cell infiltrates. Solid tumours are infiltrated by both innate immunity cells (natural killer cells, macrophag...

Claims


Application Information

Patent Timeline
Patent Type & Authority Applications(United States)
IPC IPC(8): G06T7/13G06T7/136
CPCG06T7/13G06T7/136G06T2207/10056G06T2207/30024G06T2207/30096G06T7/194G06T2207/10024G06T2207/10064G06T2207/20021
Inventor LAURINAVICIUS, ARVYDASRASMUSSON, ALLANNESTARENKAITE, AUSRINEZILENAITE, DOVILEAUGULIS, RENALDAS
Owner VILNIUS UNIV
Why Eureka
Try Eureka