
Method and apparatus for analysis of chromatographic migration patterns

a technology of chromatographic migration patterns and detection methods, applied in the direction of biomass after-treatment, analysis using chemical indicators, instruments, etc., can solve the problems of significant identification errors, limited method of tibbetts, and signal identification errors, so as to improve signal alignment, improve signal quality, and detect and correct for mobility differences

Inactive Publication Date: 2001-03-27
UNIV OF UTAH RES FOUND
View PDF30 Cites 18 Cited by
  • Summary
  • Abstract
  • Description
  • Claims
  • Application Information

AI Technical Summary

Benefits of technology

The present invention includes a method and apparatus for the detection and analysis of information-containing signals in chromatographic data. The invention also includes a method and apparatus for detecting and sharpening signal peaks in chromatographic data. It is an advantage of the present invention that a chromatographic data from a wide variety of separation processes can be analyzed. Such separation processes include, but are not limited to, gel and capillary electrophoresis.
that a chromatographic data from a wide variety of separation processes can be analyzed. Such separation processes include, but are not limited to, gel and capillary electrophoresis.
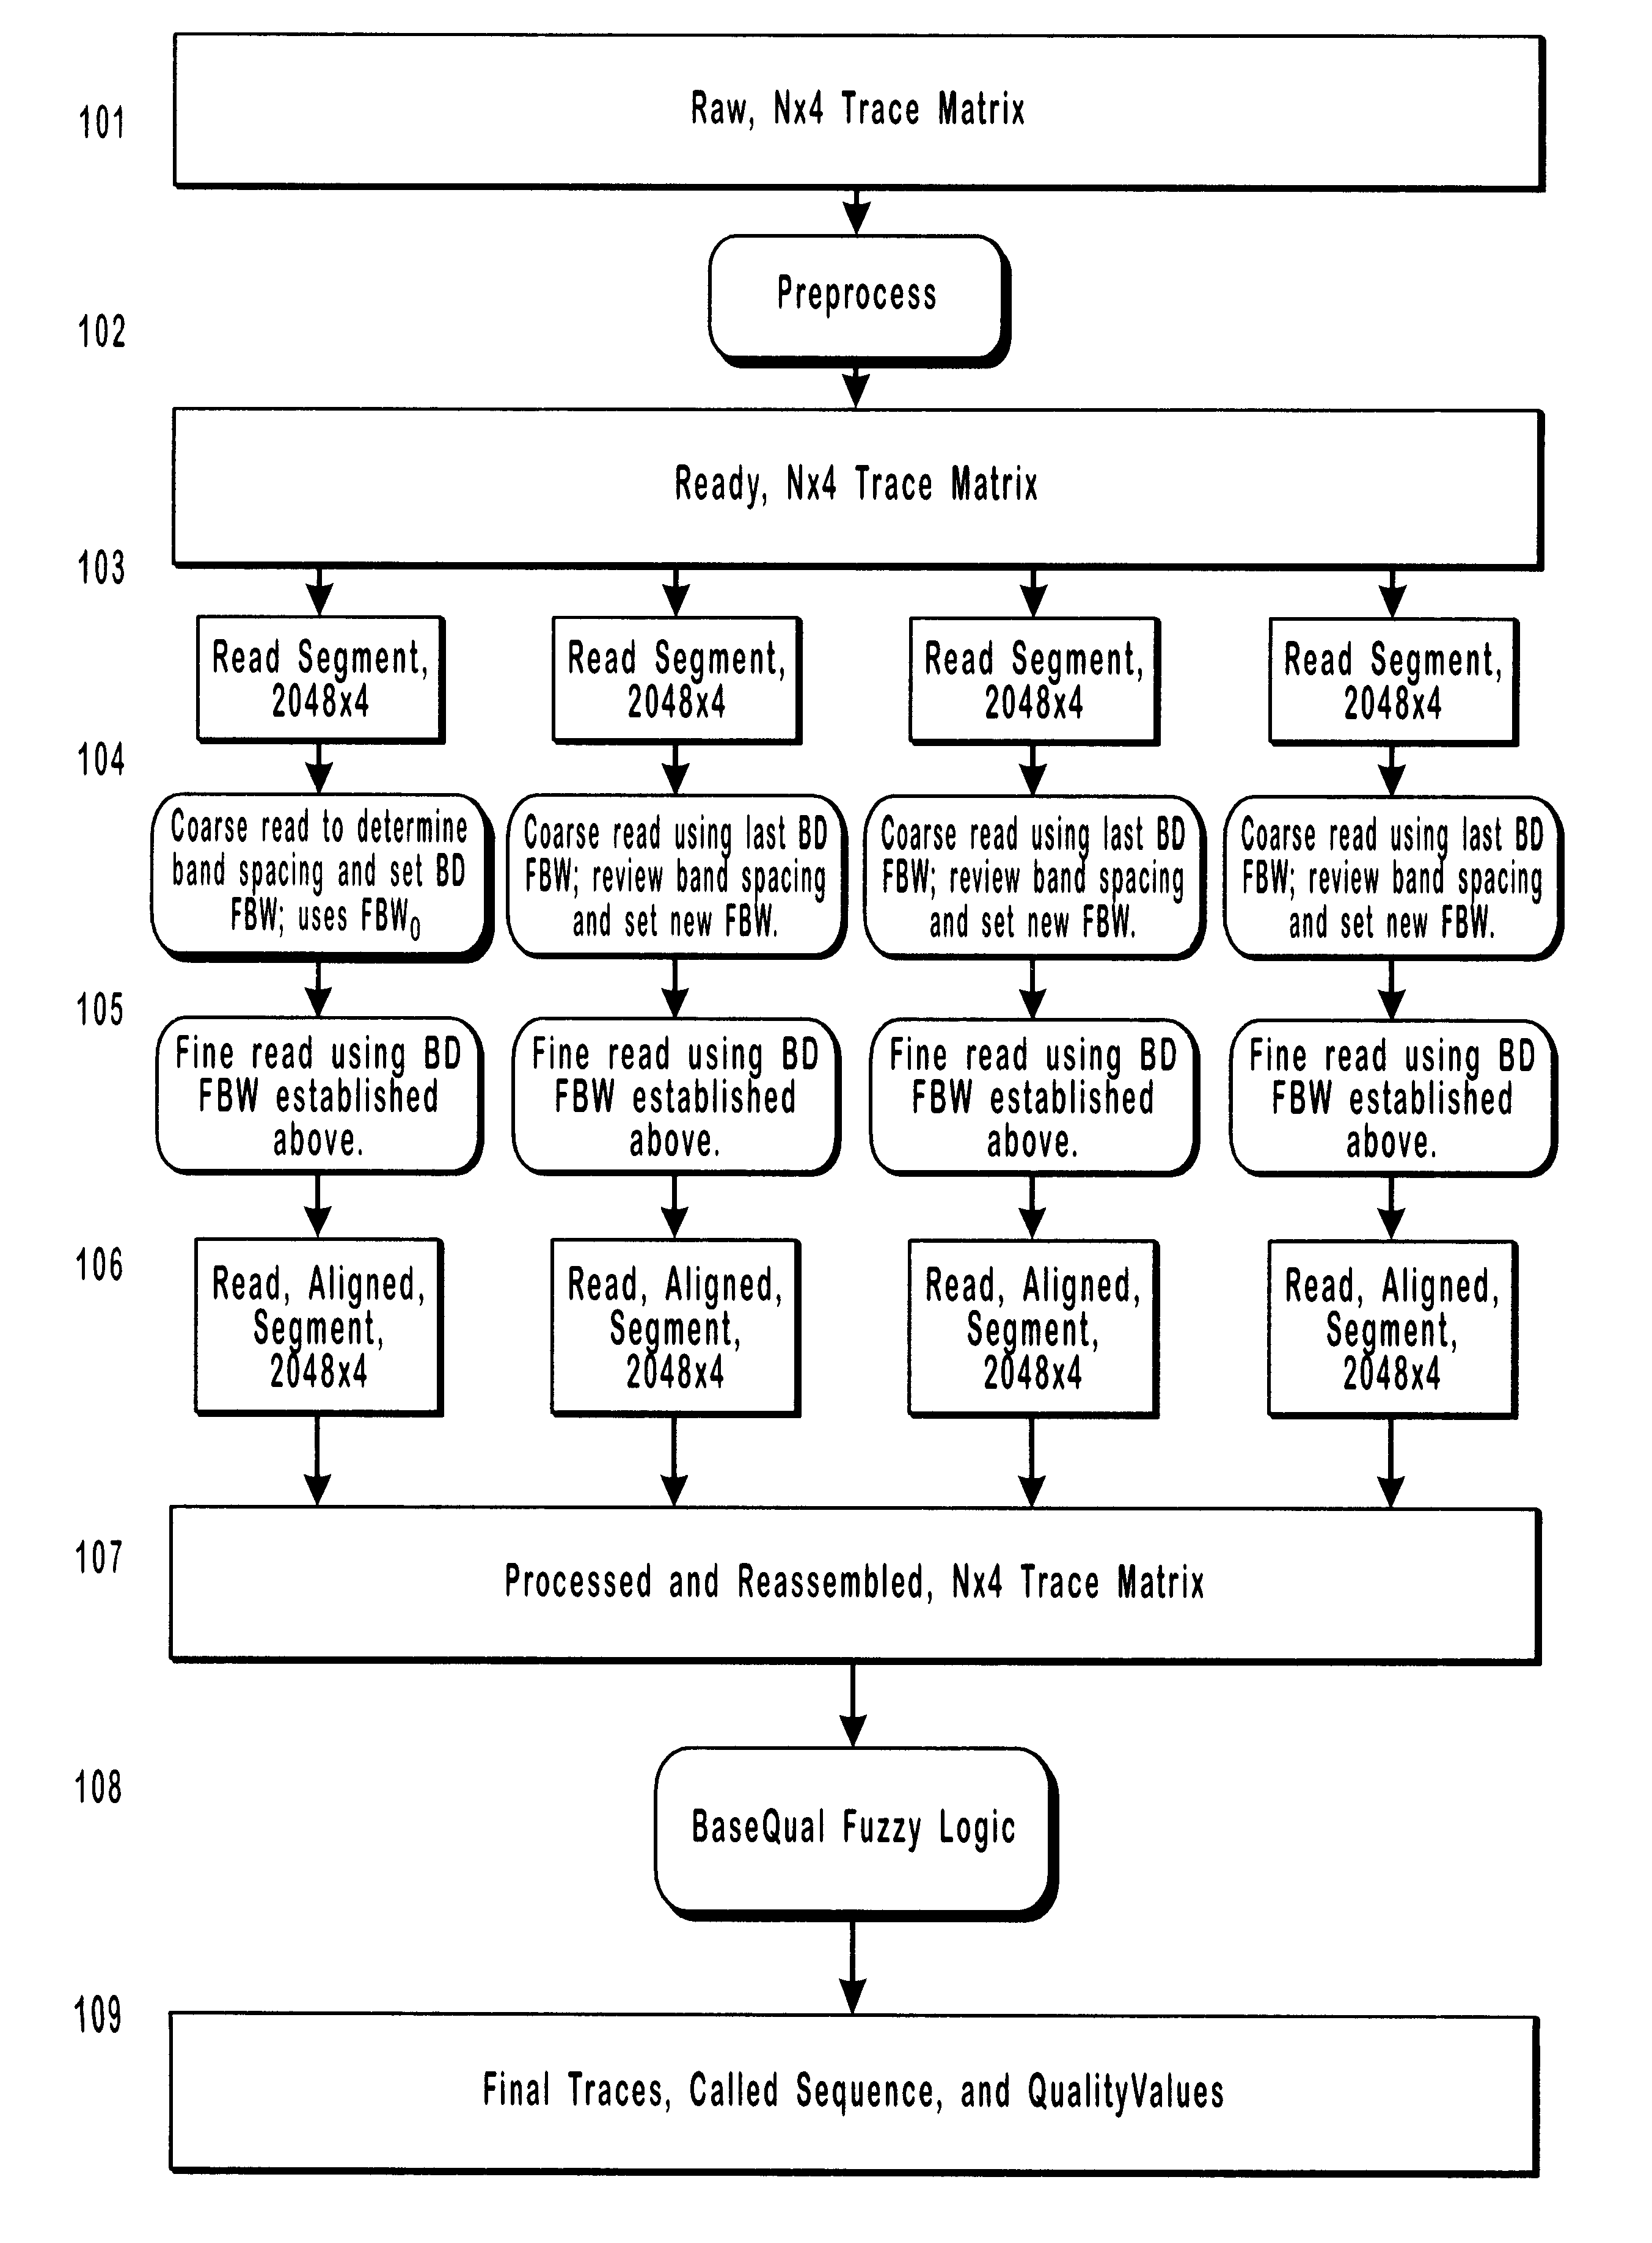
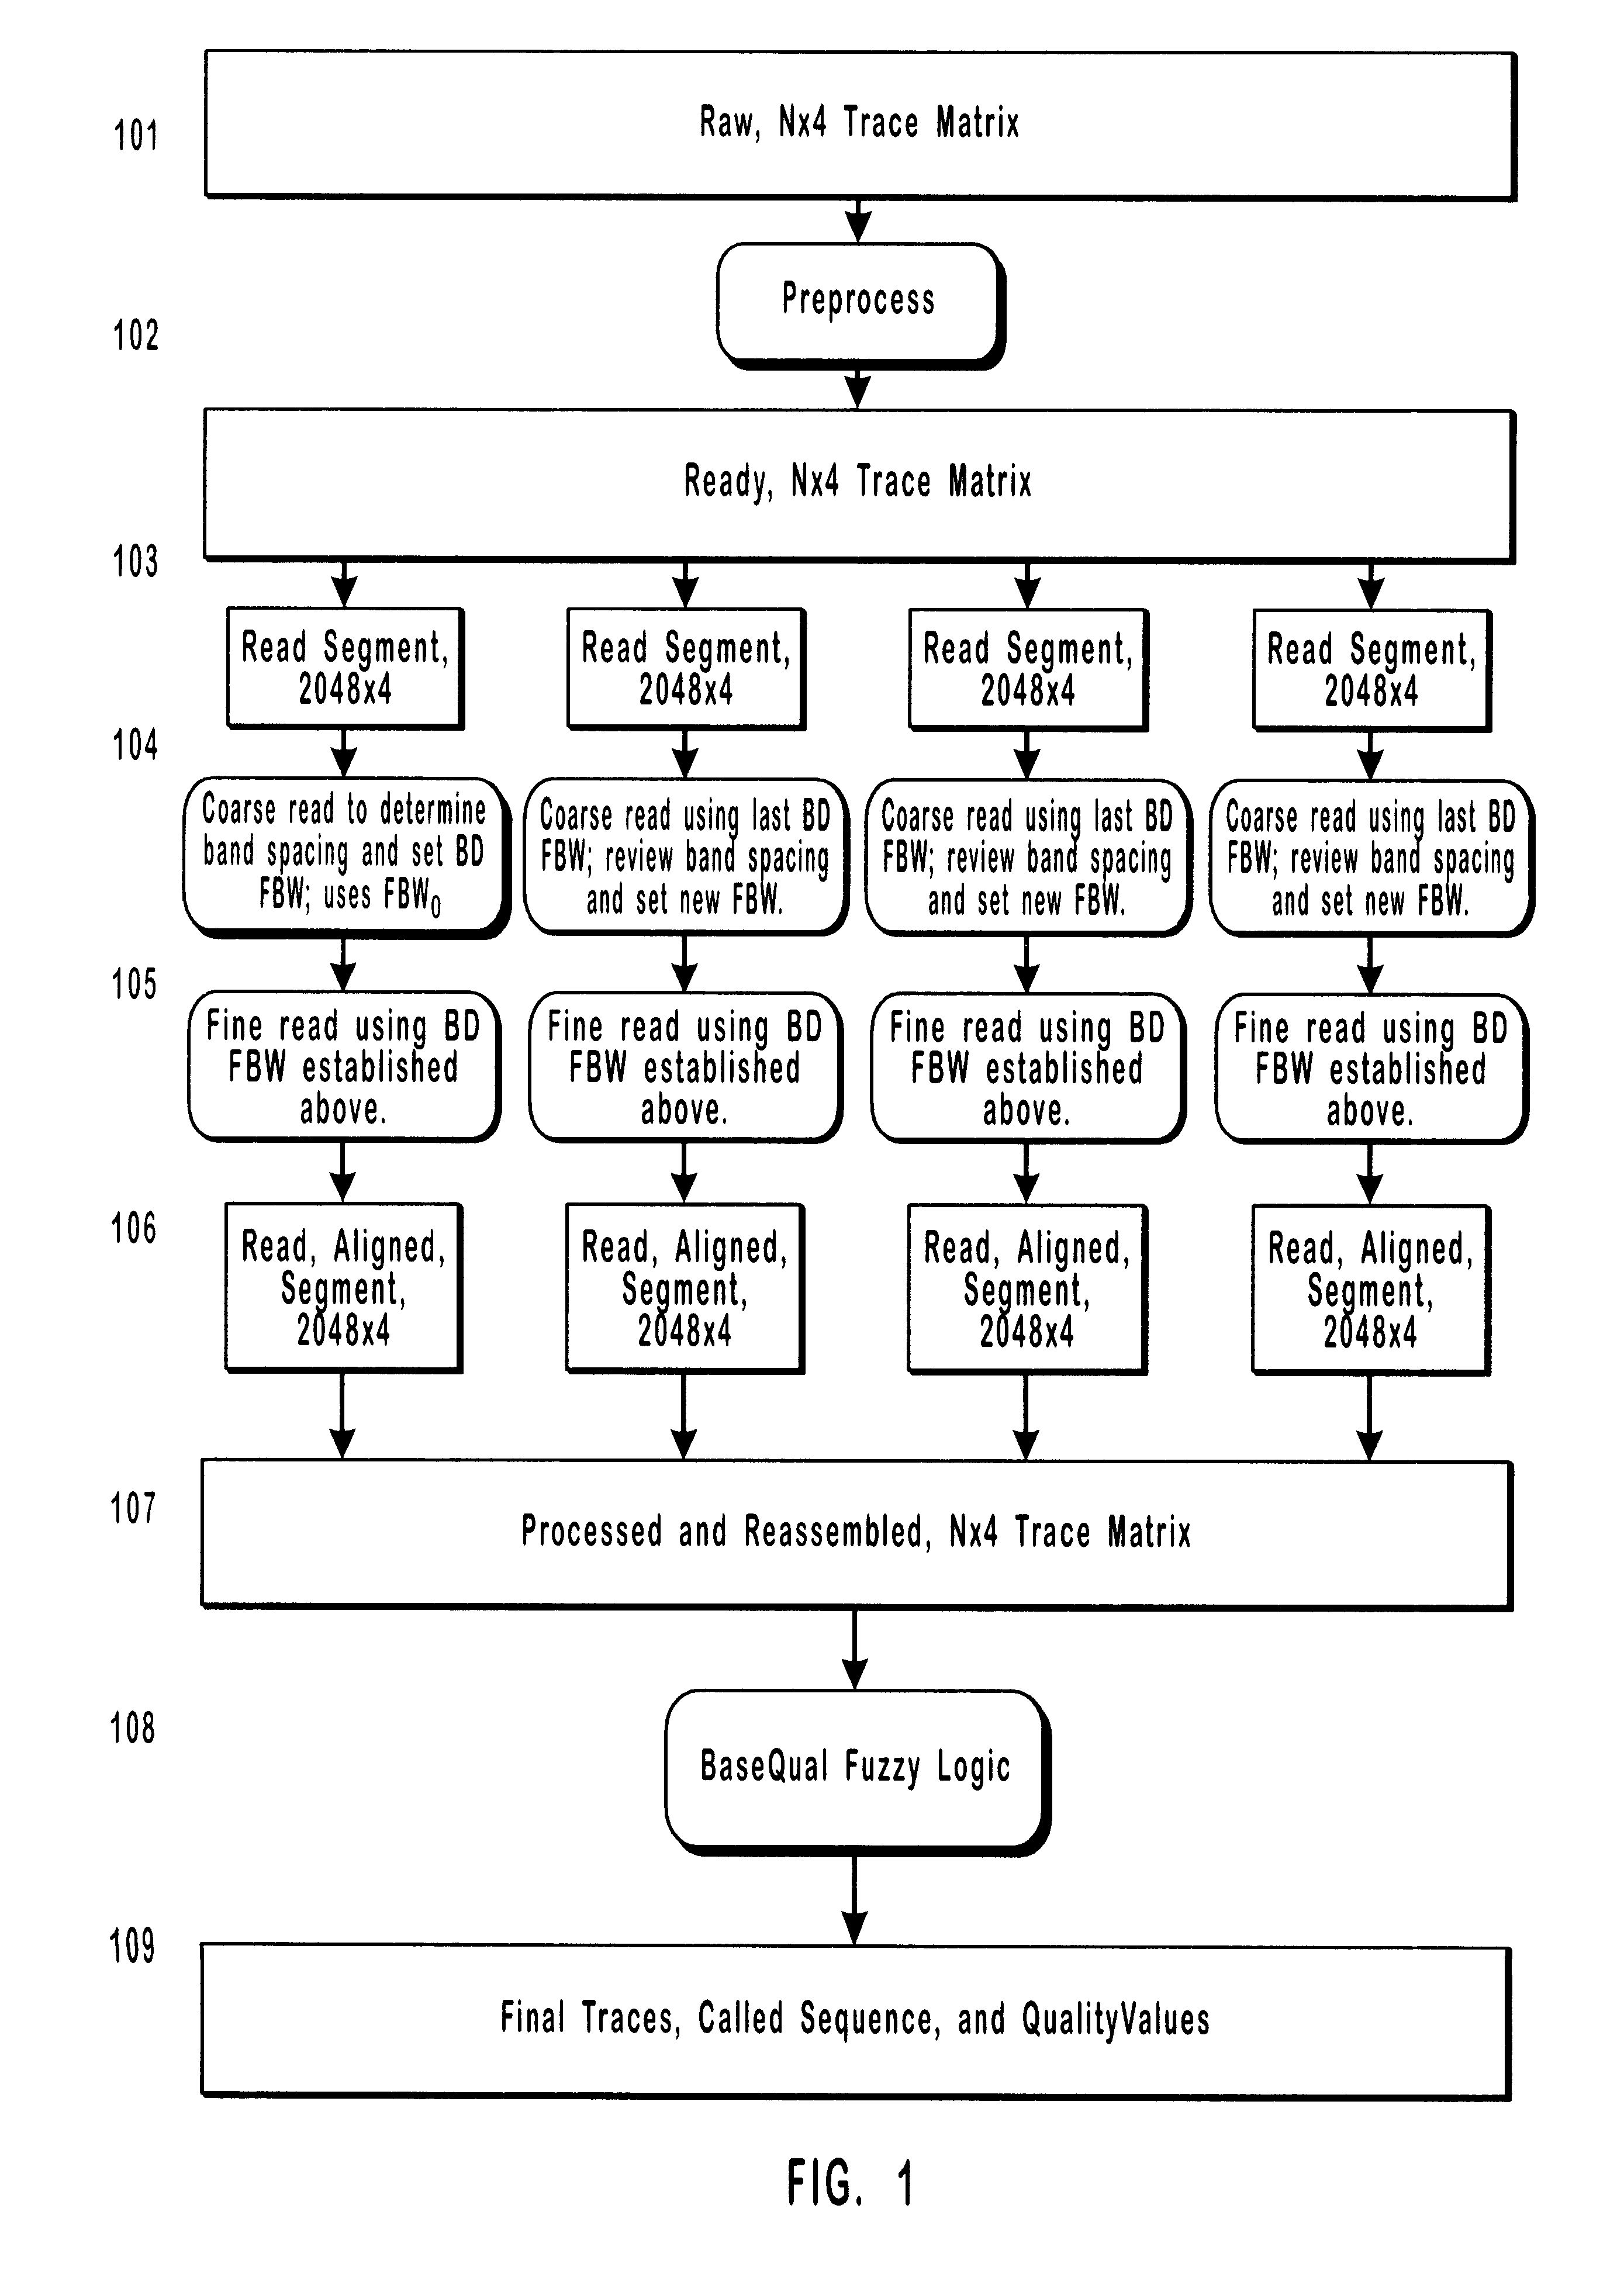
The present invention includes the steps of preprocessing signal data, reading successive sample segments, selecting blocks of high quality sequence and then producing traces of aligned high quality sequences. It is an advantage of the present invention that the chromatographic data may include single fluor samples fractionated in multiple lanes and multiple fluor samples fractionated in single lanes.
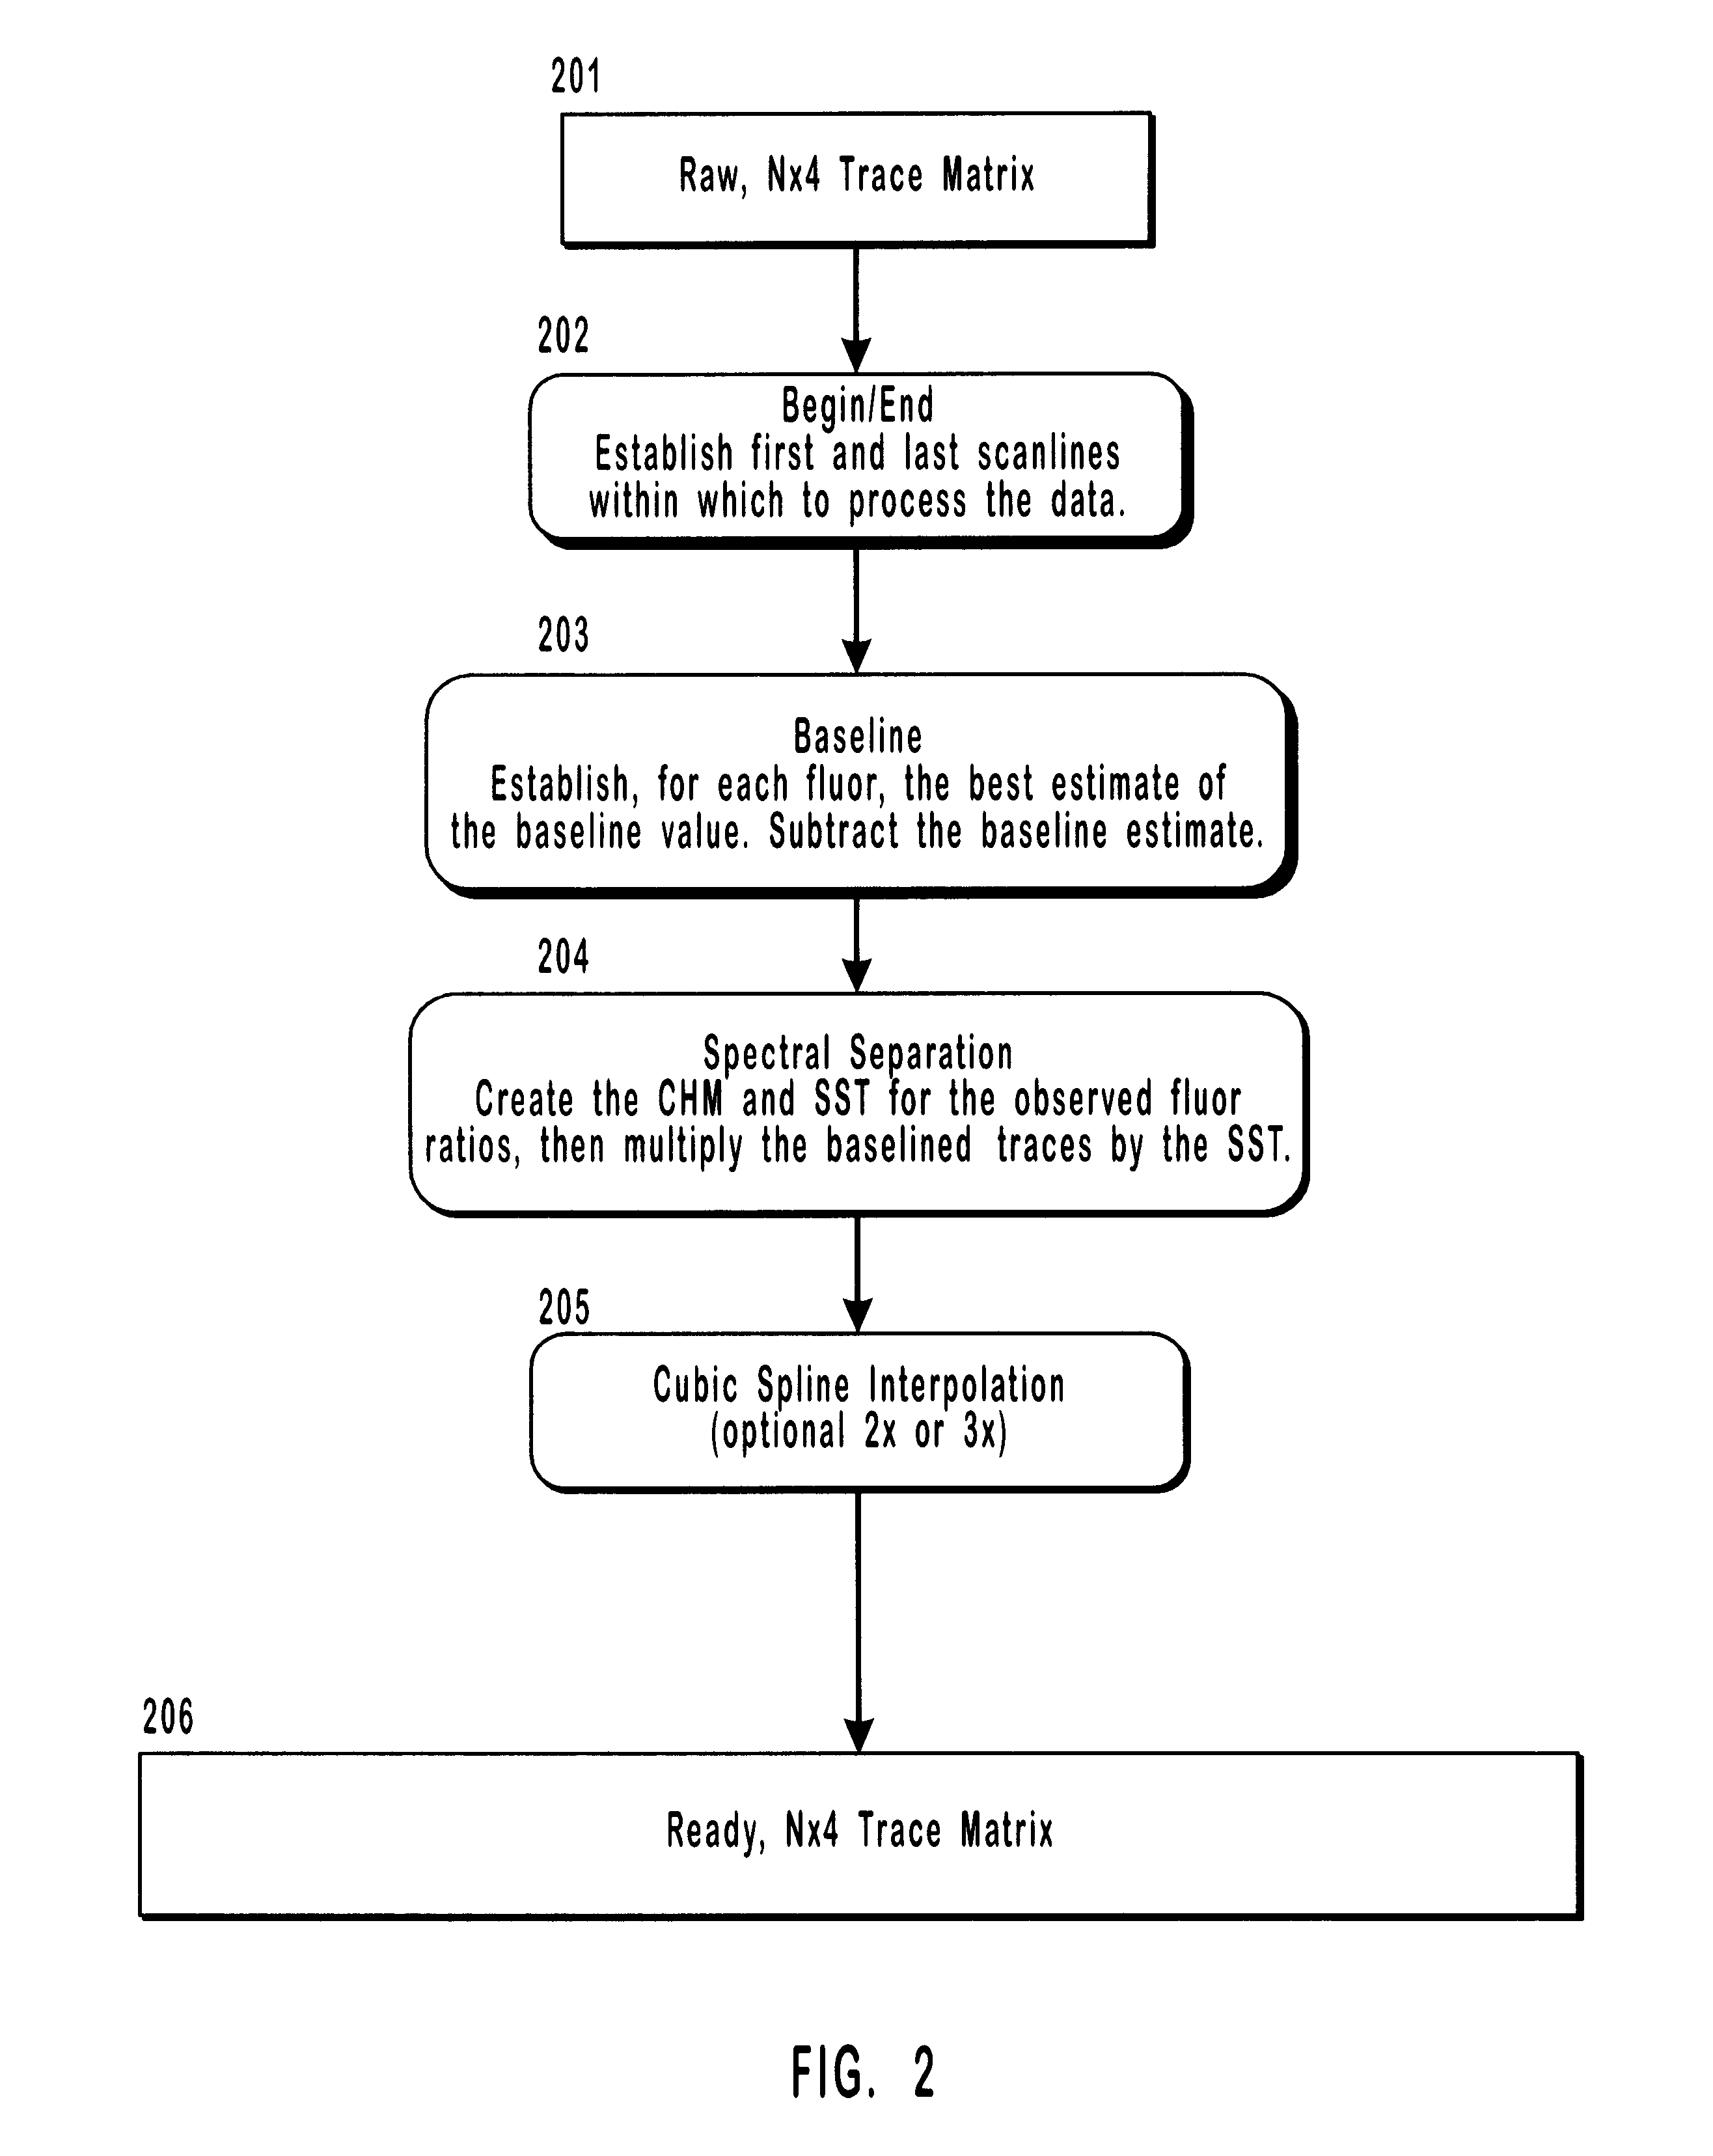
It is an object of the present invention to provide a method for preprocessing chromatographic data by baseline subtracting background noise. It is an advantage of the present invention that the method of baseline subtraction may be varied according to the type of chromatographic data being analyzed. It is a further advantage of the invention that sparse chromatographic data may be interpolated during preprocessing.
It is an object of the present invention to read the preprocessed signals in successive sample segments. It is an advantage that the sample segment size may be sufficiently large to provide for rapid and efficient signal analysis.
It is an object of the invention to provide a method and apparatus for detecting information-containing signals which are not uniformly distributed in the chromatographic data. This analytic technique uses iterative blind deconvolution to determine band frequency in sample segments. It is an advantage of the invention that the filter-band width is automatically varied during iteration to optimally detect the signals in the preprocessed chromatographic data. It is a further function of the invention to detect and correct signal data derived from chromatographic data which have segments which are short in one or more signal types (for example, "band-lite" signals).

Problems solved by technology

The Tibbetts' method is limited, however, by the quality of the chromatographic data.
Because chromatographic data frequently contain background noise and migration aberrations which obscure information-containing signals, analyses based on signal spacing may produce errors in signal identification.
Similarly, because signal intensity often varies in an unpredictable manner, signal identification based on intensity may also result in significant identification errors.
This method, however, is significantly limited in the following manner.
Second, the method requires user input of the BD filter bandwidth and programmer alterations to various thresholds.
Third, the Stockham and Ives method does not adequately deal with lane to lane mobility differences.
Fourth, the insertion / deletion and correction logic was too simple.
Sixth, the method of Stockham and Ives lacked the ability to align and merge adjacent sample segments.
Finally, that method lacked band quality measures useful in automatic data routing and or sequence assembly.

Method used


Image

  • Method and apparatus for analysis of chromatographic migration patterns
  • Method and apparatus for analysis of chromatographic migration patterns
  • Method and apparatus for analysis of chromatographic migration patterns

Examples


Embodiment Construction

). The top quality assessment, RULE QUAL90, is made of bands with absolutely nothing visually wrong with them (Step 1517). A band which matches this rule to some degree (again, given good quality input, many do) will assign a nonzero scale value to the output set with centroid near 100 (1519). Finally, as with all the other fuzzy logic blocks, the output sets are scaled with the strength of their respective rule firings, and the centroid is calculated to determine the final quality assessment.

E. Final Sequence Assembly

The final quality assessments from the BaseQual Fuzzy Logic analysis control the length of the final sequence 109. Where high quality sequence data is desired, the quality assessments determines may limit the read length of the final sequence. Where longer read lengths are desired, and lower quality sequence is acceptable, the quality assessments can aid is correlating the resulting sequence data from other sequence analysis. For example, when overlapping sequences are...


PUM

PropertyMeasurementUnit
Widthaaaaaaaaaa
Heightaaaaaaaaaa
Mobilityaaaaaaaaaa

Abstract

The present invention includes a method and apparatus for the detection and analysis of information-containing signals in chromatographic data using iterative blind deconvolution and fuzzy logic algorithms. The invented method analyzes chromatographic data from a wide variety of sources of DNA sequencing information, including gel and capillary electrophoresis. Autoradiograms, single-fluor, four-lane and four fluor, single lane fluorescent chromatographic data are suitable sources of unprocessed input data. The output from the invented base calling method includes called (identified) sequence data and quality values for the called bases.

Description

REFERENCE TO MICROFICHE APPENDIXA microfiche appendix, containing 5 microfiche and 229 total frames is filed herewith.A. Field of the InventionThis invention relates to the field of signal detection and analysis of chromatographic migration patterns as commonly applied to mixtures of molecules. More specifically, this invention relates to a method and apparatus for signal detection and analysis of chromatographic migration patterns as applied to the determination of DNA sequences.B. Description of Related ArtThe ability to efficiently and accurately detect and analyze information-containing signals in chromatographic data is important for handling large amounts of data. Such an ability is particularly important for projects such as the Human Genome Project, where large amounts of information will be generated which must be analyzed and integrated to produce a representative sequence of an entire human genome. To expedite the analysis of DNA sequence information, numerous methods hav...

Claims


Application Information

Patent Timeline
IPC IPC(8): C12Q1/70G01N15/06G01N33/50C12M1/00C12N15/00C12Q1/68C12Q1/6869G01N27/447
CPCC12Q1/6869G01N27/447
Inventor MARKS, ANDREW F.
Owner UNIV OF UTAH RES FOUND
Learn More