Method and apparatus for graphically representing information stored in electronic media

a technology of electronic media and information, applied in the field of methods and apparatus for graphically representing information stored, can solve the problems of limited data variation along the moving axis, limited mechanical display apparatus and methods, and difficulty in showing the maximum and minimum ranges of values attained over the entire data span, or any portion

Inactive Publication Date: 2001-04-03
MOYER TODD
View PDF2 Cites 120 Cited by
  • Summary
  • Abstract
  • Description
  • Claims
  • Application Information

AI Technical Summary

Benefits of technology

Current computerized display technologies represent data which varies temporarily or spatially much the same way that mechanical methods have been used for many years. Examples of such previous mechanical approaches are illustrated by using a pen to record a variable on a moving piece of paper. These apparatus, for example, may involve the variation of a stylus along a first display axis while the paper beneath the stylus is moved at a metered rate along a second axis. Thus a two axis, two dimensional representation of data is produced. The output of these mechanical display apparatus and methods is a continuous line which varies along one axis to indicate the value of the entity being recorded by the stylus (e.g. the instantaneous temperature of a location) while showing the temporal or spatial variations of the data along a second, moving axis (e.g. per hour). These mechanical display apparatus and methods are limited, however, in that only a small number of display entities can legibly be shown along the stationary display axis. Further, the data's variation along the moving a...

Problems solved by technology

These mechanical display apparatus and methods are limited, however, in that only a small number of display entities can legibly be shown along the stationary display axis.
Further, the data's variation along the moving axis is limited by typical lengths of usable paper and/or screen display areas, particularly where the range of temporal or spatial data variation is large or where a large quantity of data is involved.
In particular, it is difficult to show the maximum and minimum ranges of values attained over the entire data span, or any portion thereof, particularly where multiple display entities are shown.
In such a representation, however, only a limited number of stocks may be displayed on a single display before the number of stocks being displayed overwhelms the display, thereby making it unreadable.
Such a method of displaying data is inherently difficult to read and interpret.
In this representation, however, only one s...

Method used


Image

  • Method and apparatus for graphically representing information stored in electronic media
  • Method and apparatus for graphically representing information stored in electronic media
  • Method and apparatus for graphically representing information stored in electronic media

Examples


Embodiment Construction

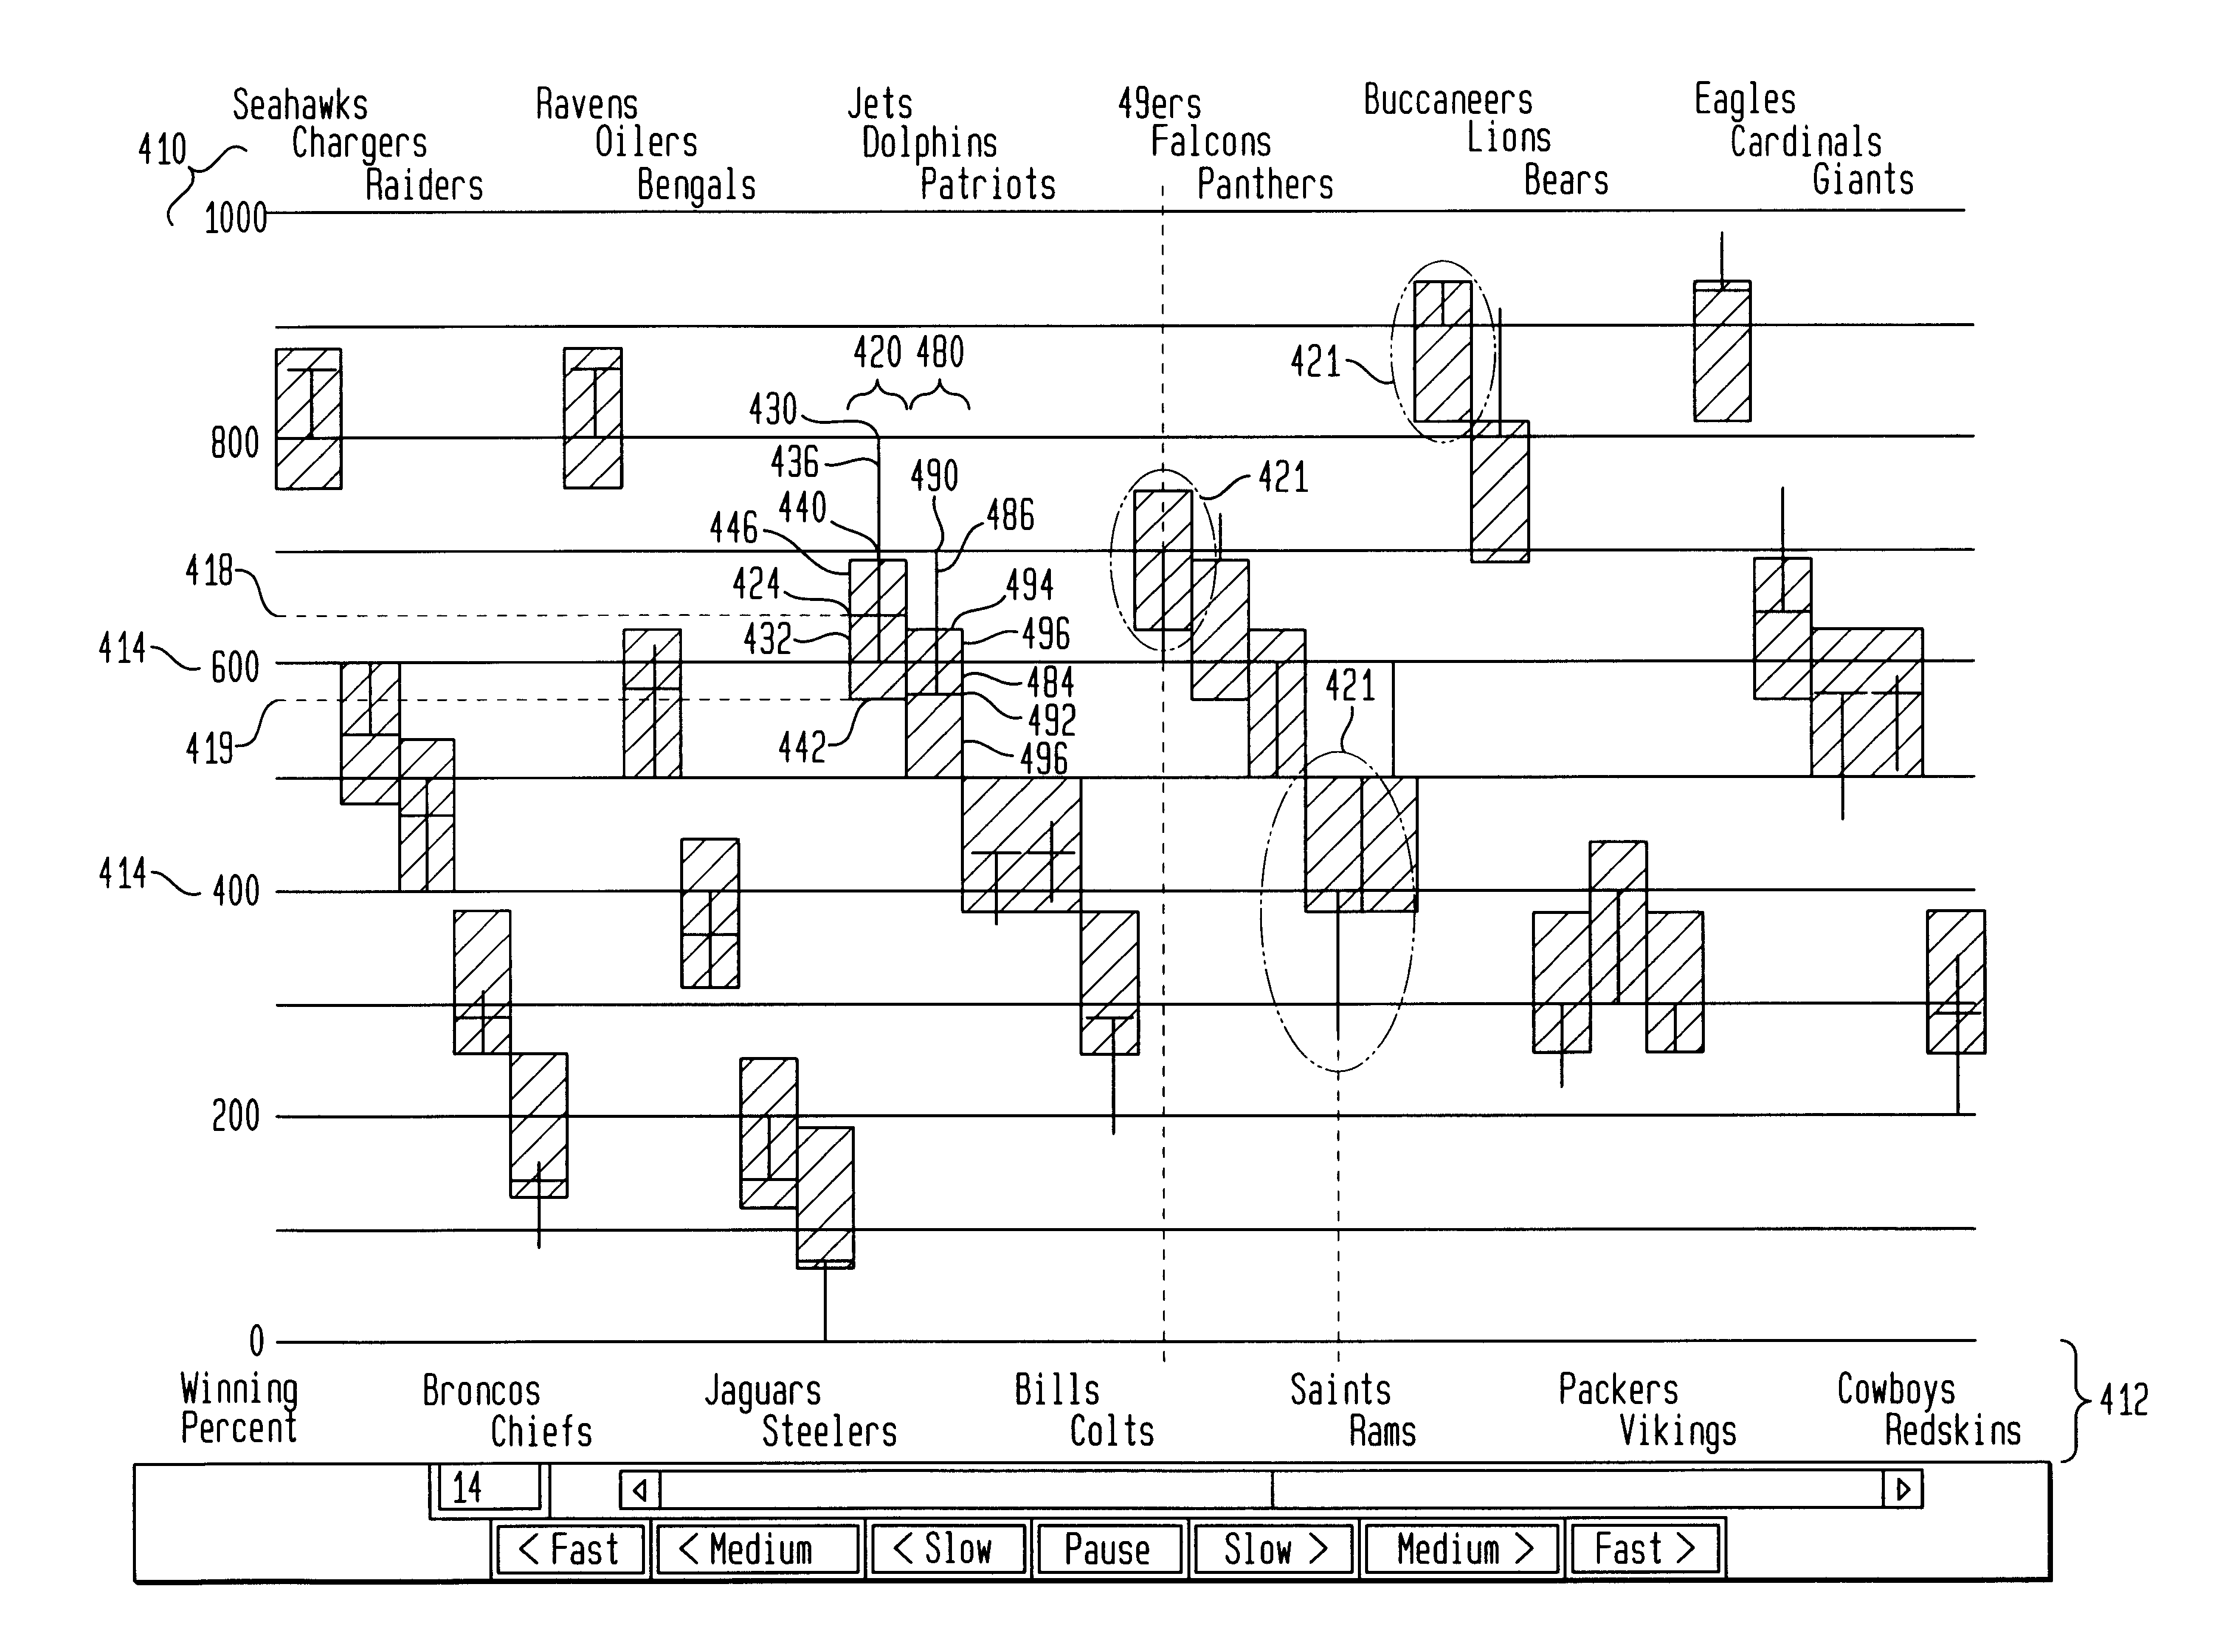
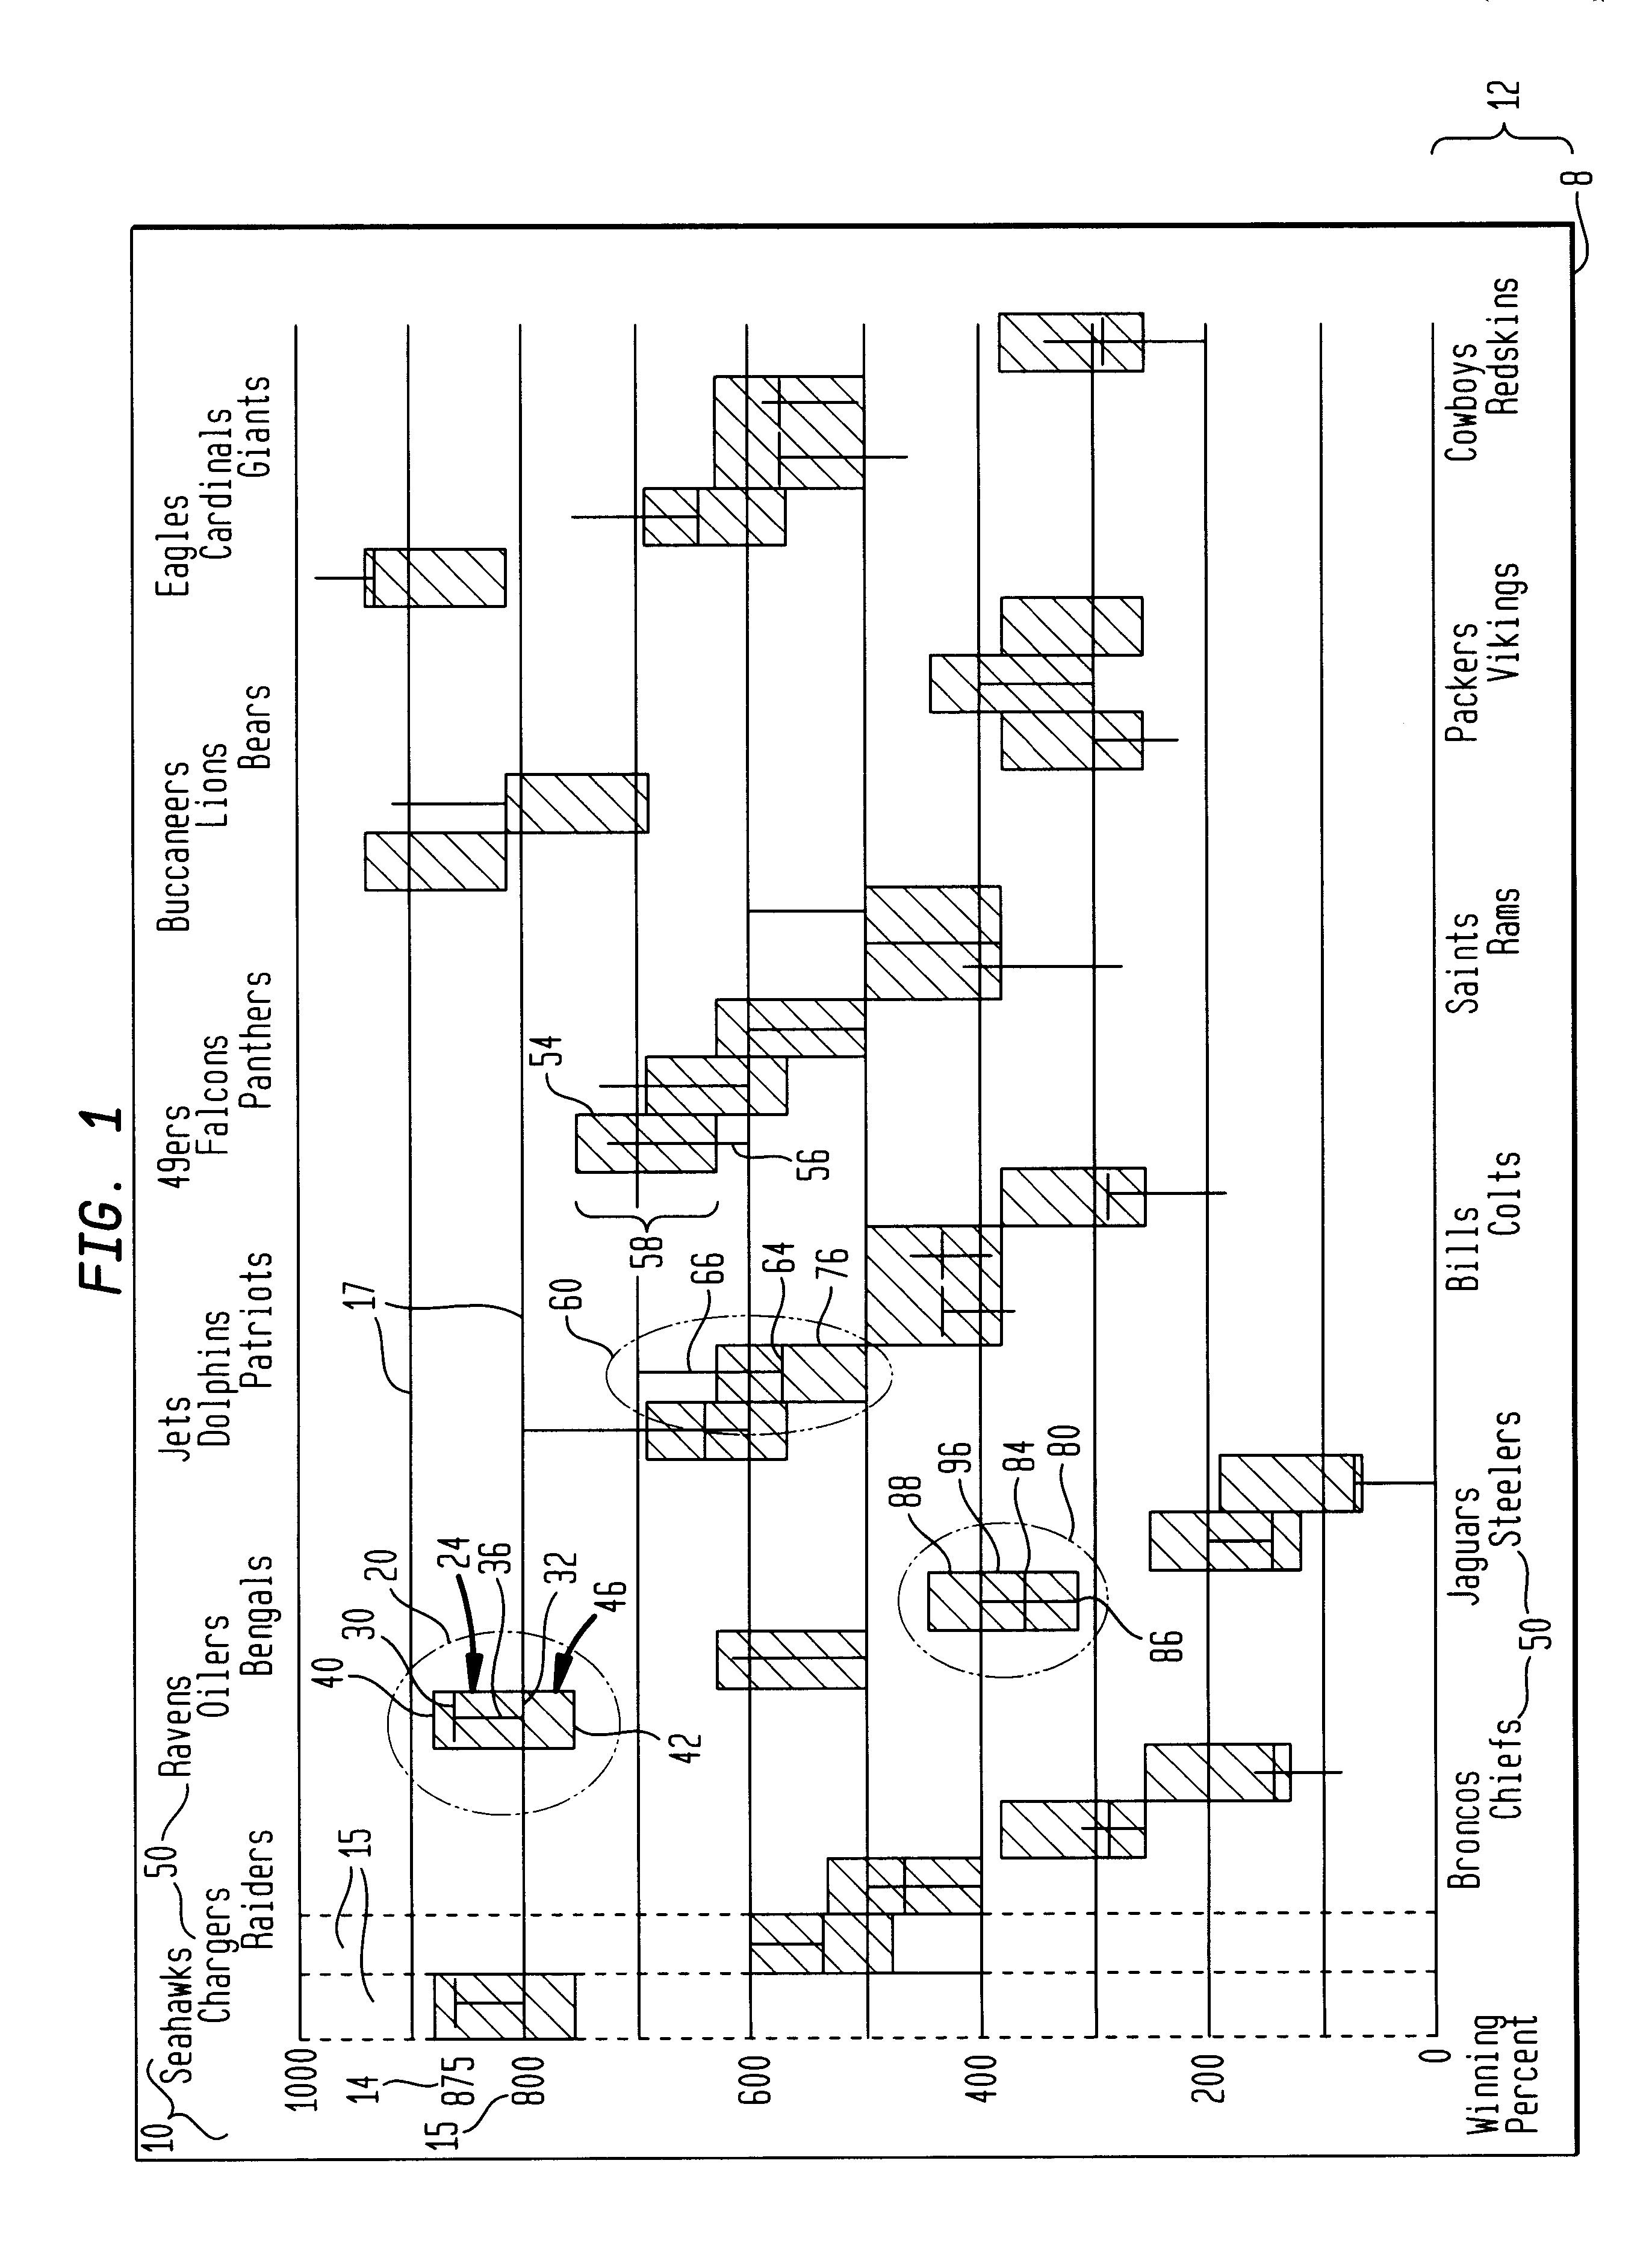
FIG. 1 shows a computer screen display of the present invention. The screen display is under the control of a computer with a microprocessor executing software that is designed to produce the display from electronically input data. Numerous entities, represented by the various football teams of FIG. 1, and data associated with each entity, represented by the horizontal and vertical markings beneath and above the team names, are shown. The computer-implemented display system includes a screen display 5 and a frame 8 within which the data and the entities are displayed. A first frame ordinant or axis 10 is located in a fixed position along the left-hand side of the display. Entity display areas 15 are displayed in non-overlapping, fixed positions along a second frame ordinant or axis 12. Entity display areas 15 are shown in FIG. 1 as vertical, strip-like areas extending from the bottom to the top of frame 8. Since the entity display areas are small in width, a number of them can be di...


PUM


Abstract

Apparatus and methods for displaying dynamic electronic data are provided for a computer-based display system. The apparatus includes a display, a frame within the display for displaying the data and a measure along a first frame axis for indicating a value of the displayed data. Entity display areas, each containing one entity defined by five data points, are displayed within the frame in non-overlapping, fixed positions along a second frame axis. The five data points include: a current data point, represented by a marker and indicting a current value of the entity in the display, first and second end data points of a first data range relating to the entity, represented by a first range marker, and first and second end data points of a second data range relating to the entity, represented by a second range marker. A label associated with the entities is also displayed in a fixed position with respect to the entity display areas. In one method of the invention, the dynamic data is displayed in sequential frames wherein the current marker and first and second range markers move dynamically within the entity display area to reflect the changing data related to each entity.

Description

REFERENCE TO MICROFICHE APPENDIXThe present application includes a microfiche appendix consisting of one slide and 70 frames of computer program listings, according to the requirements of 37 CFR 1.96(c).The present invention relates generally to apparatus and methods for graphically representing dynamic, electronic data on a computer monitor or other video screen. More particularly, the present invention is directed to apparatus and methods for displaying electronic data that varies over a range or a continuum, such as time. Further, the display of the present invention is capable of coherently displaying, for comparison purposes, numerous display members or entities on a single display, as well as showing the variation of the entity data over the continuum.BACKGROUND AND OBJECTS OF THE INVENTIONCurrent computerized display technologies represent data which varies temporarily or spatially much the same way that mechanical methods have been used for many years. Examples of such previ...

Claims


Application Information

Patent Timeline
IPC IPC(8): G06F19/00G06F17/30
CPCG06F17/30994G06F16/904
Inventor MOYER, TODD
Owner MOYER TODD
Why Eureka
Try Eureka