Estimating graphics system performance for polygons

a graphics system and polygon technology, applied in the field of computer graphics, can solve the problems of increasing the complexity and amount of data being sent to the display device, affecting the display effect, and incorporating graphics processors with a great deal of processing power,

Inactive Publication Date: 2001-11-06
ORACLE INT CORP
View PDF6 Cites 169 Cited by
  • Summary
  • Abstract
  • Description
  • Claims
  • Application Information

AI Technical Summary

Problems solved by technology

Modem graphics systems, however, incorporate graphics processors with a great deal of processing power.
This change is due to the recent increase in both the complexity and amount of data being sent to the display device.
Similarly, the images displayed are now more complex and may involve advanced rendering techniques such as anti-aliasing and texture mapping.
As a result, without considerable processing power in the graphics system, the CPU would spend a great deal of time performing graphics calculations.
This could rob the computer system of the processing power needed for performing other tasks associated with program execution and thereby dramatically reduce overall system performance.
Wherein this technique improves realism, it also increases the processing burden on a graphics system.
Thus, the "overhead" of setting up each polygon consumed a relatively small portion of the graphics system's overall processing resources, while the process of interpolating the pixelswithin the polygon used the majority of the graphic system's processing power.
These systems are referred to as "pixel fill limited" because the limiting performance factor is the number of pixels the graphics system is capable of calculating.
Thus, the work of setting up polygons may need more time than the actual pixel calculation process.
These systems are referred to as "polygon overhead limited" because the overhead associated with setting up polygons is the performance limiting factor.
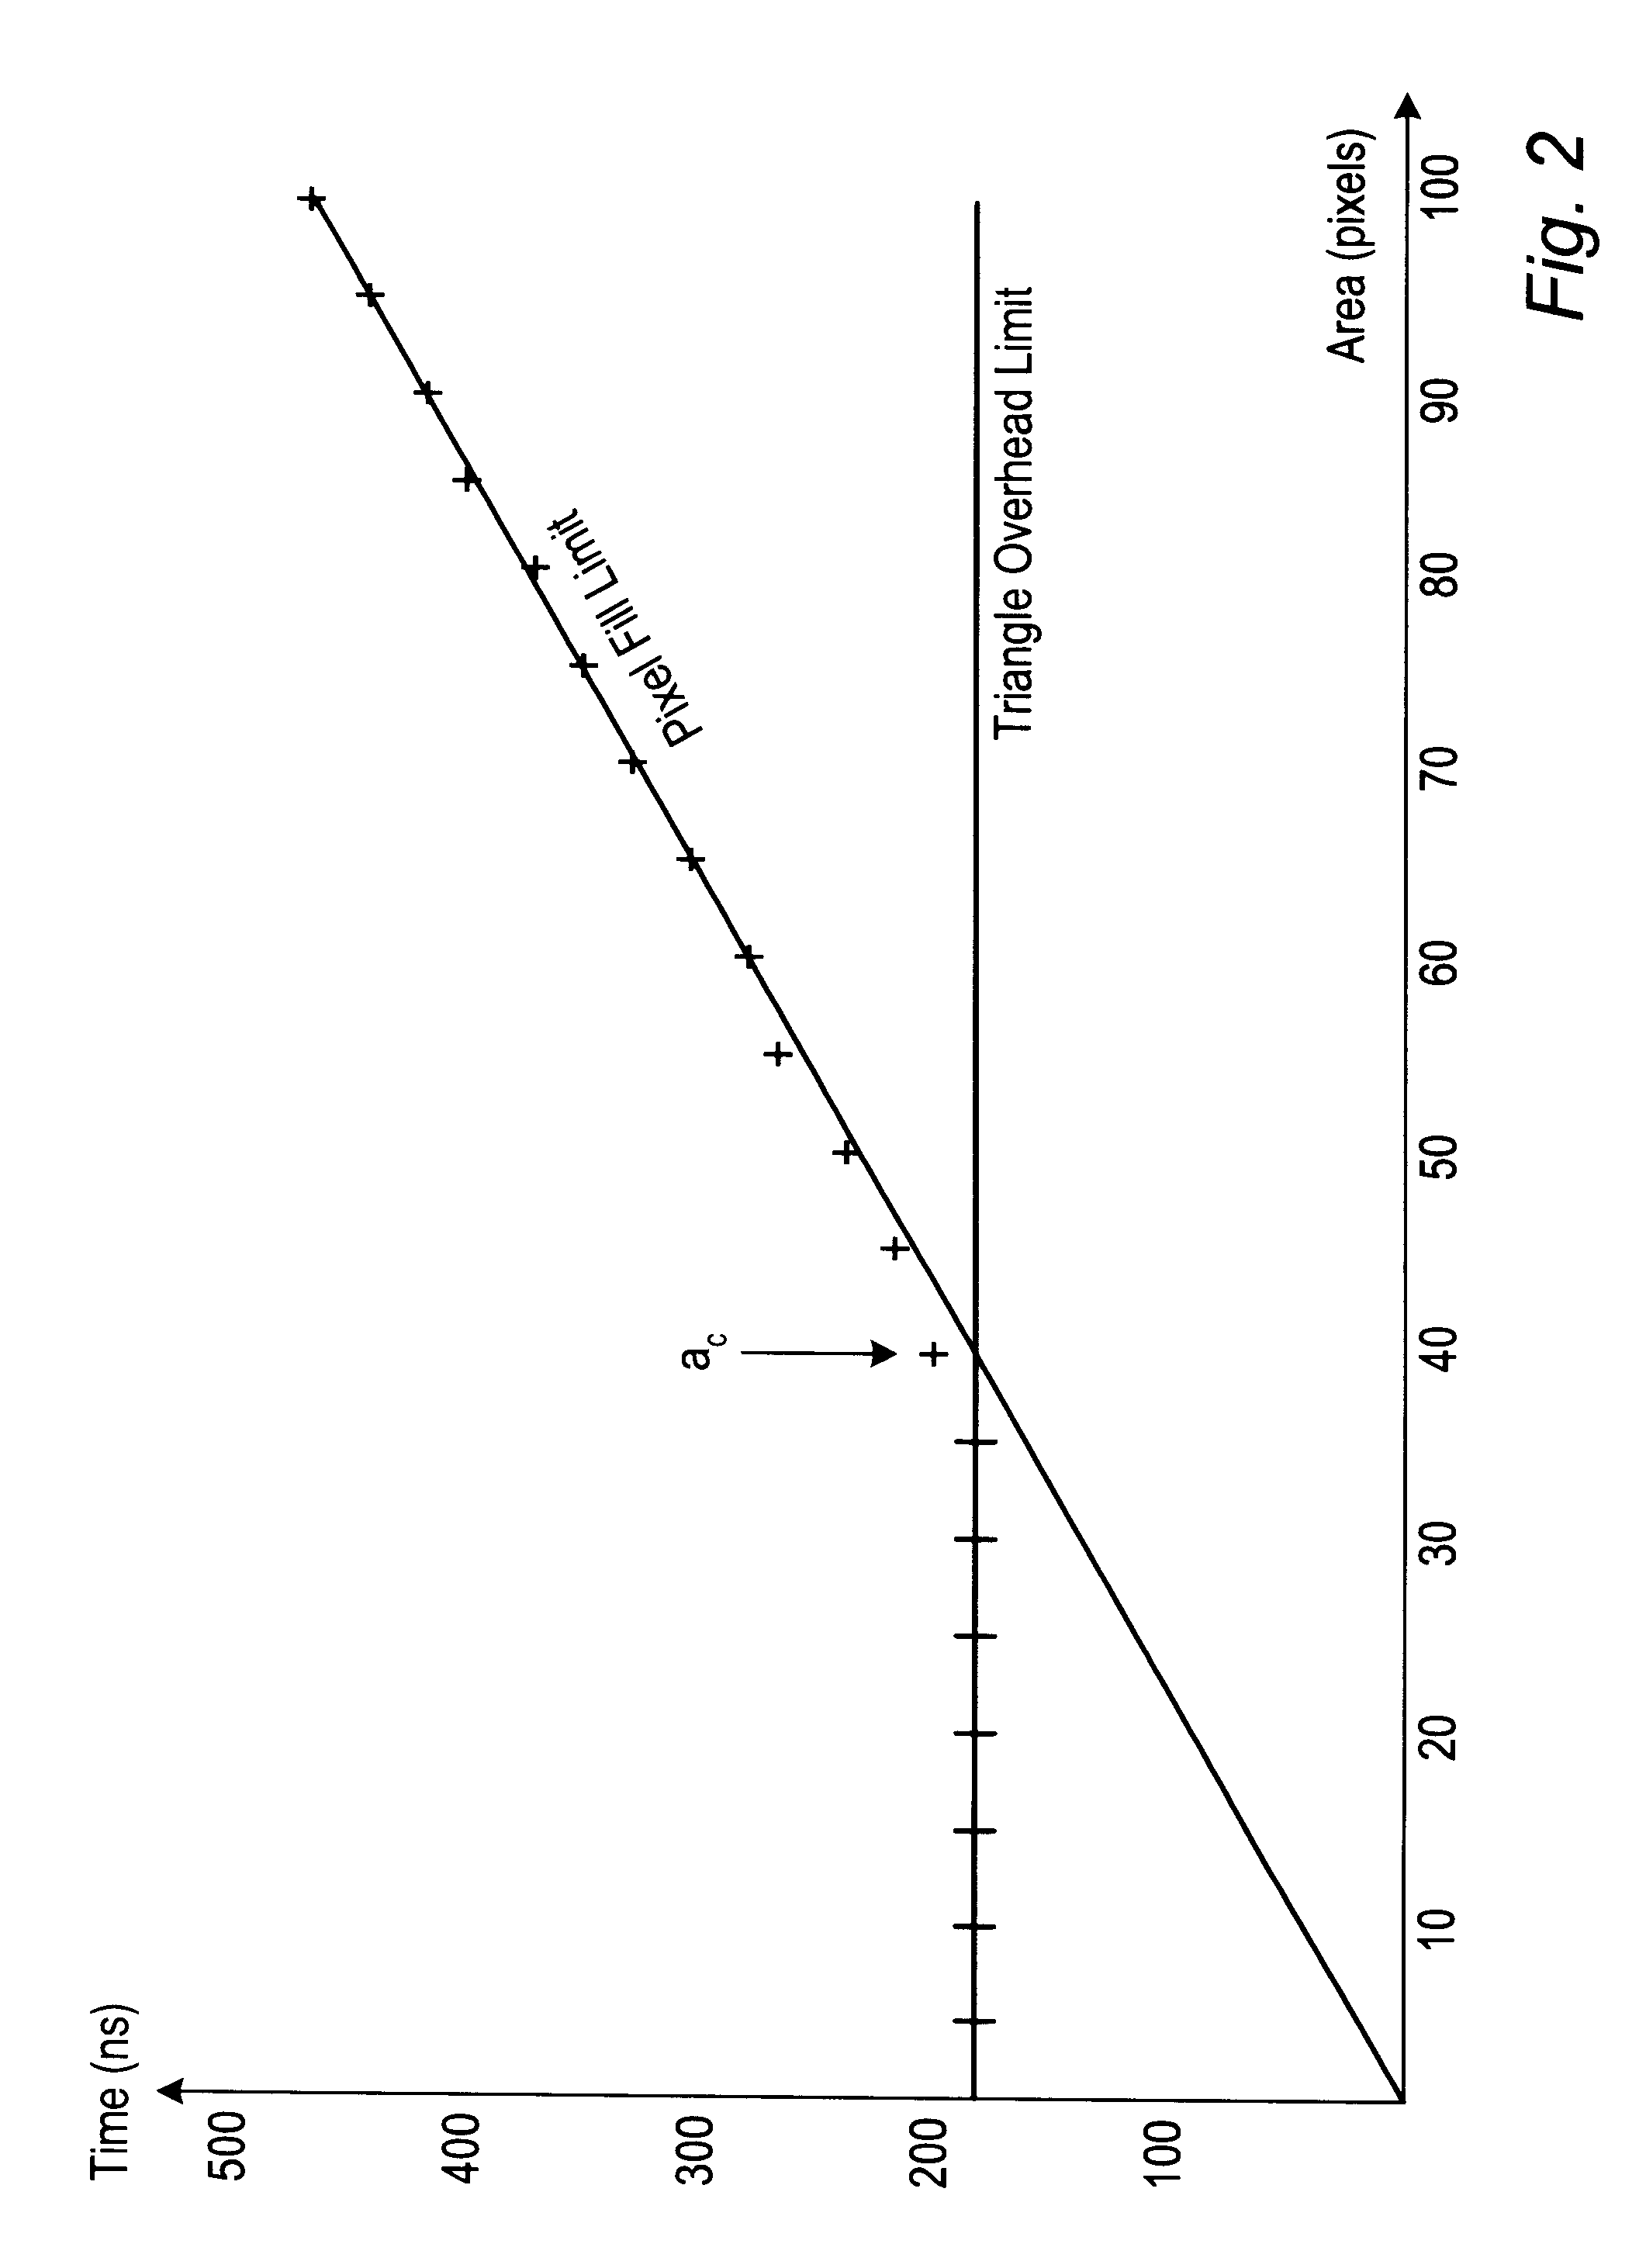
As shown in the figure, once the polygon area falls below a particular size a.sub.c, the system's performance is limited by the polygon overhead.
Similarly, once, the polygon size rises above ac, performance is limited by the maximum pixel fill rate.
However, even with these gre

Method used


Image

  • Estimating graphics system performance for polygons
  • Estimating graphics system performance for polygons
  • Estimating graphics system performance for polygons

Examples


Embodiment Construction

Computer System--FIG. 3

Referring now to FIG. 3, one embodiment of a computer system 80 which includes a three-dimensional (3-D) graphics system is shown. The 3-D graphics system may be comprised in any of various systems, including a computer system, network PC, Internet appliance, a television, including HDTV systems and interactive television systems, personal digital assistants (PDAs), flight simulators, driving simulators, ship simulators, virtual reality environments, and other devices which display 2D and or 3D graphics, among others.

As shown, the computer system 80 comprises a system unit 82 and a video monitor or display device 84 coupled to the system unit 82. The display device 84 may be any of various types of display monitors or devices (e.g., a CRT, LCD, or gas-plasma display). Various input devices may be connected to the computer system, including a keyboard 86 and / or a mouse 88, or other input device (e.g., a trackball, digitizer, or tablet). Application software may...


PUM


Abstract

A method for estimating rendering times for three-dimensional graphics objects and scenes is disclosed. The rendering times may be estimated in real-time, thus allowing a graphics system to alter rendering parameters (such as level of detail and number of samples per pixel) to maintain a predetermined minimum frame rate. Part of the estimation may be performed offline to reduce the time required to perform the final estimation. The method may also detect whether the objects being rendered are pixel fill limited or polygon overhead limited. This information may allow the graphics system to make more intelligent choices as to which rendering parameters should be changed to achieve the desired minimum frame rate. A software program configured to efficiently estimate rendering times is also disclosed.

Description

1. Field of the InventionThis invention relates generally to the field of computer graphics and, more particularly, to estimating the polygon rendering performance of three-dimensional graphics systems.2. Description of the Related ArtA computer system typically relies upon its graphics system for producing visual output on the computer screen or display device. Early graphics systems were only responsible for taking what the processor produced as output and displaying it on the screen. In essence, they acted as simple translators or interfaces. Modem graphics systems, however, incorporate graphics processors with a great deal of processing power. They now act more like coprocessors rather than simple translators. This change is due to the recent increase in both the complexity and amount of data being sent to the display device. For example, modern computer displays have many more pixels, greater color depth, and higher refresh rates than earlier models. Similarly, the images displ...

Claims


Application Information

Patent Timeline
IPC IPC(8): G06T15/00G09G5/36
CPCG06T15/00G06T15/005G06T2200/16
Inventor DEERING, MICHAEL F.
Owner ORACLE INT CORP
Why Eureka
Try Eureka