Methods for improving performance and reliability of biosensors

a biosensor and reliability technology, applied in the field of predictive kinetic methods, can solve the problems of large variable dependencies, limited linear ranges, and high noise dependen

Inactive Publication Date: 2005-04-26
ANIMAS TECH +1
View PDF15 Cites 437 Cited by
  • Summary
  • Abstract
  • Description
  • Claims
  • Application Information

AI Technical Summary

Problems solved by technology

However, such traditional rate methods have the following disadvantages: large variable dependencies; limited linear ranges; high dependency on noise; and, low sensitivity.
However, when using such equilibrium methods the aquisition of data is slow and typically requires background correction as well.
Further, in such methods there is a higher chance of side reactions taking place given the long time frame required to obtain the equilibrium data.

Method used


Image

  • Methods for improving performance and reliability of biosensors
  • Methods for improving performance and reliability of biosensors
  • Methods for improving performance and reliability of biosensors

Examples


example 1

Preliminary Studies

[0217]The data was collected at room temperature using the GlucoWatch biographer. In these studies, the biosensor was assembled and preconditioned for one hour. Ten microliters of glucose solution of known concentration was then deposited on the hydrogel. The electrode response to the glucose was monitored for 60 minutes. The current responses were then transferred to a computer for data processing.

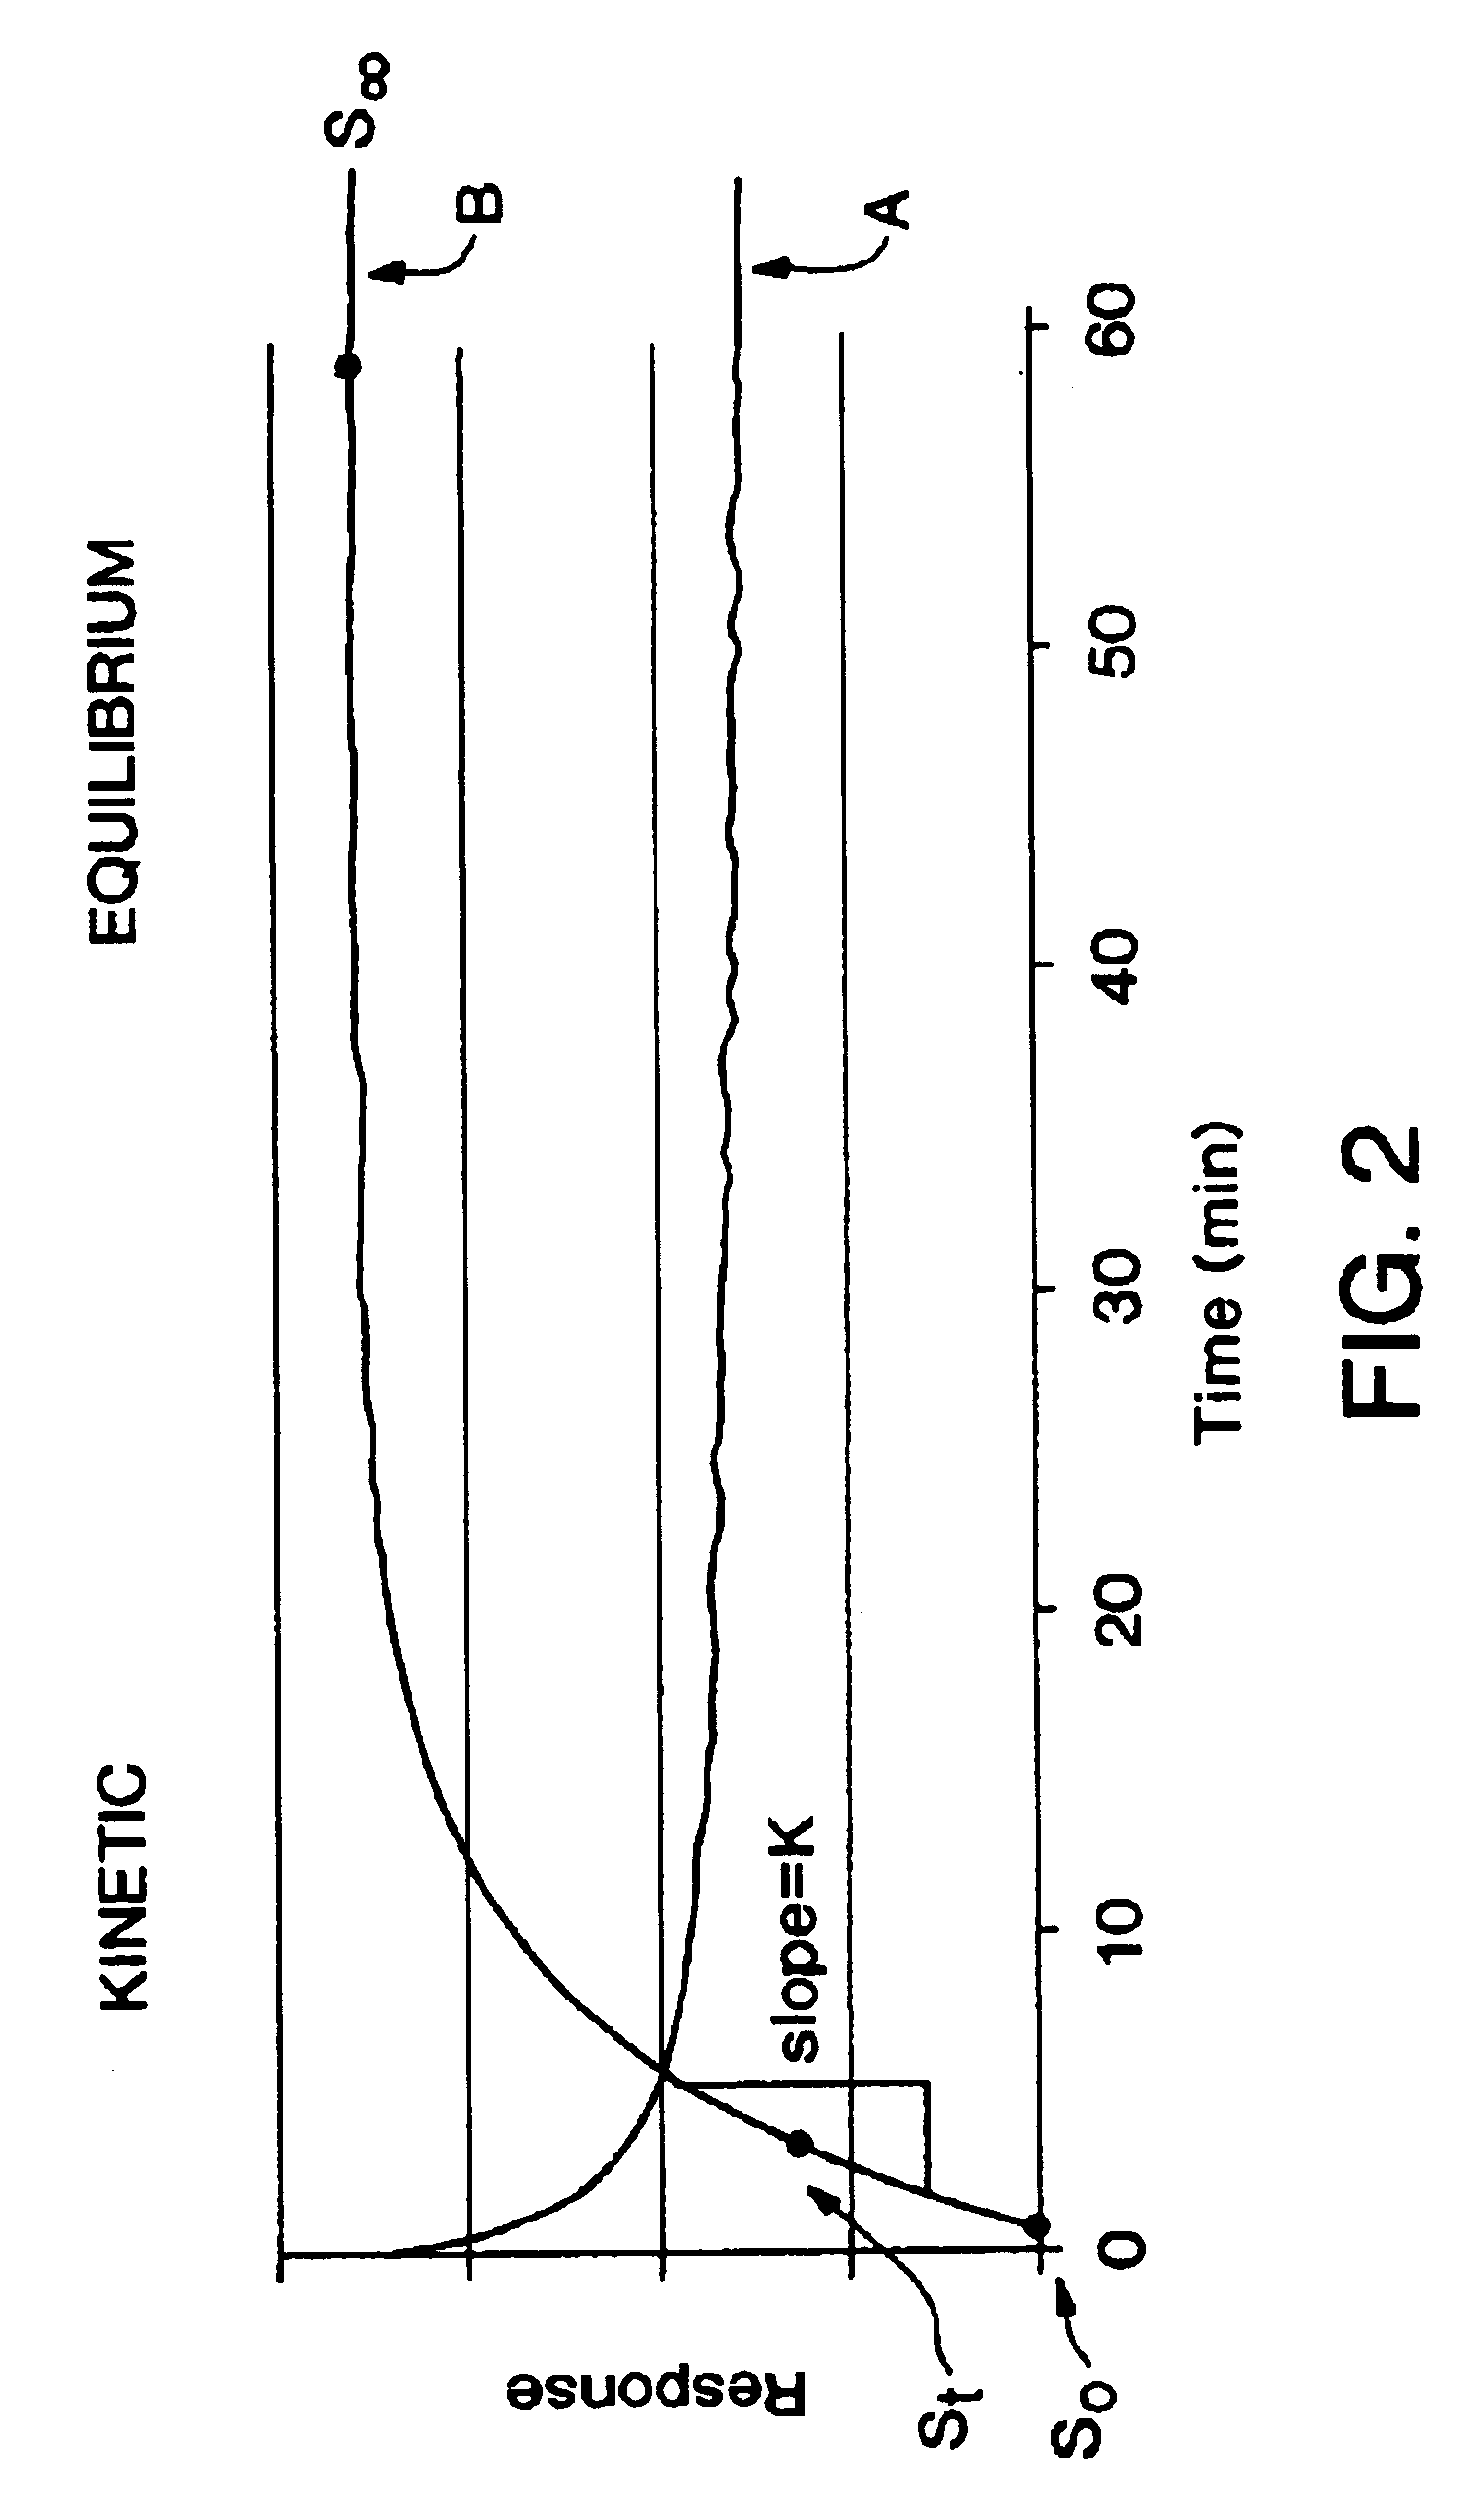
[0218]In FIGS. 3 and 4, the points are experimental data for response of the biographer to 200 μmol / L glucose and the solid curve is fit to the data using the first-order model:

St=S∞−(S∞−So)e−kt  (Eqn. 1)

where So, St, and S∞ are initial, intermediate, and final signals, k and t are the first-order rate constant and time, respectively. The experimental response was obtained by first applying preconditioning potentials at 0.77V vs. Ag / AgCl for 10 min, followed by a step down to 0.42V vs. Ag / AgCl for 50 min. At the end of the 60 min preconditioning period, 10 μL of the 20...

example 2

Further Modeling Studies

[0222]In this study the responses of the biographer to different concentrations of glucose (25 to 200 μmol / L) was monitored using the procedure described in Example 1. The concentration range covered the extracted glucose values, as determined using a biographer, found in patients with diabetes. The experiment was performed at room temperature using sensors of moderate sensitivity. There were six replicate measurements at each concentration. The first-order model was fitted to the integrated data using several half-lives. The first half-life was 250 secs. FIG. 6 presents a plot of the predicted charge, obtained with the predictive-kinetic method, vs. the theoretical charge.

[0223]During the measurement of glucose, the biosensor current is integrated as a function of time. The integral of an electrical current is an electrical charge (Q=I×t). Because the total amount of glucose added to the biosensor in this experiment and the number of electrons released durin...

example 3

First Order Versus Parallel-First Order for Fitting Clinical Data

[0231]Modeling of clinical data obtained from patients with diabetes demonstrated that the parallel multiple first order model fits clinical signal from the biographer's biosensor more accurately than first order model. This is, at least in part, because the biographer is used in such a fashion that involves at least two rate processes—initial reaction at the electrode and at least one parallel reaction, in this case where the second parallel reaction may be mutarotation and diffusion dependent. During the three-minute extraction cycle used by the biographer, glucose accumulates in the hydrogel near the reactive face of the biosensor, and once the potential is applied a large current response is observed. This gives rise to the first rate process. Further rate processes can be due to other factors such as mutarotation and diffusion of glucose through the hydrogel. These further processes are typically much slower proce...


PUM


Abstract

The present invention relates to a predictive-kinetic method for use with data processing of a sensor-generated signal, as well as, microprocessors and monitoring systems employing such a predictive-kinetic method. Data from a transient region of a signal is used with suitable models and curve-fitting methods to predict the signal that would be measured for the system at the completion of the reaction. The values resulting from data processing of sensor response using the methods of the present invention are less sensitive to measurement variables.

Description

CROSS-REFERENCE TO RELATED APPLICATIONS[0001]This application is related to U.S. Provisional Patent Applications Ser. Nos. 60 / 204,397, filed May 16, 2000, and 60 / 244,078, filed Oct. 27, 2000, from both of which priority is claimed under 35 USC § 119(e)(1), and which applications are incorporated herein by reference in their entireties.TECHNICAL FIELD[0002]The present invention relates generally to the use of a predictive-kinetic method to reduce the effects of measurement variables on results obtained using analyte sensors. The invention includes a method and device for measuring the concentration of target analytes present in a biological system, for example, a mammalian subject. More particularly, the invention relates to methods, microprocessors, and monitoring systems for predicting an amount or concentration of an analyte using a series of measurements obtained from a monitoring system and employing a predictive-kinetic algorithm.BACKGROUND OF THE INVENTION[0003]Measurement and...

Claims


Application Information

Patent Timeline
Patent Type & Authority Patents(United States)
IPC IPC(8): A61B5/00
CPCA61B5/14532A61B5/1486A61B5/14514
Inventor PARRIS, NORMAN A.POTTS, RUSSELL O.TIERNEY, MICHAEL J.UHEGBU, CHRISTOPHER
Owner ANIMAS TECH
Why Eureka
Try Eureka