
Methods, system and computer program products for dynamic filtering of network performance test results

a network performance and test result technology, applied in the field of data analysis, can solve the problems of not being able to detect system slowdown or failure, not having the ability to be consistent or repeatable, and not having the time for it managers to manage network performance proactively, so as to facilitate analysis of those results and achieve greater resolution

Inactive Publication Date: 2005-05-31
NETIQ
View PDF22 Cites 137 Cited by
  • Summary
  • Abstract
  • Description
  • Claims
  • Application Information

AI Technical Summary

Benefits of technology

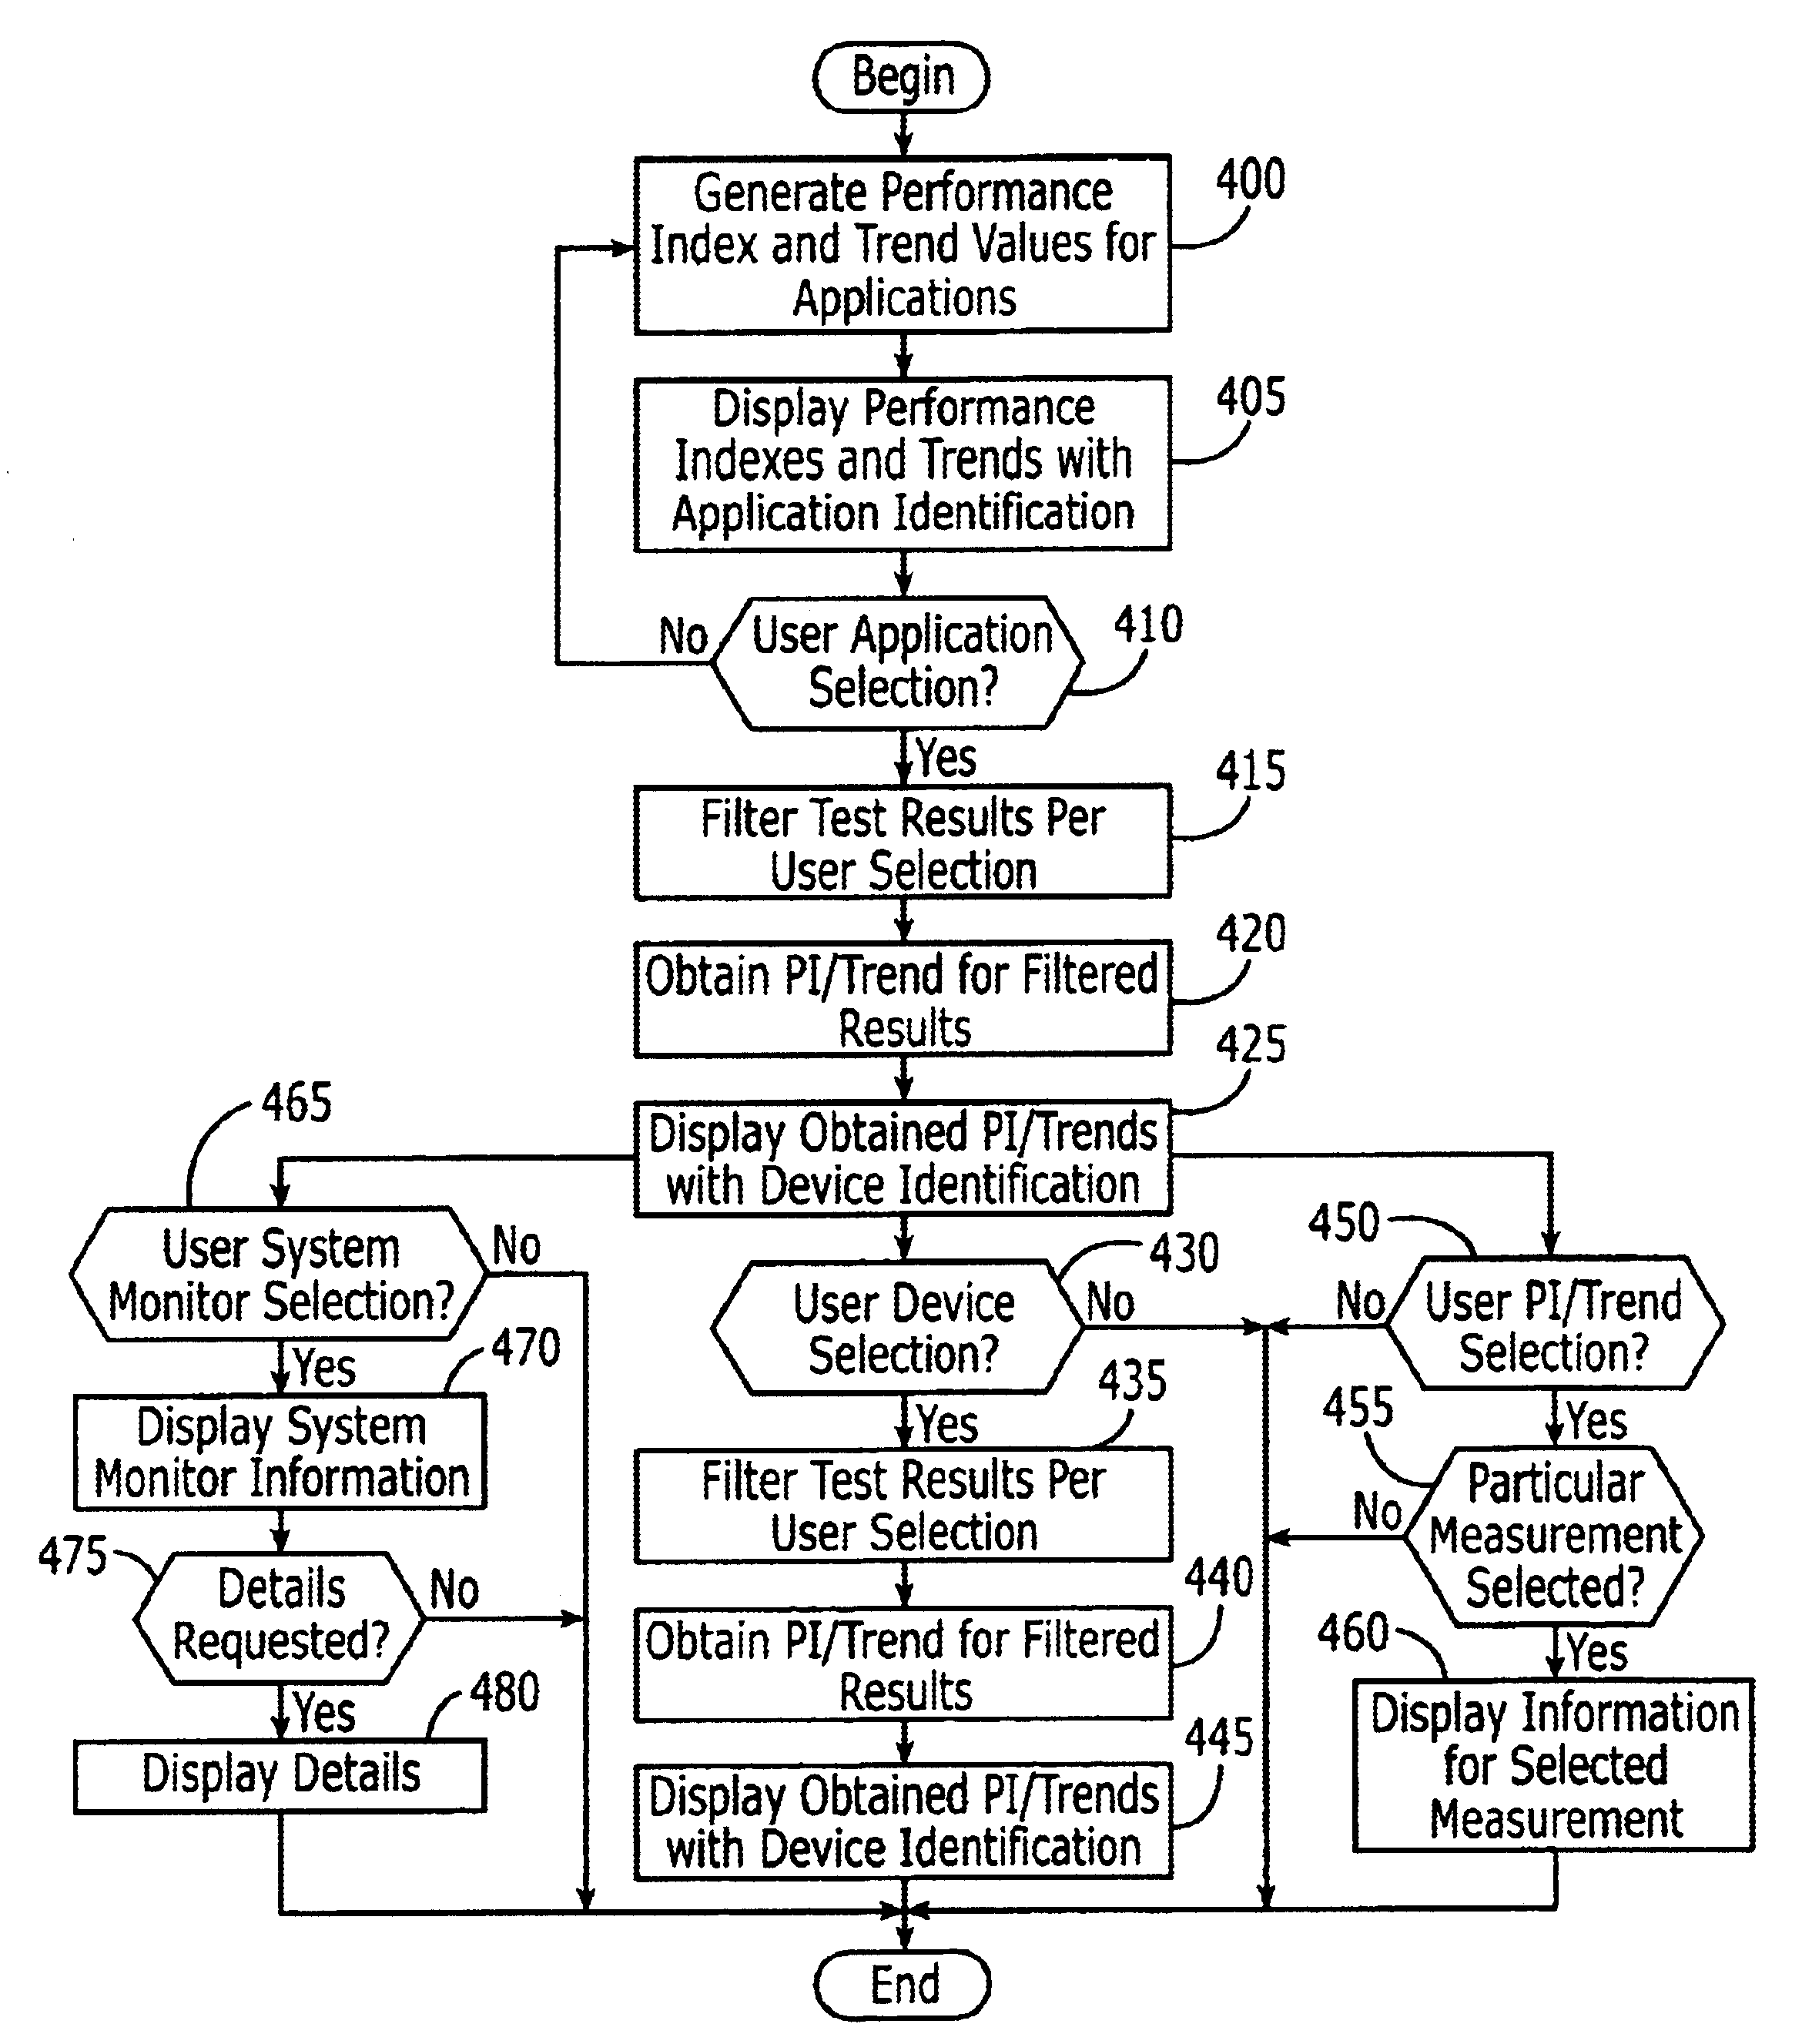
[0009]The present invention provides dynamic filtering tools for network performance test results which may apply network troubleshooting expertise and knowledge of network topology to select and display test results in a manner which may facilitate analysis of those results by IT staffs. In a further aspect of the present invention, a severity index is provided which may be generated based on exception events from a plurality of network performance measurements, for example, response time and throughput, which measurements are generated from test results obtained from agents located on various devices on a computer network. The test results may be obtained from either passive application monitor agents or active network test agents. In another aspect of the present invention, the exception events may be detected based on automatically generated threshold criteria which may be provided with user selectable sensitivity and may be based on a specified percentage criteria relative to baseline performance results. In a further aspect of the present invention, the test results may be stored using data buckets with the number of data buckets and / or the range of each of the data buckets being selected to provide a desired overall range and granularity for each of the plurality of network performance measurement types. The range (width) of some of the data buckets may be narrower than others to provide greater resolution in a region of interest, such as the region associated with detection of the exception events.

Problems solved by technology

In this demanding environment, frequent network expansion and day-to-day fire fighting often leave little time for IT managers to manage network performance proactively.
Their measurements are generally neither consistent nor repeatable, as a user's interaction with a given application varies over time.
Moreover, they are typically not suited to detecting system slowdowns or failures from the perspective of an end user.
However, as with the passive system monitors, these tools generally do not reflect network performance as experienced by a user.
Passive monitors are limited in that they are typically expensive to scale, only see traffic that is on the network at the time.
However, as these approaches are also typically directed to a particular application and require that the applications be installed and operating to generate network traffic, they generally only address simple web and database transactions.
As the range of information available to IT staffs from network performance tools increases, IT staffs face increasing challenges in attempting to analyze the large volumes of resulting data to identify and respond to problems promptly.
The increasing complexity of networks and the variety of applications and users utilizing those networks in a client-server environment makes the challenge even greater for IT staffs.
These problems are further exacerbated as networks are typically not static as new hardware and software application programs may be periodically added thereby changing the traffic characteristics on the network and the end user's experience of network performance.
However, this approach still requires assessment by a user of a number of different performance measurements, each of which may have a variable impact as perceived by different users executing applications on the network being monitored.
In addition, complex networks typically include a large number of client and server devices at dispersed geographic locations.
Accordingly, it may still be problematic for an IT staff to isolate the cause for a performance problem even after it is detected.

Method used


Image

  • Methods, system and computer program products for dynamic filtering of network performance test results
  • Methods, system and computer program products for dynamic filtering of network performance test results
  • Methods, system and computer program products for dynamic filtering of network performance test results

Examples


Embodiment Construction

[0031]The present invention will now be described more fully hereinafter with reference to the accompanying drawings, in which preferred embodiments of the invention are shown. This invention may, however, be embodied in many different forms and should not be construed as limited to the embodiments set forth herein; rather, these embodiments are provided so that this disclosure will be thorough and complete, and will fully convey the scope of the invention to those skilled in the art. Like numbers refer to like elements throughout. As used herein, the terms “coupled” and “connected” are intended to include both directly coupled / connected and indirectly coupled / connected.

[0032]As will be appreciated by one of skill in the art, the present invention may be embodied as methods, data processing systems (apparatus) and / or computer program products. Accordingly, the present invention may take the form of an entirely hardware embodiment, an entirely software embodiment or an embodiment com...


PUM


Abstract

Dynamic filtering methods, systems and computer program products are provided for network performance test results which may apply network troubleshooting expertise and knowledge of network topology to select and display test results in a manner which may facilitate analysis of those results by IT staffs. In a further aspect of the present invention, a severity index is provided which may be generated based on exception events from a plurality of network performance measurements, for example, response time, throughput and availability, which measurements are generated from test results obtained from agents located on various devices on a computer network. The test results may be obtained from either passive application monitor agents or active network test agents. In another aspect of the present invention, the exception events may be detected based on automatically generated threshold criteria which may be provided user selectable sensitivity and may be based on a specified percentage criteria relative to baseline performance results. In a further aspect of the present invention, the test results may be stored using data buckets with the number of data buckets and / or the range of each of the data buckets being selected to provide a desired overall range and granularity for each of the plurality of network performance measurement types. The range (width) of some of the data buckets may be narrower than others to provide greater resolution in a region of interest.

Description

FIELD OF THE INVENTION[0001]The present invention, generally, relates to data analysis, and, more particularly, to systems, methods and computer program products for analysis of data related to network communications.BACKGROUND OF THE INVENTION[0002]Companies are often dependent on mission-critical network applications to stay productive and competitive. To achieve this, information technology (IT) organizations preferably provide reliable application performance on a 24-hour, 7-day-a-week basis. In this demanding environment, frequent network expansion and day-to-day fire fighting often leave little time for IT managers to manage network performance proactively. Accordingly, IT managers typically rely on some form of system management and / or network management tools to help automate performance management tasks to increase the efficiency of the IT staffs. Even with these tools, IT staffs are typically required to commit resources to integrating and customizing the tools to work in ...

Claims


Application Information

Patent Timeline
Patent Type & Authority Patents(United States)
IPC IPC(8): G06F15/16G06F15/173H04L12/24H04L12/26
CPCH04L43/0817H04L43/0852H04L43/0888H04L12/2692H04L41/046H04L43/028H04L43/045H04L43/16H04L43/067
Inventor SCHWALLER, PETER JAMESBELLINGHAUSEN, JOAN MARIEBORGER, DANA SCOTTCHRISTENSEN, JOHN C.JOYCE, STEVEN THOMASLINGLE, ROGER ALLENQUAN, DAVID V. H.SOUTHARD, SCOTT ALAN
Owner NETIQ
Learn More