Electromagnetic flow meter

a flow meter and electromagnet technology, applied in the direction of mechanical measurement arrangements, mechanical roughness/irregularity measurements, instruments, etc., can solve the problems of introducing its own problems, affecting the ability to determine the flow in a static fashion, using such a frequency, etc., to enhance the prominence of turning points in the waveform, enhance accuracy, and diminish the effect of returns

Inactive Publication Date: 2005-11-08
ABB LTD
View PDF12 Cites 8 Cited by
  • Summary
  • Abstract
  • Description
  • Claims
  • Application Information

AI Technical Summary

Benefits of technology

[0012]Preferably the meter is excited with a composite excitation waveform obtained by combining at least two frequency components; in this way the composite waveform can easily be selected to contain frequency components which excite desired properties, for example a relatively high and relatively low frequency. The composite waveform will preferably not be completely sinusoidal. The composite waveform preferably is substantially devoid of sharp turning points (these are associated with numerous high frequencies which may behave unpredictably). The composite waveform is preferably digitally synthesised. The frequency components are preferably combined at pre-determined, preferably similar, for example within a range of minimum to maximum of 1 to 5 or less, preferably 1 to 3 or less, amplitudes. The amplitudes (and phases) may be chosen to enhance the prominence of turning points in the waveform.
[0022]A measure of a linear trend may be determined. Additionally or alternatively a measure of an exponential trend (e.g. a decaying exponential) may be determined. Advantageously an exponential or linear trend may be approximated by a polynomial. In a preferred arrangement a low order polynomial trend, preferably second or third order, is fitted to the data—this can effectively remove linear or exponential trends without interfering substantially with fitting of the data. The sampled output data may be fitted with reference data comprising an expected signal multiplied by an unknown factor and a trend of unknown gradient (or polynomial coefficients) to determine values for the factor and for the gradient (or polynomial) which gives the best fit according to a predetermined fitting method, preferably a least squares fitting method. Using higher order polynomials to model trends trends leads to diminishing returns. Preferably a measure of flow is determined from the value of the factor. Preferably a measure of confidence or accuracy is determined from the gradient. The predetermined fitting method may comprise determining a sum of squares of differences between the reference data and sampled output data. The reference data may include a constant unknown offset. A value for the offset may be determined to improve the fit. However, advantageously, the offset value may be determined but the measure of accuracy or confidence is based primarily on the value of the gradient. Calibration parameters for the meter may be stored, the method further comprising adjusting at least one calibration parameter for the meter based on a plurality of measurements of trend or accuracy or confidence.

Problems solved by technology

This inhibits the ability to determine the flow in a static fashion.
The energy can be spread across a wide frequency range but most applications have significant low frequency noise and this is often more problematic due to the nature of the signal processing.
However, using such a frequency would introduce its own problems.
Most notably, the magnetic circuit of the flow meter is less stable at the higher frequencies.
One factor that contributes to this is that the losses in the magnetic circuit, which become more significant at higher frequencies, are quite temperature dependent.
Thus, for a given excitation, the field strength generated may vary unpredictably.
A search coil can be used to measure the actual field generated but this adds significant cost and manufacturing difficulties.
The ‘roll off’ of the sensor head at these higher frequencies leads to an uncertainty in the sensitivity of the sensor and to variations in the phase between the field (and hence the electrode signal) and the drive current.
To summarise the problems a lower drive frequency can give much better sensor stability but measurements are more easily corrupted by the bias drift and the effect of inclusions in the fluid.
A further important problem is that a low excitation frequency limits the rate at which new measurements can be updated—it gives a low flow measurement bandwidth.
A higher frequency assists in distinguishing wanted signals from unwanted and also allows a more acceptable higher flow measurement bandwidth but the sensor characteristics will not be so precisely defined and are less stable.
A drawback is that measurement rate is still limited by the lowest frequency, as explained in more detail below.

Method used


Image

  • Electromagnetic flow meter
  • Electromagnetic flow meter
  • Electromagnetic flow meter

Examples


Embodiment Construction

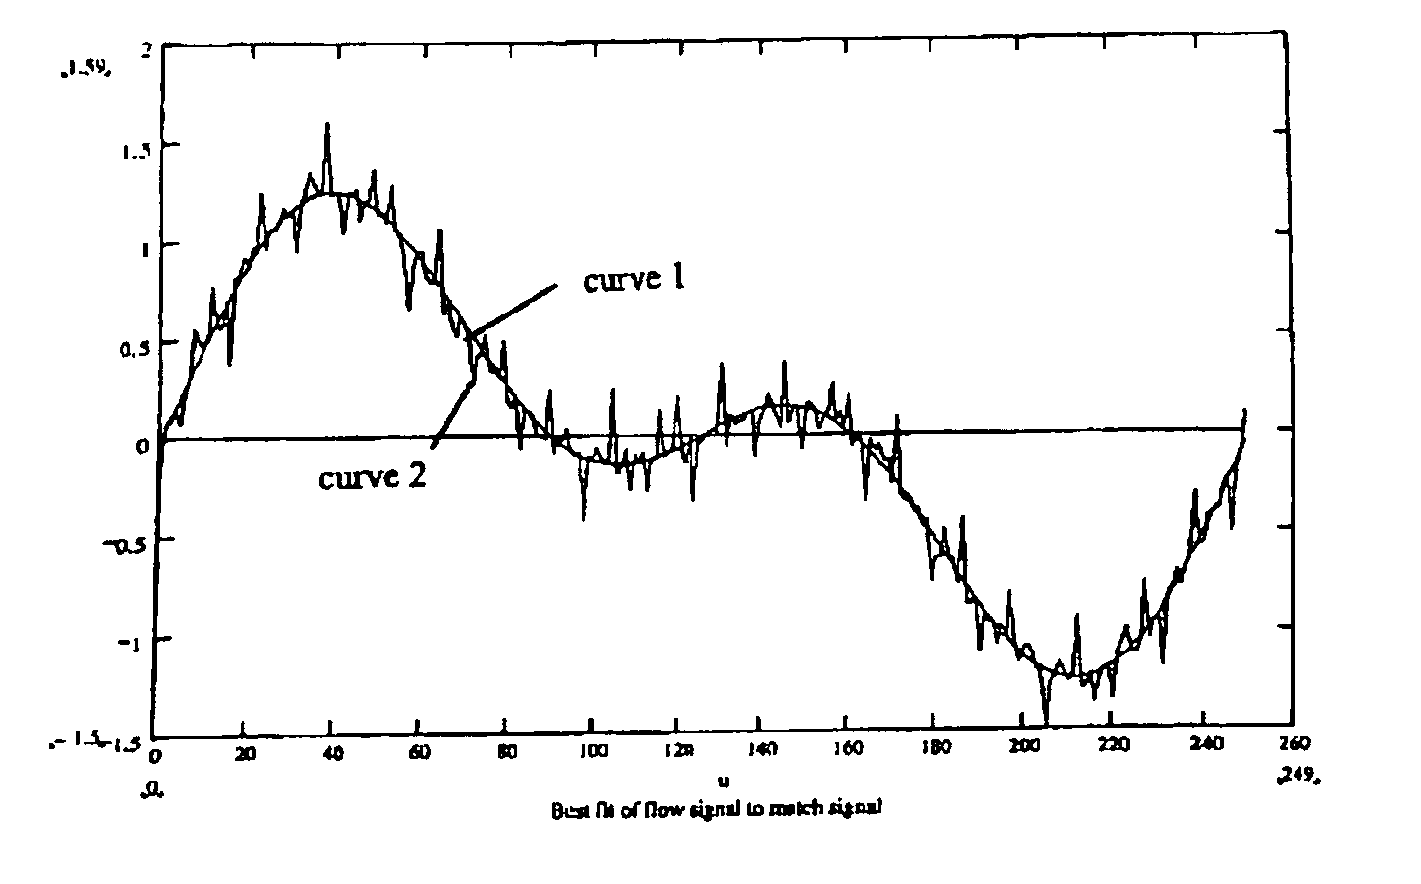
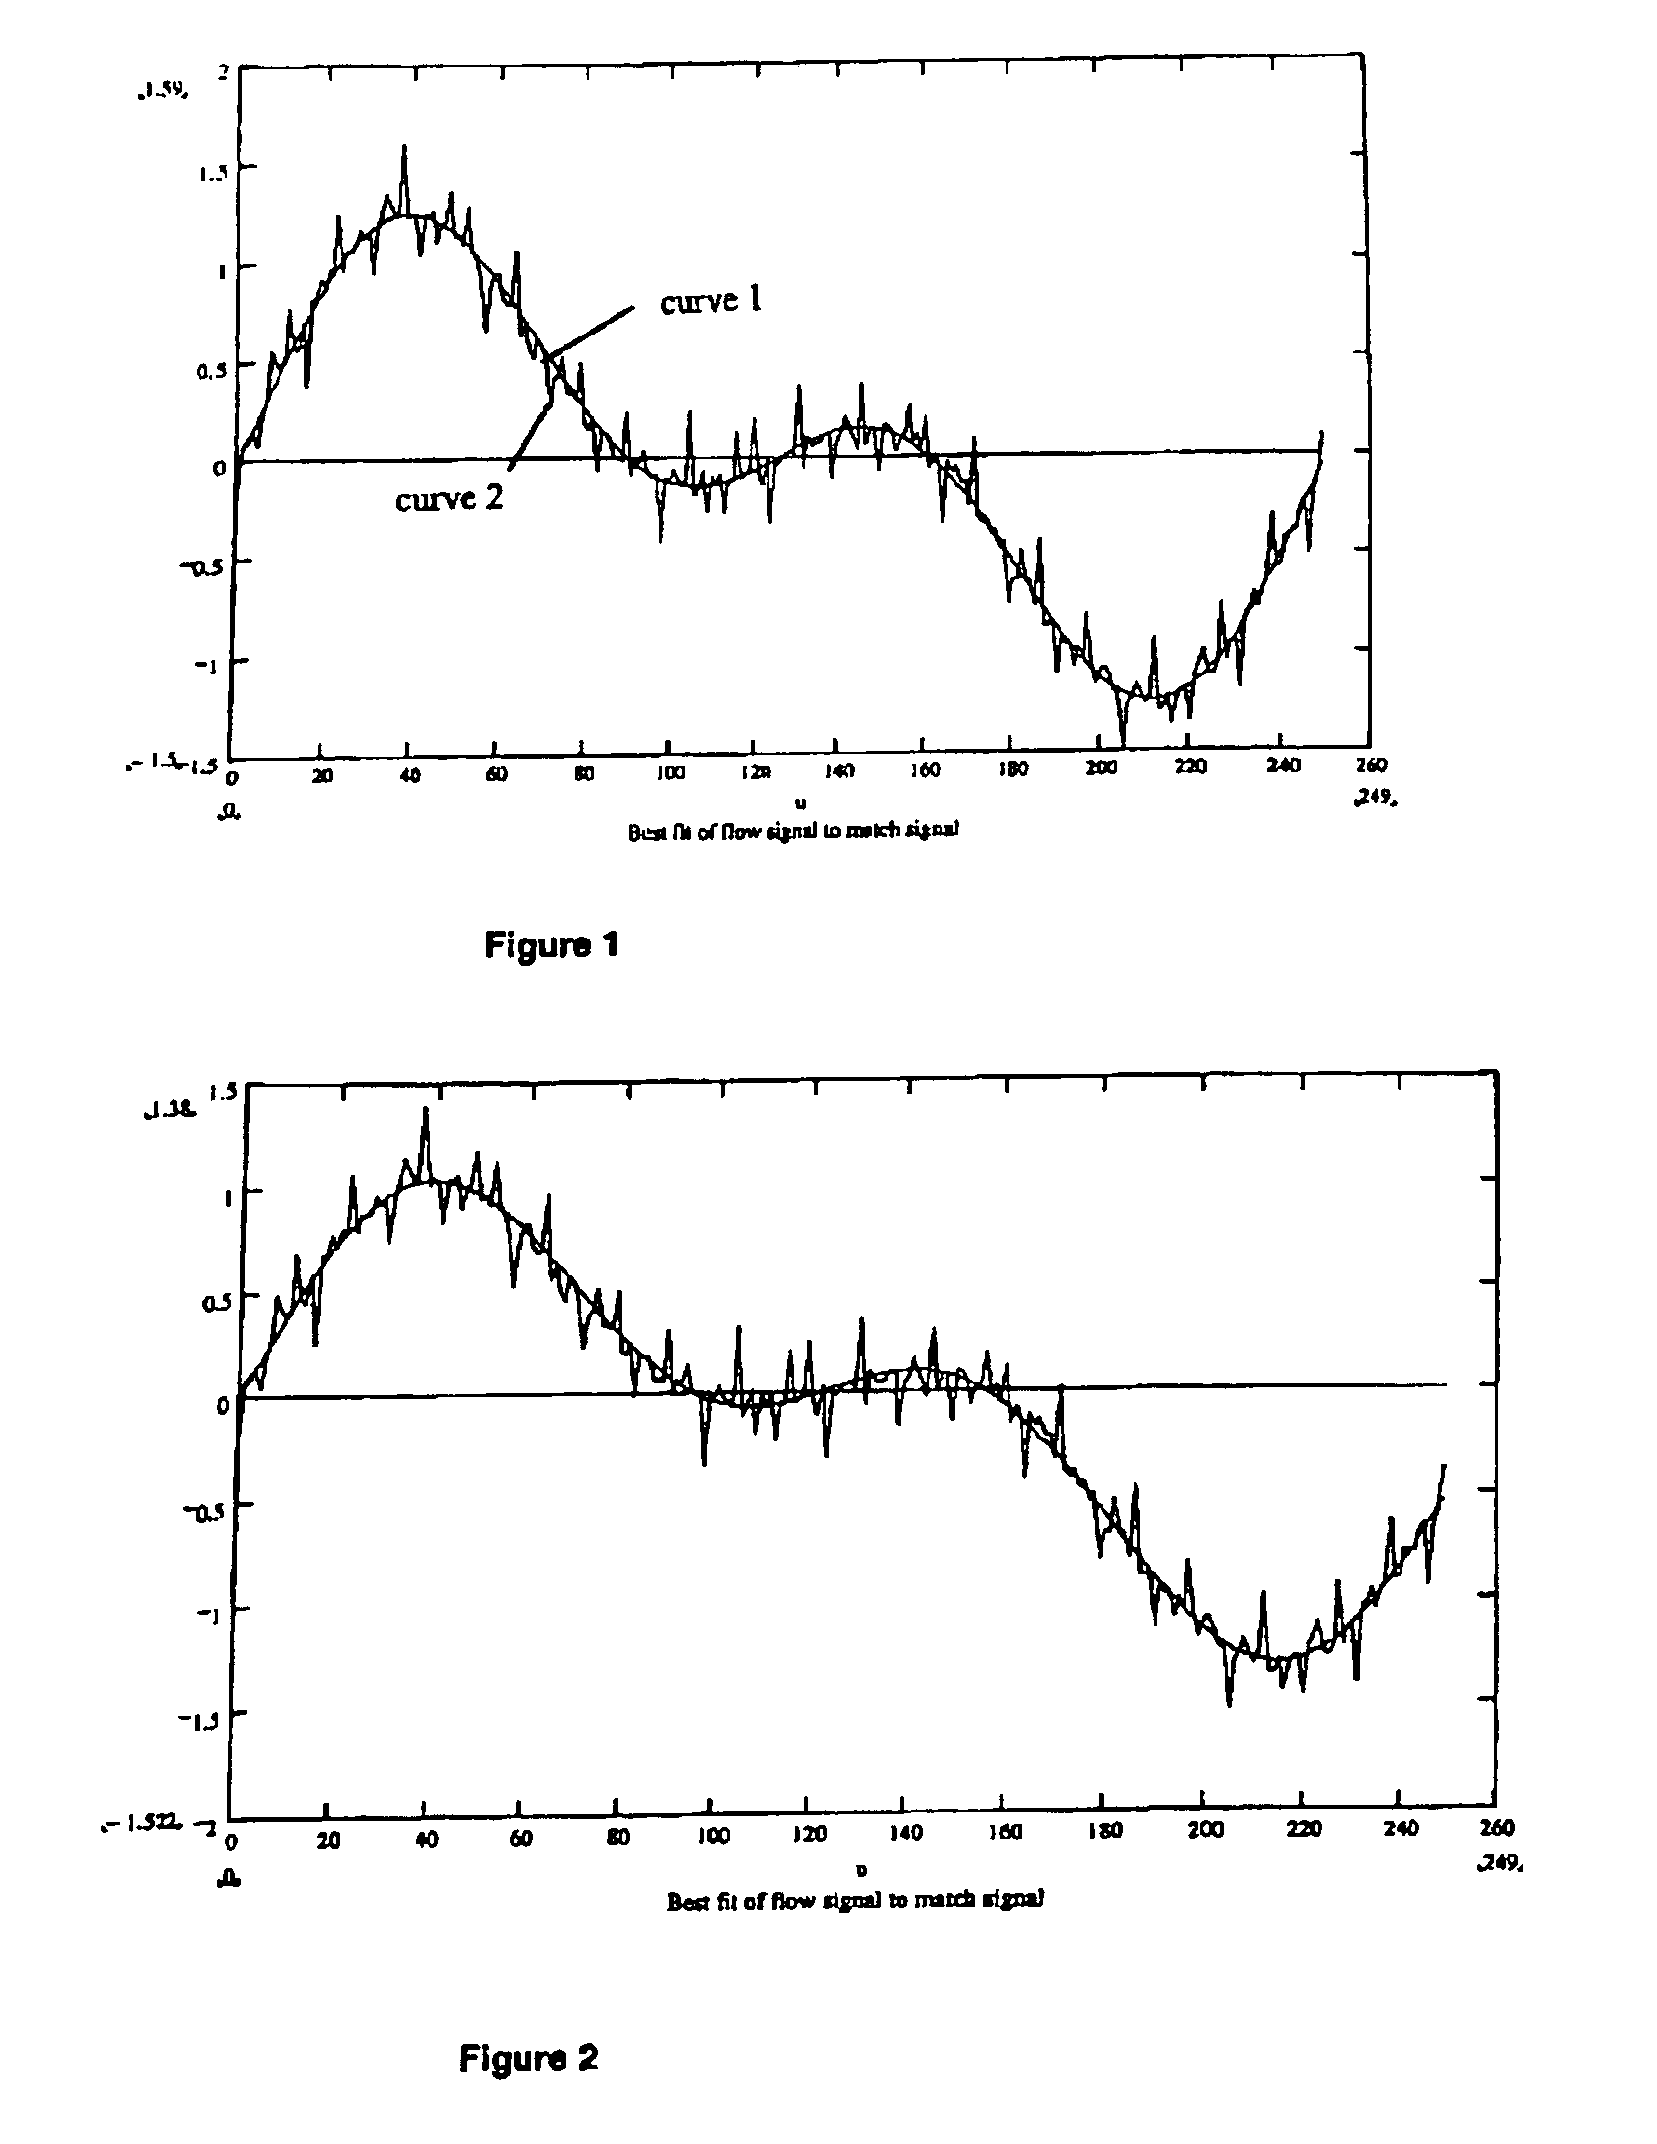
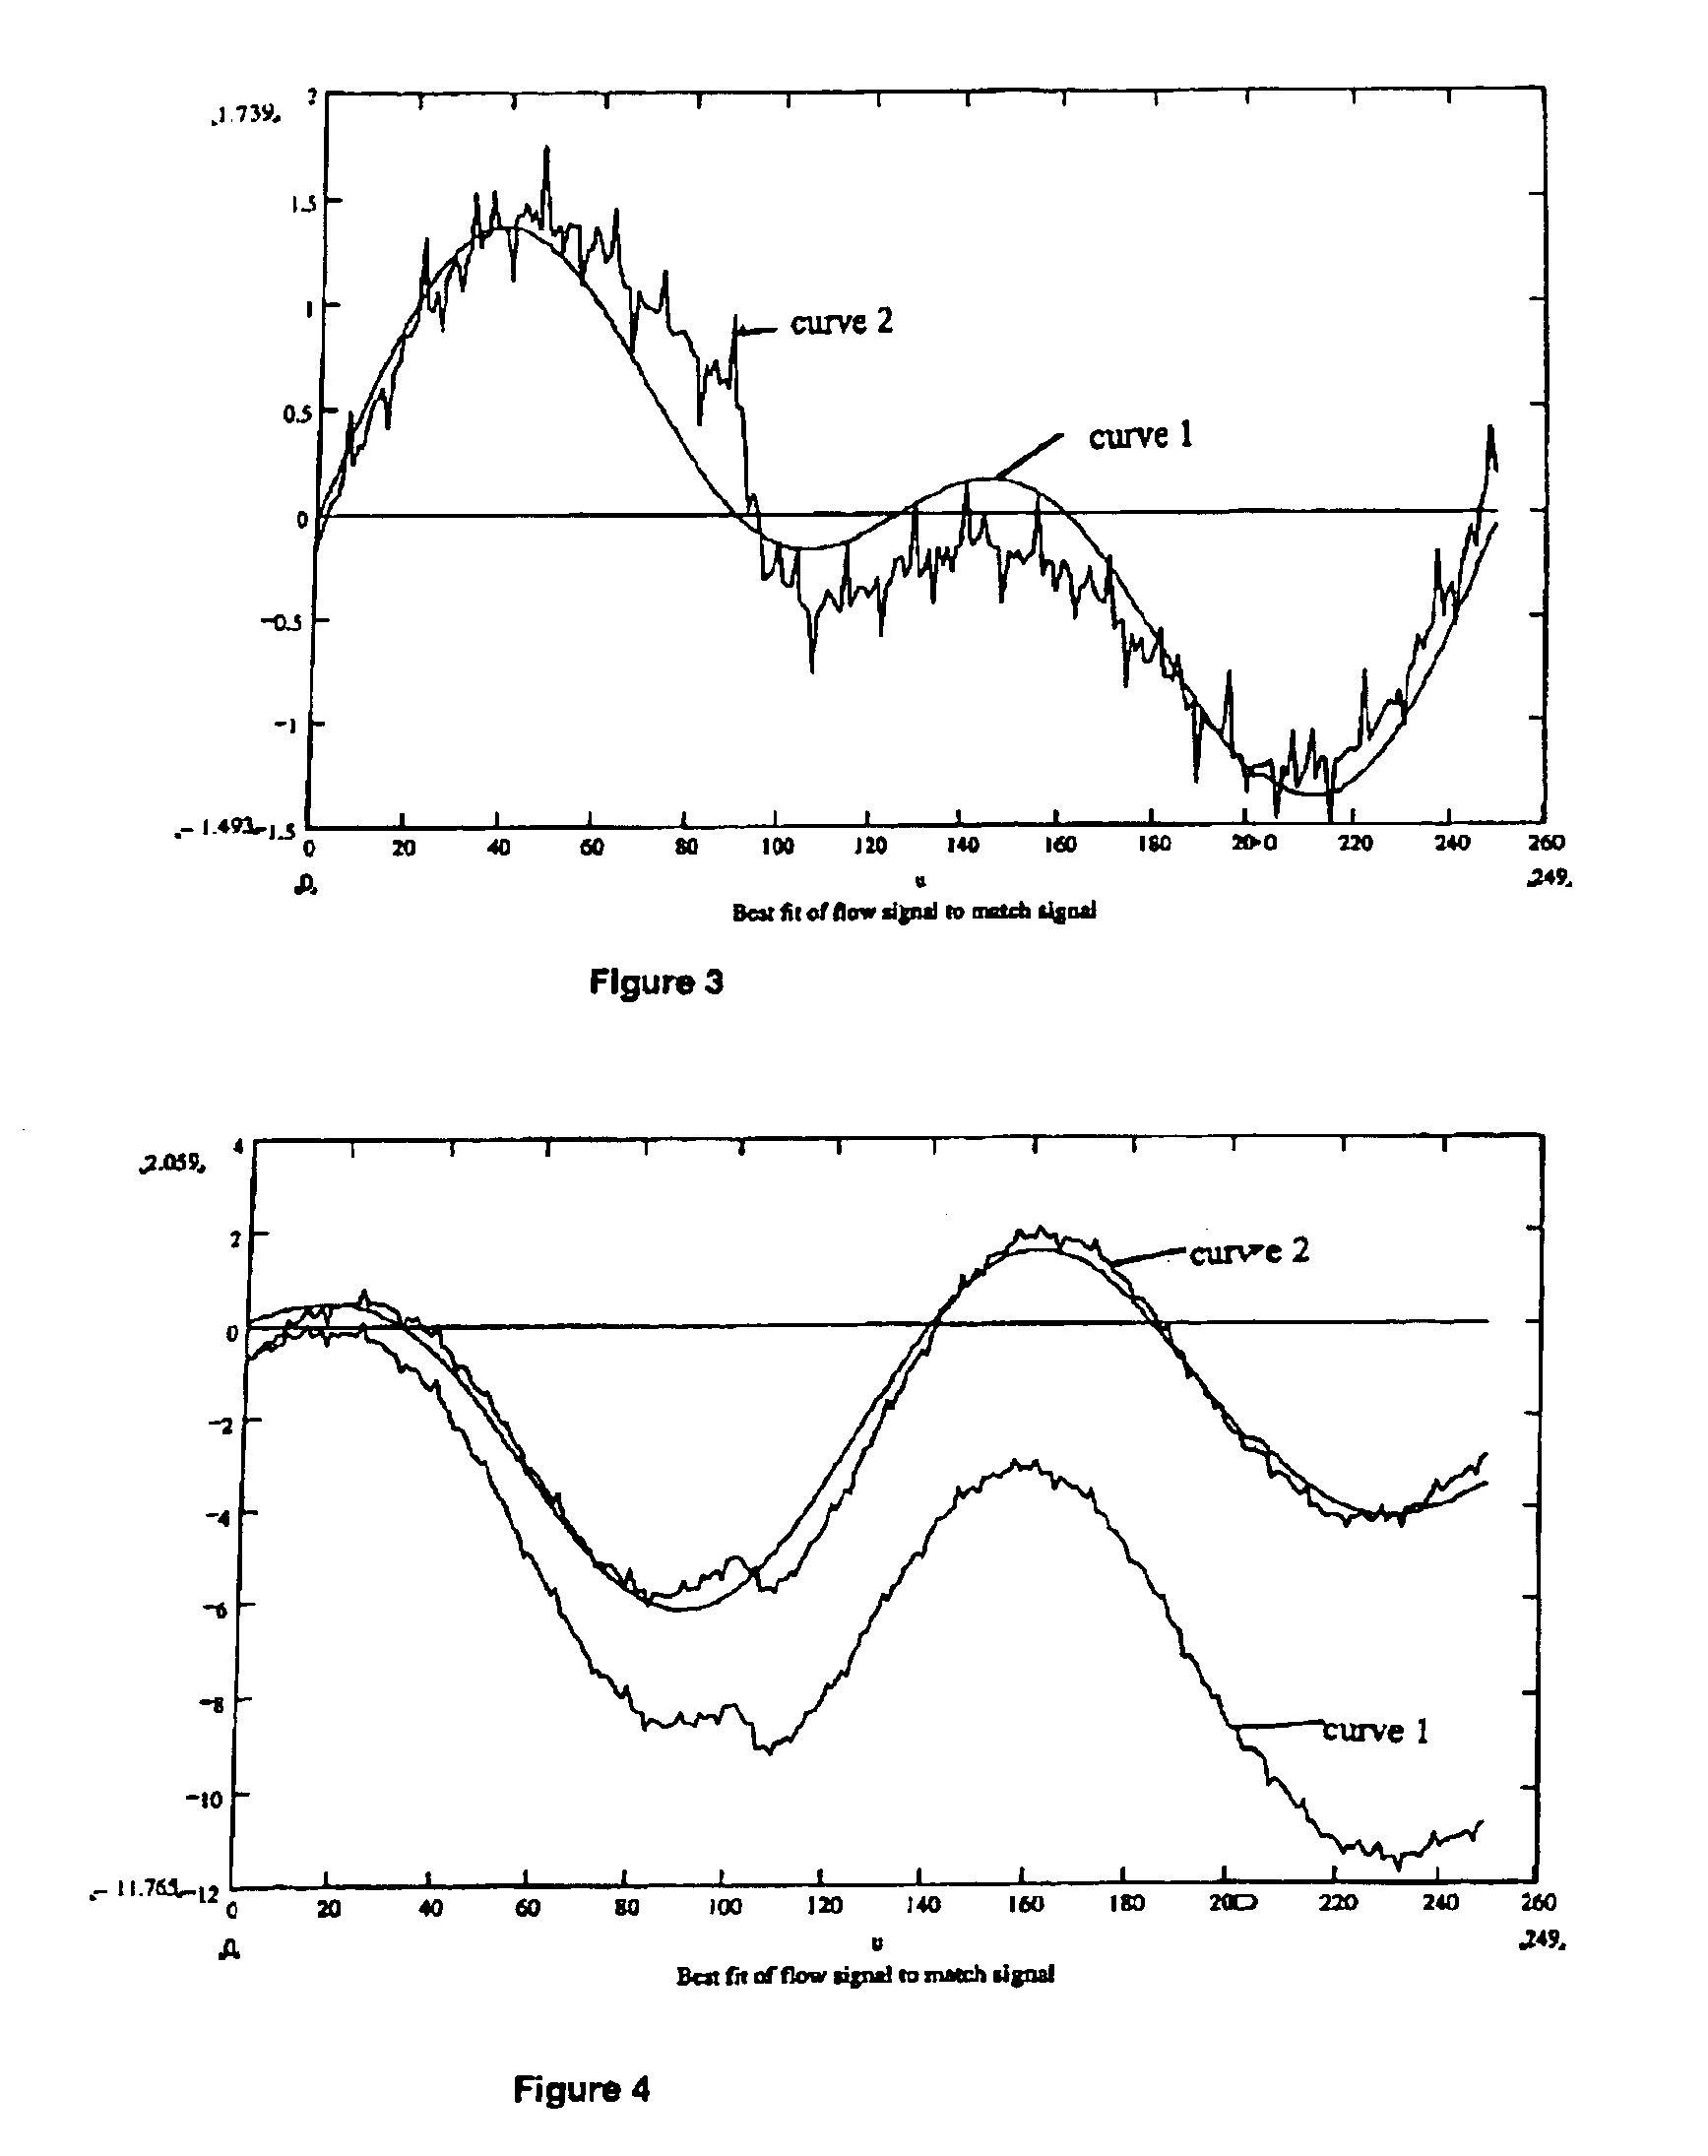
[0010]According to a first aspect the invention provides a method of obtaining a measure of flow from an electromagnetic flow meter comprising applying a composite excitation waveform comprising a plurality of frequency components; receiving an output from the meter; and correlating sampled output data from the meter with a composite correlation waveform based on the composite excitation waveform to derive a measure of flow.

[0011]In this method, by taking the novel step of correlating with a composite waveform, rather than the conventional method of correlating each frequency component with a sine wave, a number of advantages can be obtained. Although the composite waveform will effectively contain multiple frequency components, it has been found that it is not necessary to process each component separately and thus measurement rate is not limited by the lowest frequency component. Furthermore, additional information is obtained from the combination of the components (the shape of t...


PUM


Abstract

There is described herein a method of obtaining a measure of flow from an electromagnetic flow meter having at least one field generating coil and potential sensing electrodes. A composite excitation waveform is applied to the field-generating coil. The composite excitation waveform comprises at least two frequency components and a plurality of frequency components are simultaneously present for at least a portion of the waveform. The potential sensed by the potential sensing electrodes is sampled to produce a sampled output and the sampled output is correlated with a composite waveform based on the composite excitation waveform. The result of the correlating is used to derive a measure of flow.

Description

CROSS-REFERENCE TO RELATED APPLICATION[0001]This application is related to U.S. patent application Ser. No.10 / 817,327, filed on the same day as the present application, having the same inventor as the present application, and entitled “ELECTROMAGNETIC FLOW METER”. The disclosure of the above-described filed application is hereby incorporated by reference.BACKGROUND OF THE INVENTION[0002]The present invention relates to electromagnetic flow meters. However, aspects of signal processing techniques disclosed herein may be more broadly applied. The operating principles of Electromagnetic Flow Meters are well known, discussed for example in GB-A-2,380,798.[0003]Where the sensing electrodes are in contact with the fluid, due to electrochemical or other effects, a DC potential is usually present across the electrodes even when there is no coil excitation, i.e. no field. That component of the signal is independent of the flow. This inhibits the ability to determine the flow in a static fash...

Claims


Application Information

Patent Timeline
Patent Type & Authority Patents(United States)
IPC IPC(8): G01F1/56G01F1/60
CPCG01F1/60
Inventor WRAY, TROY
Owner ABB LTD
Why Eureka
Try Eureka