Apparatus and method for displaying subsurface anomalies and surface features

a technology of surface anomalies and anomalies, applied in the field of systems for assembling and displaying a 3dimensional graphical representation of a building construction project, can solve the problems of long term monitoring, large quantity of data produced by long term monitoring, and installation of expensive monitoring tools, so as to eliminate statistical outliers, improve resistivity data, and easy to identify voids

Inactive Publication Date: 2006-02-21
BRYANT CONSULTANTS
View PDF18 Cites 71 Cited by
  • Summary
  • Abstract
  • Description
  • Claims
  • Application Information

AI Technical Summary

Benefits of technology

[0010]In the first embodiment, raw resistivity data is obtained by an AGI SuperSting Administrator. The AGI SuperSting administrator is a hardware and software system to collect resistivity data and is available from Advanced Geo sciences, Inc. located in Austin, Tex. WORDPAD software, which is commercially available from Microsoft Corp., located in Redman, Wash. is used to eliminate statistical outliers and to remove text and other extraneous information from the data produced by the AGI SuperSting Administrator. RES2DINV and RES3DINV programs, which are 2-D and 3-D forward modeling programs known in the art, accept data from WORDPAD and convert it into either a 2-D or 3-D graph of contoured surfaces; RES2DINV produces a 2-D graph, RES3DINV produces a 3-D graph. SURFER available from RockWare, Inc. of Golden, Colo., is used to perform certain statistical analysis on the data to create the enhanced resistivity data which is downloaded to the EVS program.

Problems solved by technology

To obtain the data, expensive monitoring tools must be installed and often involve long term monitoring.
The quantity of data produced by long term monitoring can quickly become overwhelming and threaten the success of the project.
The complexity of the data can delay or prevent early recognition of anomalies which can further threaten the project.
la. Prior art systems suffer from the limitation that they do not allow for evaluation of surface and subsurface site conditions and potential anomalies in an integrated 3-D model that can be viewed from varying angles in 2-D and 3-D perspecti
Currently there is not a method to combine above ground features with subsurface anomalies in order to evaluate a construction project or building site.

Method used


Image

  • Apparatus and method for displaying subsurface anomalies and surface features
  • Apparatus and method for displaying subsurface anomalies and surface features
  • Apparatus and method for displaying subsurface anomalies and surface features

Examples


Embodiment Construction

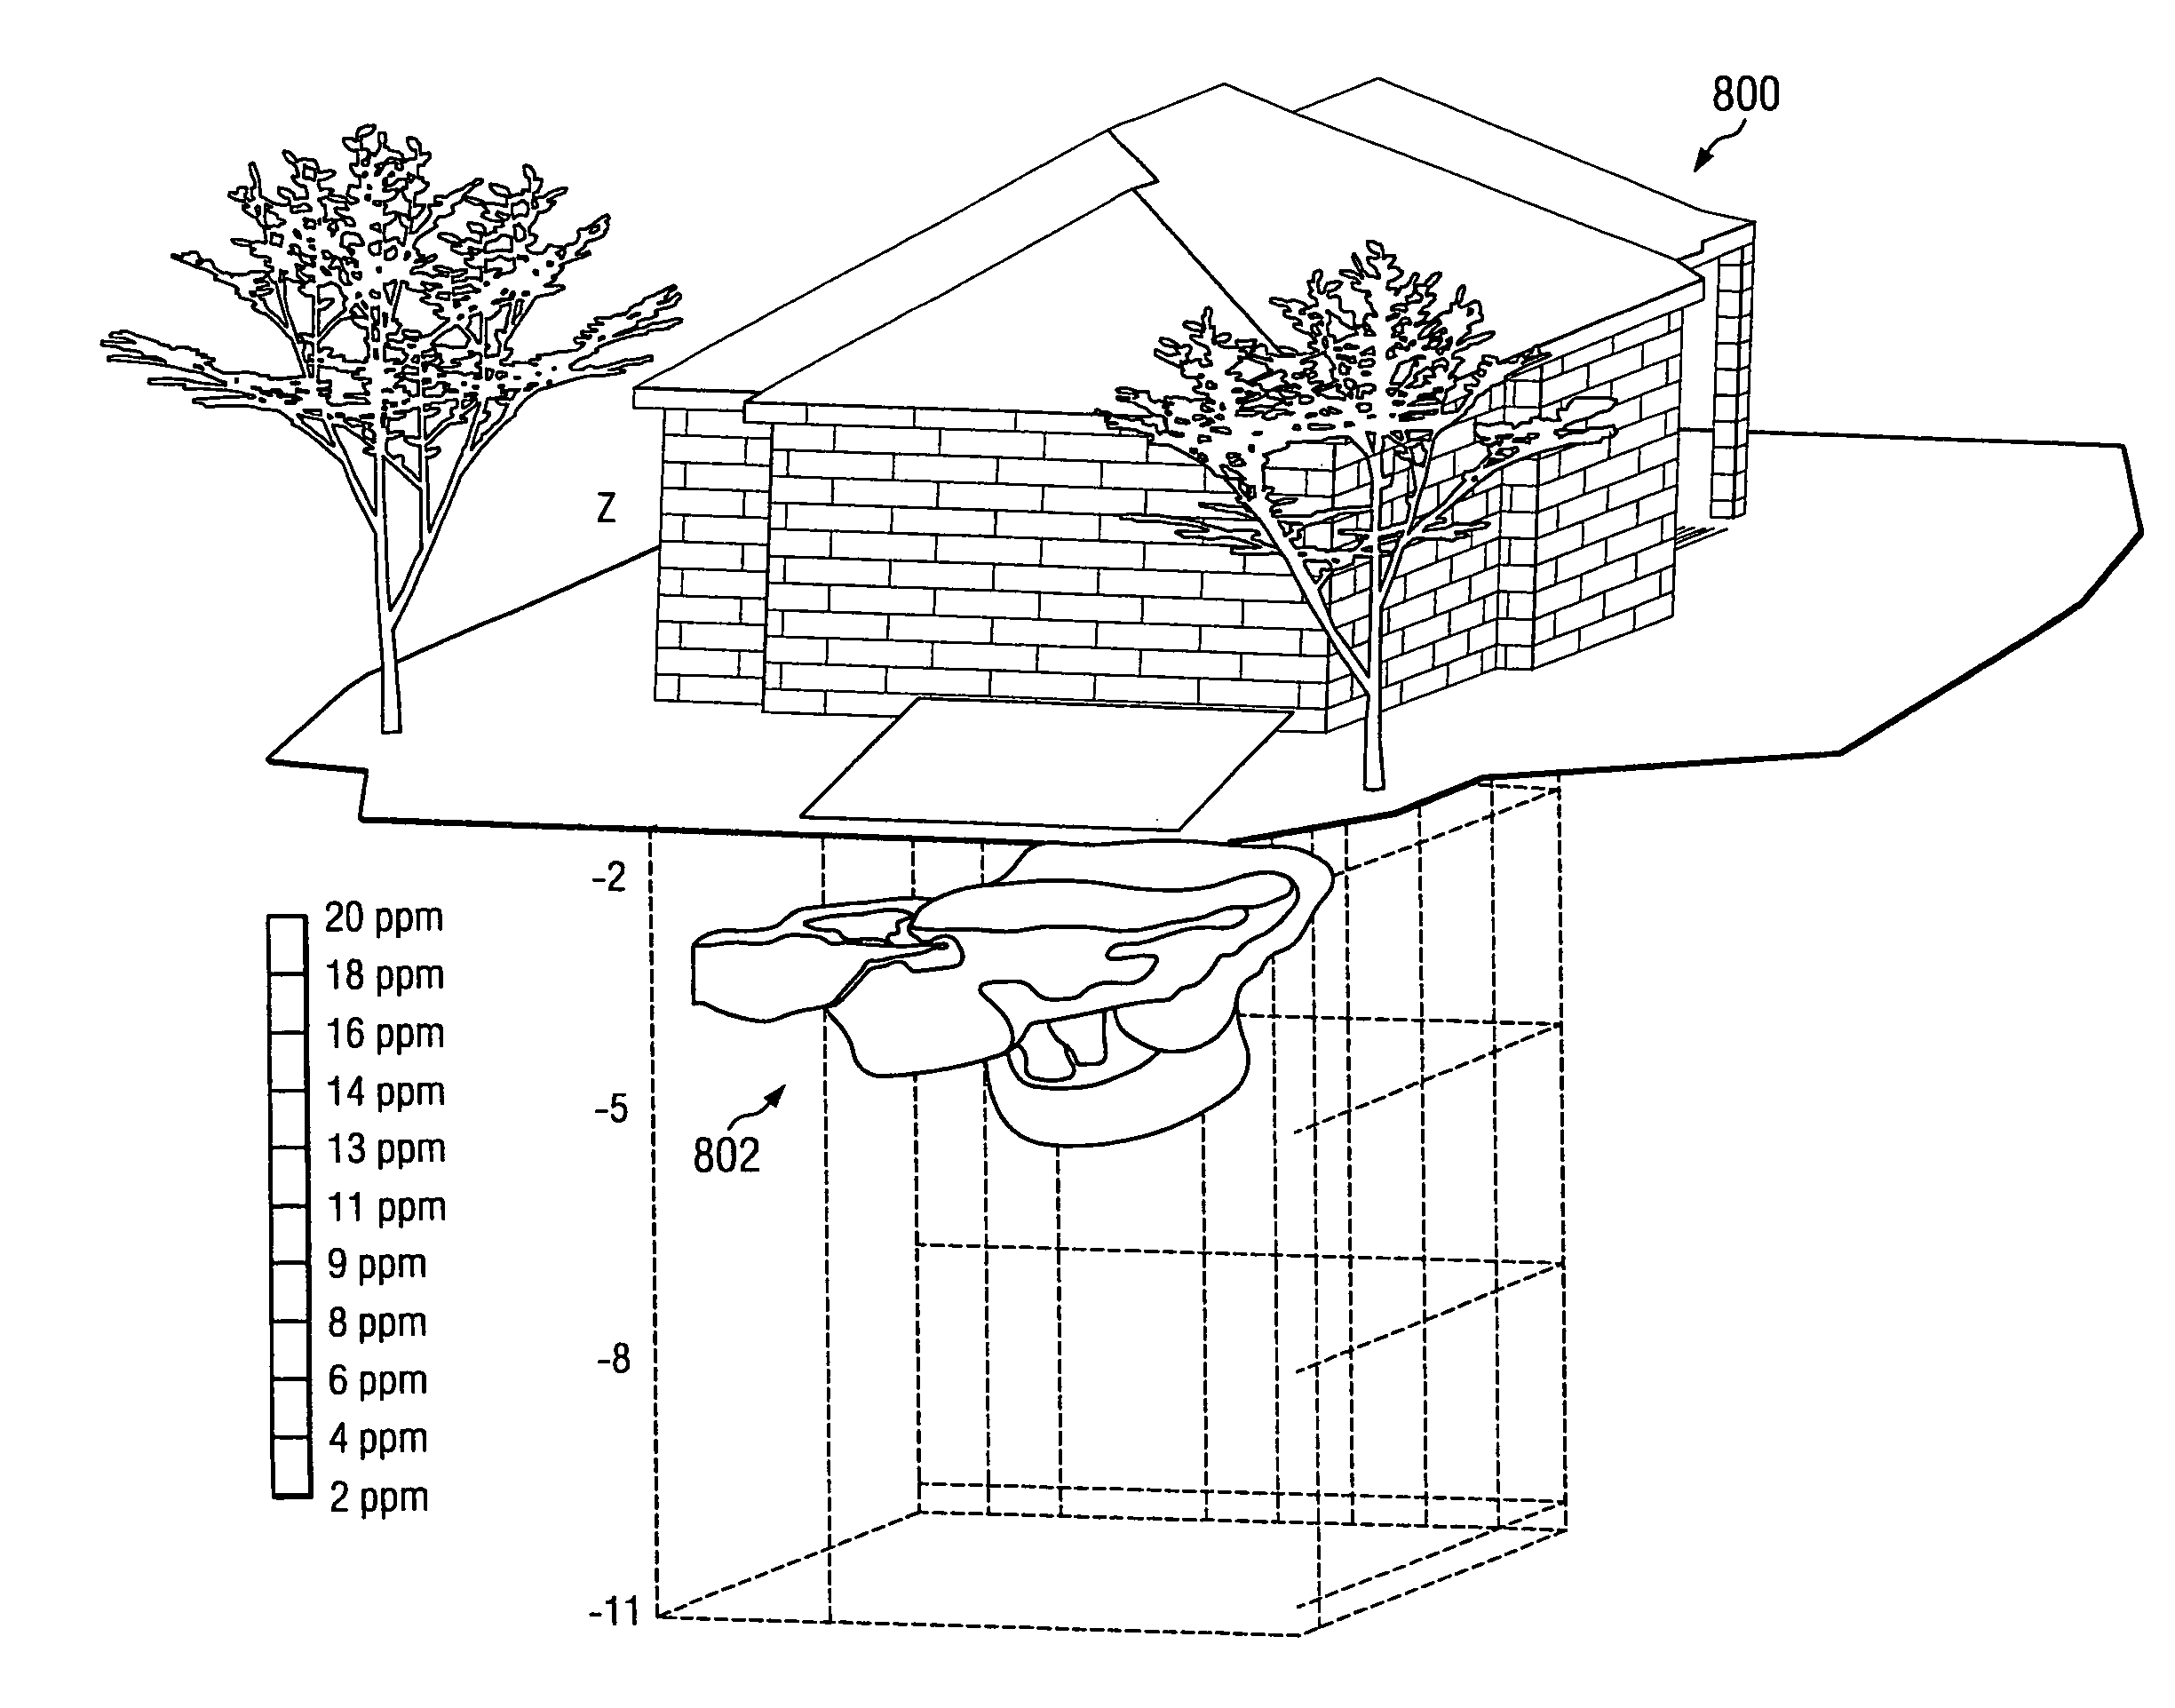
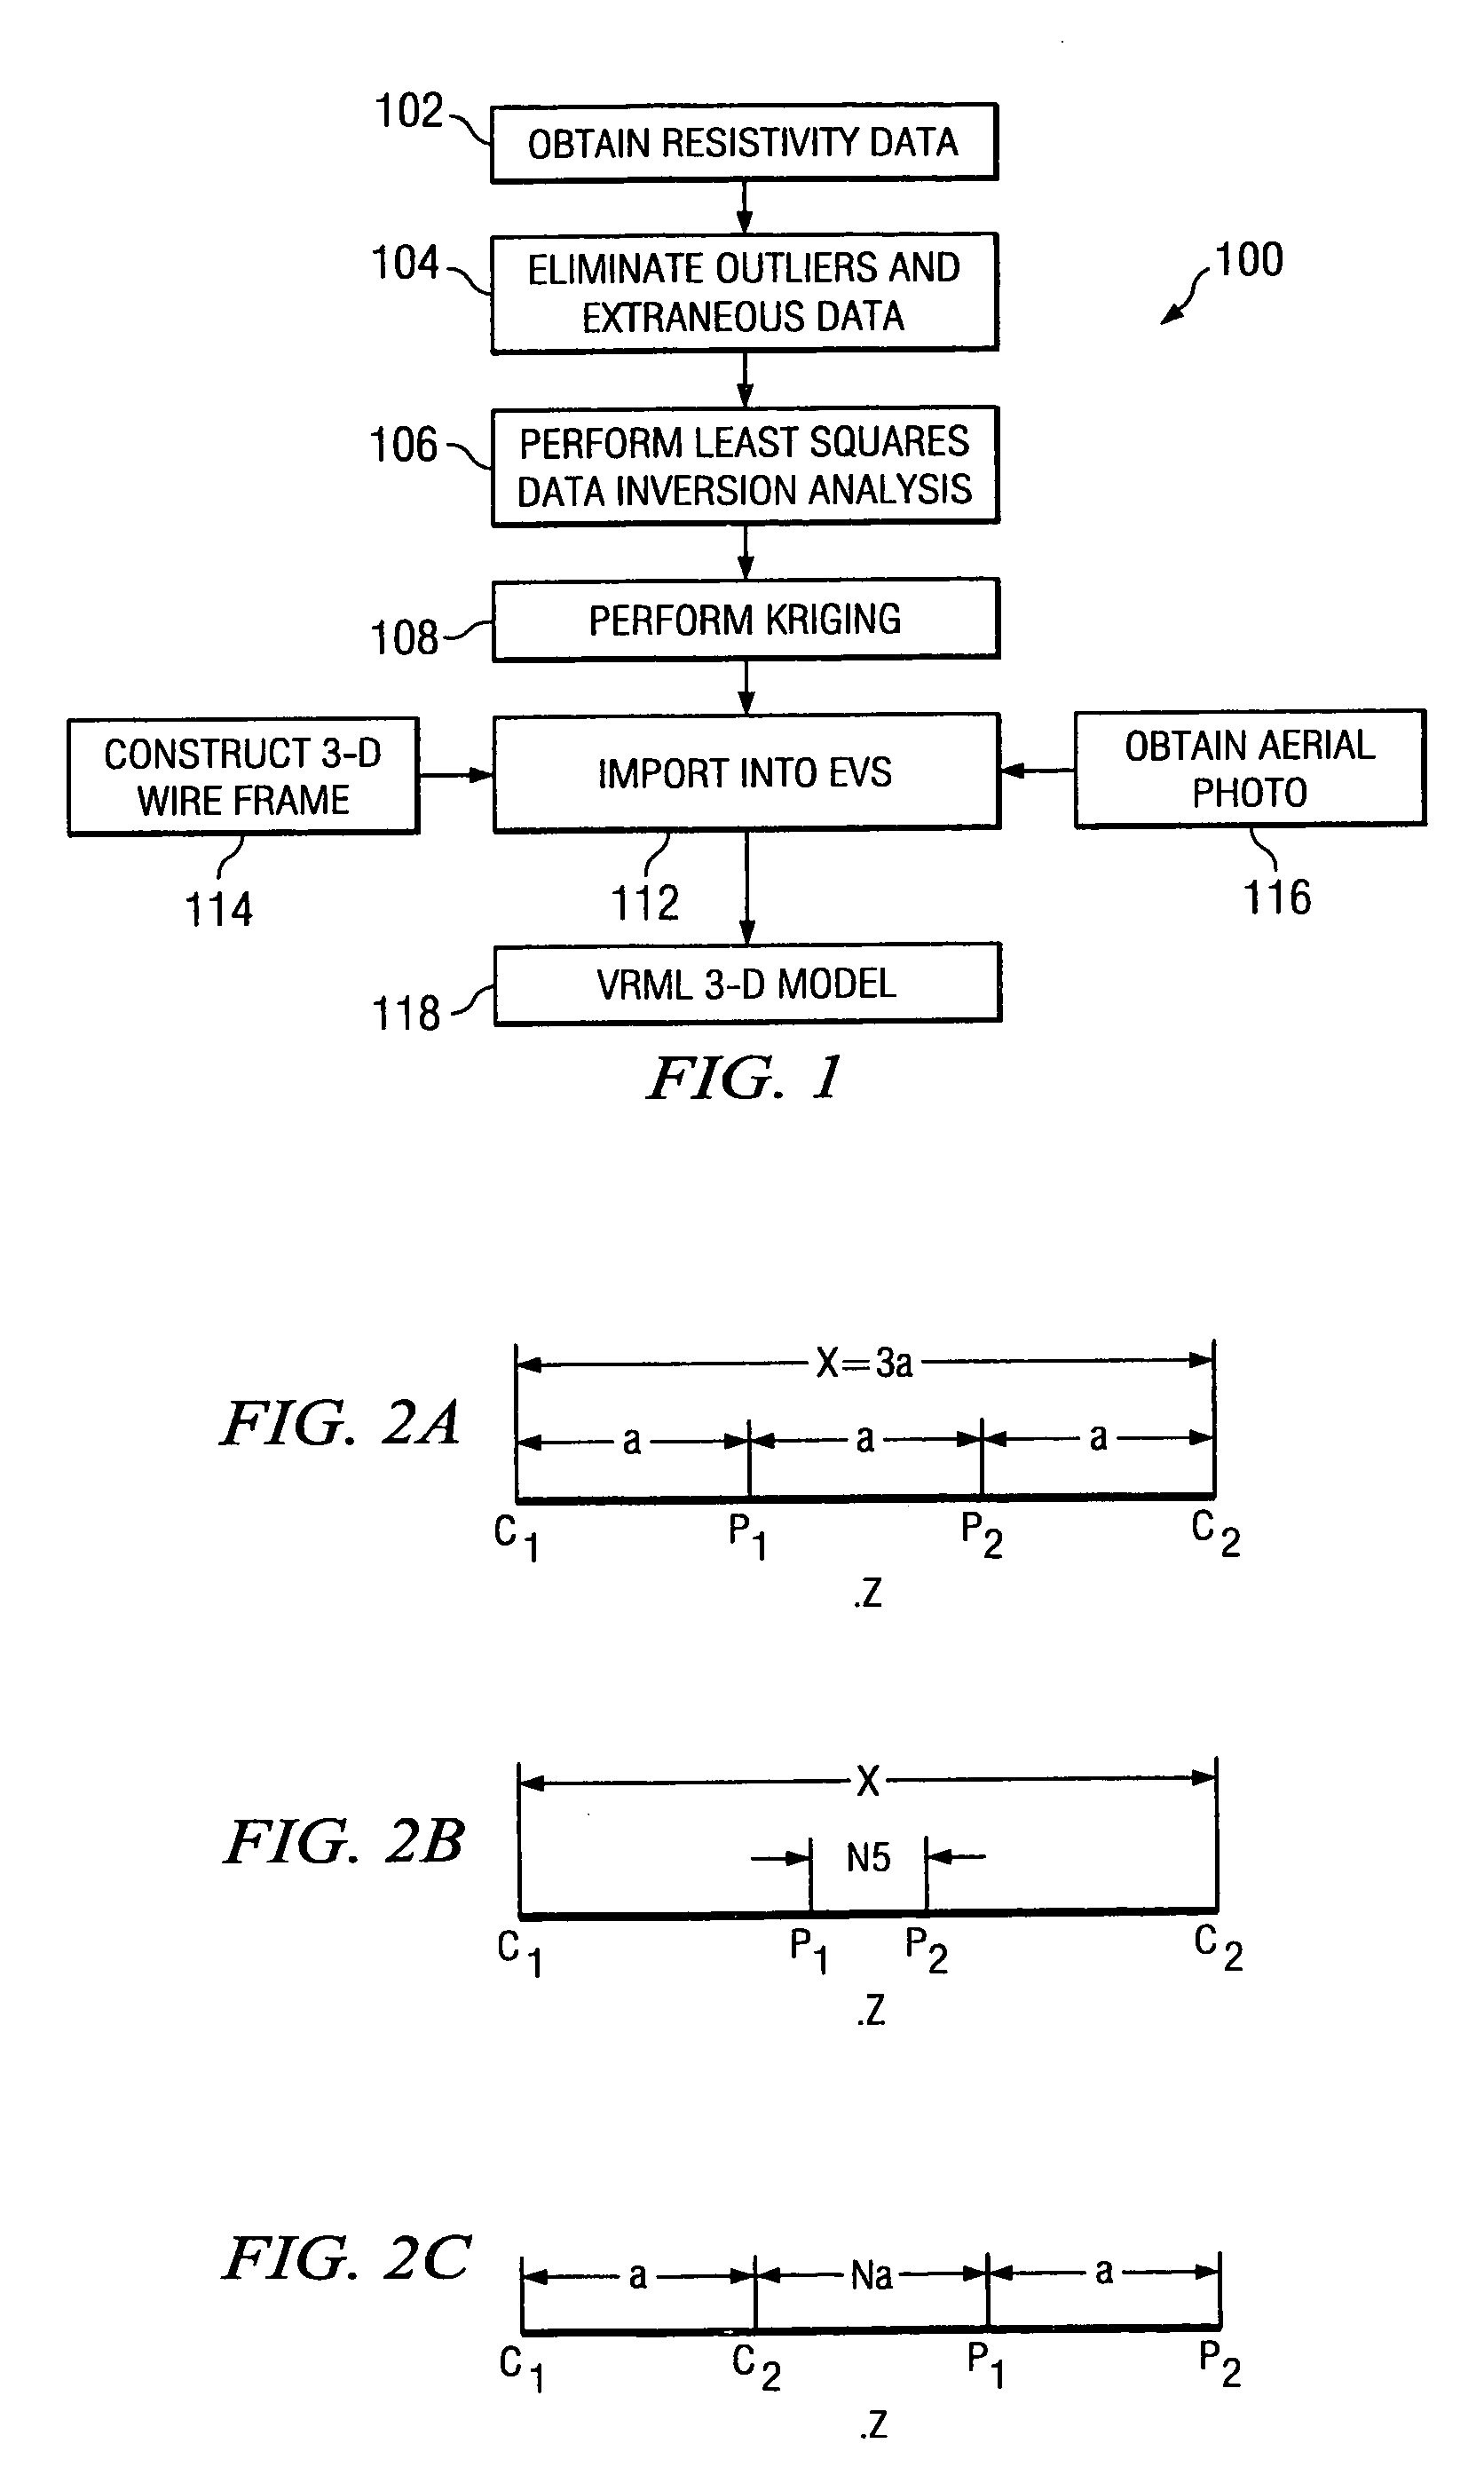
[0025]FIG. 1 shows a method for combining a model of above ground structures with a model of subsurface features. Method 100 begins by obtaining subsurface mapping data that is used to detect and locate subsurface features such as water, voids, saturated clays, sandbars, rocks, structures, and the like, step 102. In the preferred embodiment, the subsurface mapping data is resistivity data resistivity data is acquired by a machine known in the industry as an AGI SuperSting. Next, a processing program such as WORDPAD is used to eliminate statistical outliers and to remove text and other extraneous information from the resistivity data required from the AGI SuperSting output, step 104. Then, two-dimensional (2-D) and three-dimensional (3-D) forward modeling programs such as RES2DINV and RES3DINV import the data from WORDPAD and perform a least squares data inversion analysis to smooth out curves created from the imported data, step 106.

[0026]The geostatistical analysis program SURFER, ...


PUM


Abstract

The present invention provides a method of combining various types of data and software in order to arrive at a composite graphical representation of a construction site, including surface and subsurface features. A 2-D or 3-D graph of subsurface contoured surfaces is created. A 3-D wire-frame model of surface and subsurface features is created. Aerial photographs of the site can be incorporated and the aerial photographs contoured surfaces and wire-frame model are to produce a complete Visual Reduction Modeling Language (VRML) model of both surface and subsurface features. The VRML model allows the user to identify and visualize a relationship between sub-surface features and above ground features.

Description

FIELD OF THE INVENTION[0001]This invention relates to a system for assembling and displaying a 3-dimensional graphical representation of a building construction project. More particularly the invention relates to a system that combines a model of an above ground structure with a model of subsurface features to form a complete synchronized image. A display aids in visualization of the relationship between subsurface features such as water leakage, clay distribution, rocks or other subsurface features such as subsurface building and foundation elements in any combination and above ground features such as topography, fill and cut zones, and building features including slab-on-grade foundation elements and pier-and-beam foundation elements in any combination.BACKGROUND OF THE INVENTION[0002]In large construction projects, identification and location of subsurface anomalies are important to the success of the endeavor. Detecting subsurface anomalies currently involves analysis of geotech...

Claims


Application Information

Patent Timeline
Patent Type & Authority Patents(United States)
IPC IPC(8): G01V9/00G01V1/28G01V1/34
CPCG01V1/34
Inventor BRYANT, JOHN
Owner BRYANT CONSULTANTS
Why Eureka
Try Eureka