System and method for performing process visualization

a process visualization and process technology, applied in the field of process visualization, can solve the problems of limited effectiveness, inability to produce product quality on line, and lack of on-line critical product quality measurement for many batch processes

Inactive Publication Date: 2006-03-07
THE MATHWORKS INC
View PDF8 Cites 44 Cited by
  • Summary
  • Abstract
  • Description
  • Claims
  • Application Information

AI Technical Summary

Benefits of technology

[0015]The illustrative embodiment of the present invention provides a method for forecasting batch end conditions through their depiction as a multi-dimensional regions of uncertainty. A visualization of the current condition of a continuous process and visualization of the simulated effect of user control moves are generated for a user. Volume visualization tools for viewing and querying intersecting solids in 3-dimensional space are utilized to perform the process visualization. Interactive tools for slicing multi-dimensional (>3) regions and drawing superimposed projections in 3-D space are provided. Additionally, graphical manipulation of the views of process conditions is accomplished by changing the hypothetical future values of contributing variables online in order to provide users the ability to simulate the effect of proposed control actions. The illustrative embodiment of the present invention may also be utilized in combination with a graphical programming environment supporting the execution and simulation of block diagrams and correspondingly generated process data. The scores representing the process condition may depend on estimated physical quantities as well as representations of process variability.

Problems solved by technology

One source of the growing interest has been the lack of on-line critical product quality measurements for many batch processes.
The inability to produce product quality on line measurements has sharpened the need for technology which can use existing indirect measurements of product quality to provide warning of deviant process conditions during the execution of the batch, while there is still time to take a mid-course correction.
The simplicity of the SPC approach has contributed to its popularity, but there are two major practical drawbacks that have limited its effectiveness:
Additionally, most manufacturing operations have hundreds or more measured variables, making it impossible for a human operator to monitor each and every measurement using a separate SPC chart.
One drawback of the first approach (where each coordinate is viewed separately) is that it ignores the real dependence of the ‘in-control’ boundaries on a combination of the coordinates, making it difficult to assess the in-control state of the process without considering all the score values simultaneously.
In general however even this is not sufficient to completely convey either the process state or its trend.
Although more informative than the strip charts, a static graphical projection suffers from a number of drawbacks.
Additionally, the representation of the control region fails to allow viewing of both the interior and exterior of the ‘in control’ region in order to display whether and where score trajectories enter or exit.
Another significant shortcoming of conventional process visualization methods is that there are generally more than three scores, in which case a 3 dimensional graphical projection will not capable of representing the 4 or more score coordinates.
Conventional process visualization techniques lack the ability to combine graphical methods with exploration methods in order to allow the user to vary the geometry of the projection and so gain insight into the relationship between the scores and the ‘in control’ region.
An additional problem with conventional graphical visualization methods arises when there is a need to visualize regions of scores represented as 3 dimensional or higher bodies (or geometrical shapes) as opposed to the type of score trajectories shown in FIG. 1A and FIG. 1B.
Without the ability to vary the viewpoint parallax makes the process of determining the relative positions of the solids difficult and one dimensional cross sections often yield misleading results.
However, computation of the score vector requires the complete batch history, which presents a challenge for in-course assessment of the state of the batch, because the observation set required for estimation of scores is not complete while the batch is running.
While probability distributions of score vectors for in-process batches have been derived by various methods in the research literature, there has been no development of techniques for their visualization other than for one score component at a time.
Thus the potential for misleading and confusing results stemming from one-dimensional visualization that was discussed above is further heightened for the case of batch process monitoring attempting the more complex task of assessing the relative position of two regions (score uncertainty region which is evolving in time as more of the measurement trajectories become available and the ‘in-control’ region).

Method used


Image

  • System and method for performing process visualization
  • System and method for performing process visualization
  • System and method for performing process visualization

Examples


Embodiment Construction

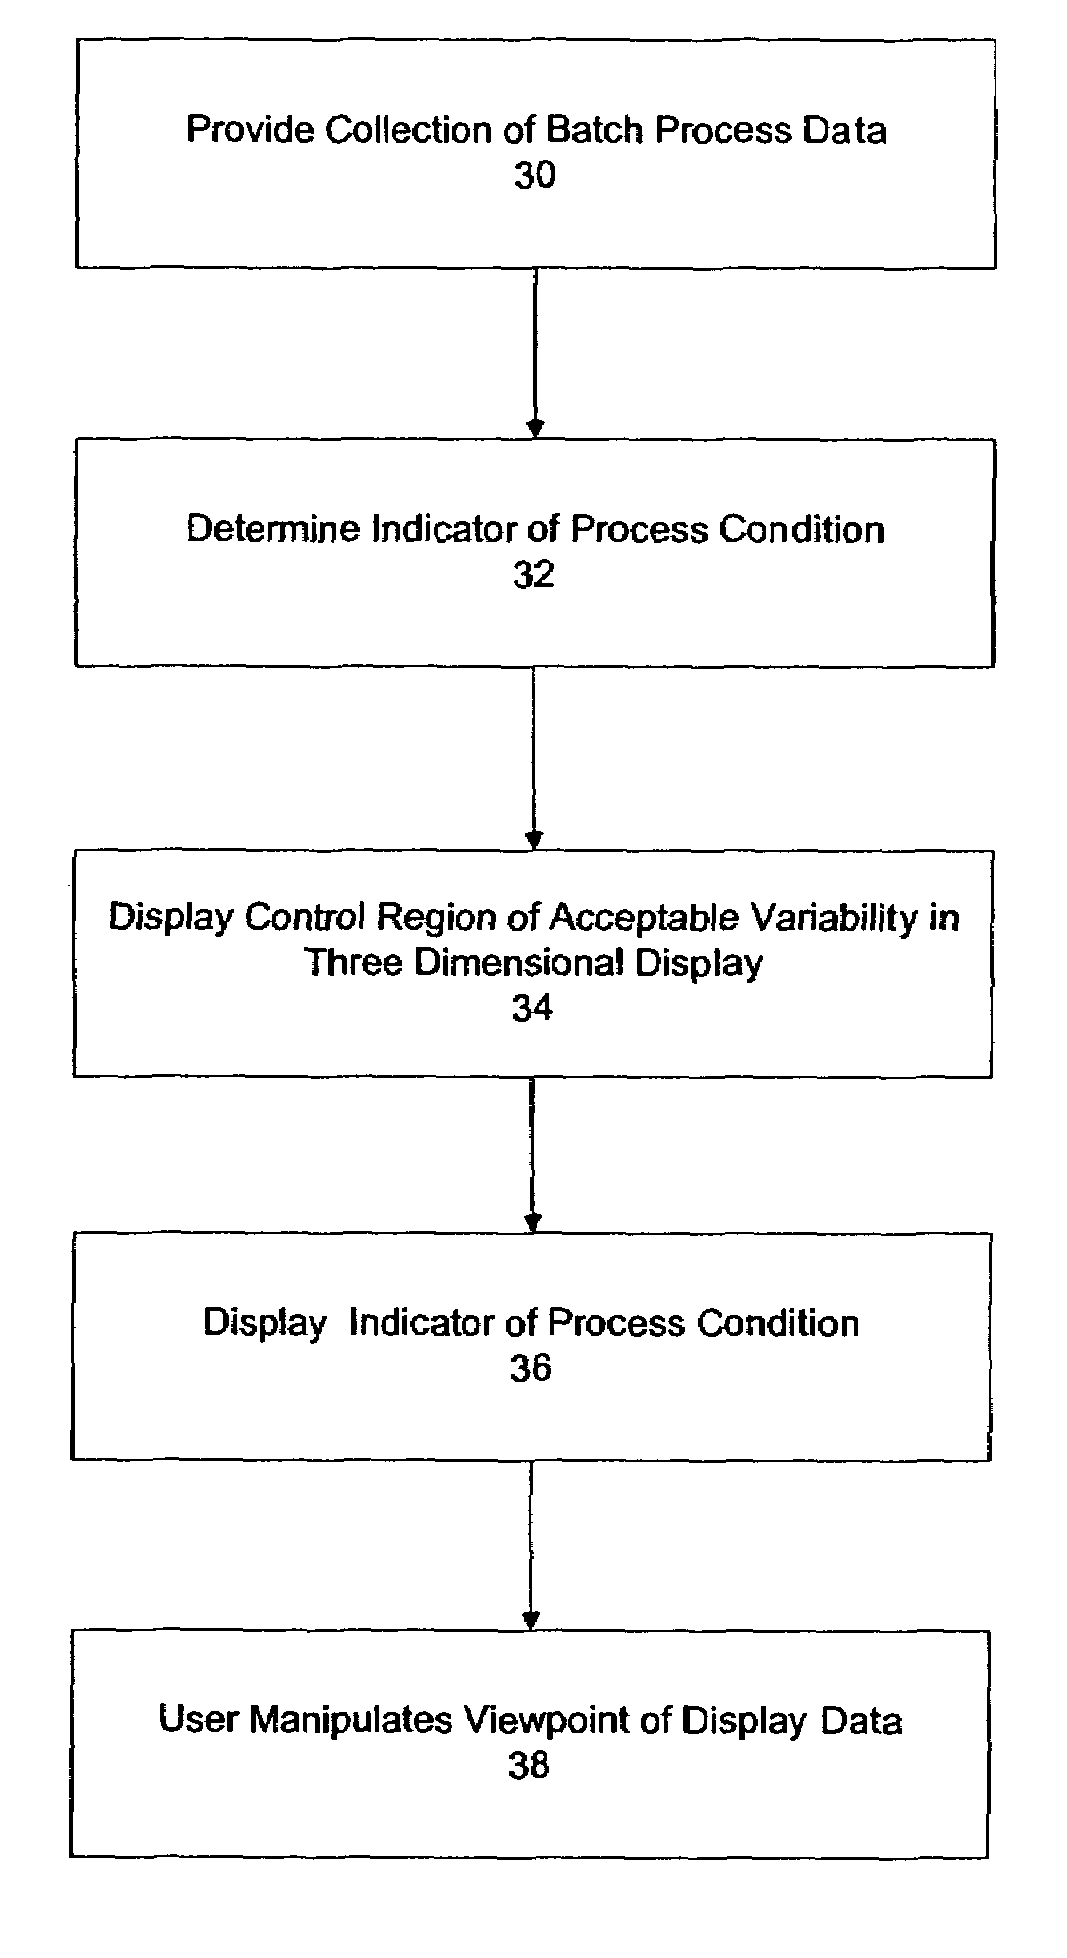
[0038]The illustrative embodiment of the present invention enables interactive visualization of ongoing batch processes. Multiple dimensions of collected process data may be visualized in a three dimensional environment to determine whether a continuation of the ongoing process is likely to continue until the end within acceptable operational parameters. The process visualization methods of the present invention scale to handle more than three dimensions of data. Process engineers monitoring a process are able to alter variables in the displayed visualization in an attempt to determine acceptable changes to the ongoing process.

[0039]FIG. 2 depicts an environment suitable for practicing the illustrative embodiment of the present invention. A computing environment 13 such as a MATLAB™ and / or SIMULINK™ (from The MathWorks, Inc. of Natick, Mass.) based environment includes or has access to a statistical analysis package 14. The computing environment is also interfaced with a source of c...


PUM


Abstract

A method for forecasting batch end conditions through their depiction as a multi-dimensional regions of uncertainty is disclosed. A visualization of the current condition of a continuous process and visualization of the simulated effect of user control moves are generated for a user. Volume visualization tools for viewing and querying intersecting solids in 3-dimensional space are utilized to perform the process visualization. Interactive tools for slicing multi-dimensional (>3) regions and drawing superimposed projections in 3-D space are provided. Additionally, graphical manipulation of the views of process conditions is accomplished by changing the hypothetical future values of contributing variables online in order to provide users the ability to simulate the effect of proposed control actions. The illustrative embodiment of the present invention may also be utilized in combination with a graphical programming environment supporting the execution and simulation of block diagrams and correspondingly generated process data. The scores representing the process condition may depend on estimated physical quantities as well as representations of process variability.

Description

FIELD OF THE INVENTION[0001]The illustrative embodiment of the present invention relates generally to process visualization and more particularly to performing three dimensional graphical visualization of multi-dimensional batch process data including analysis and visualization prior to process completion.BACKGROUND[0002]Process engineers overseeing manufacturing processes analyze collected data related to the manufacturing process to detect faults and monitor conditions associated with the process. The analysis may be performed dynamically in conjunction with an ongoing process, or it may performed “off line” in an effort to improve the process for the next performance. Technological advances in the form of more sophisticated statistical analysis programs, faster computers and advanced process databases have contributed to increased efforts in this area by process engineers.[0003]There has also been considerable and growing interest among researchers and practitioners in the applic...

Claims


Application Information

Patent Timeline
Patent Type & Authority Patents(United States)
IPC IPC(8): G05B13/02
CPCG05B19/41885G05B2219/32075G05B2219/45031G05B2219/32351G05B2219/32364G05B2219/32196Y02P90/02
Inventor SINGH, RAJIVOWEN, JAMES G.
Owner THE MATHWORKS INC
Why Eureka
Try Eureka