Methods for classifying high-dimensional biological data

a biological data and high-dimensional technology, applied in the field of biostatistics, can solve the problems of over-difficulty in determining which genes, methods requiring n>p to be of no direct use, etc., and achieve the effect of assessing confiden

Inactive Publication Date: 2006-06-13
RGT UNIV OF CALIFORNIA
View PDF6 Cites 16 Cited by
  • Summary
  • Abstract
  • Description
  • Claims
  • Application Information

AI Technical Summary

Benefits of technology

[0009]It is an object of the invention to provide methods for classifying biological samples from which high dimensional data has been obtained. The methods of the invention permit binary classification (i.e., assignment of a sample to one of two classes), as well as multi-class classification (i.e., assignment of a sample to one of more than two classes). The method involves analyzing data obtained from biological samples with known classifications, carrying out a dimension reduction step on the data, and using the reduced data as input data in a classification step to generate a model useful for predicting the classification of a biological sample with an unknown classification. In one embodiment of the invention, the classification model is binary, i.e., it accounts for only two classes. In this embodiment, the method preferably is carried out using PLS dimension reduction. Classification is then preferably carried out using logistic discrimination (“LD”). In another preferred embodiment of the invention, classification is carried out using quadratic discriminant analysis (“QDA”). In another embodiment, the classification model permits assignment of the unknown sample to one of more than two classes. In this multi-class embodiment of the invention, dimension reduction is preferably carried out using multivariate partial least squares (“MPLS”) dimension reduction, and classification is achieved with polychotomous discrimination (“PD”) or QDA. In yet another preferred embodiment, a subset of the p variables may be selected according to standard t-statistics, or pairwise comparison and the analysis of variance (ANOVA) prior to the dimension reduction step. The methods of the present invention also permit assessment of the confidence associated with any specific prediction by examining the estimated conditional class probability, {circumflex over (π)} of a sample.

Problems solved by technology

One challenge of dealing with the large numbers of variables sampled using microarray technologies is developing methods to extract meaningful information from the data that can be used to predict or classify the biological state or response of a sample.
Unfortunately, it is exceedingly difficult to determine which genes are members of the subset given the large number of genes, p, and the small number of observations, N. The fact that experiments such as, e.g., microarray experiments that are characterized by many measured variables (e.g., genes), p, on only a relatively few observations or samples, N, renders all statistical methods requiring N>p to be of no direct use.

Method used


Image

  • Methods for classifying high-dimensional biological data
  • Methods for classifying high-dimensional biological data
  • Methods for classifying high-dimensional biological data

Examples


example 1

3.1.1. EXAMPLE 1

Ovarian Data

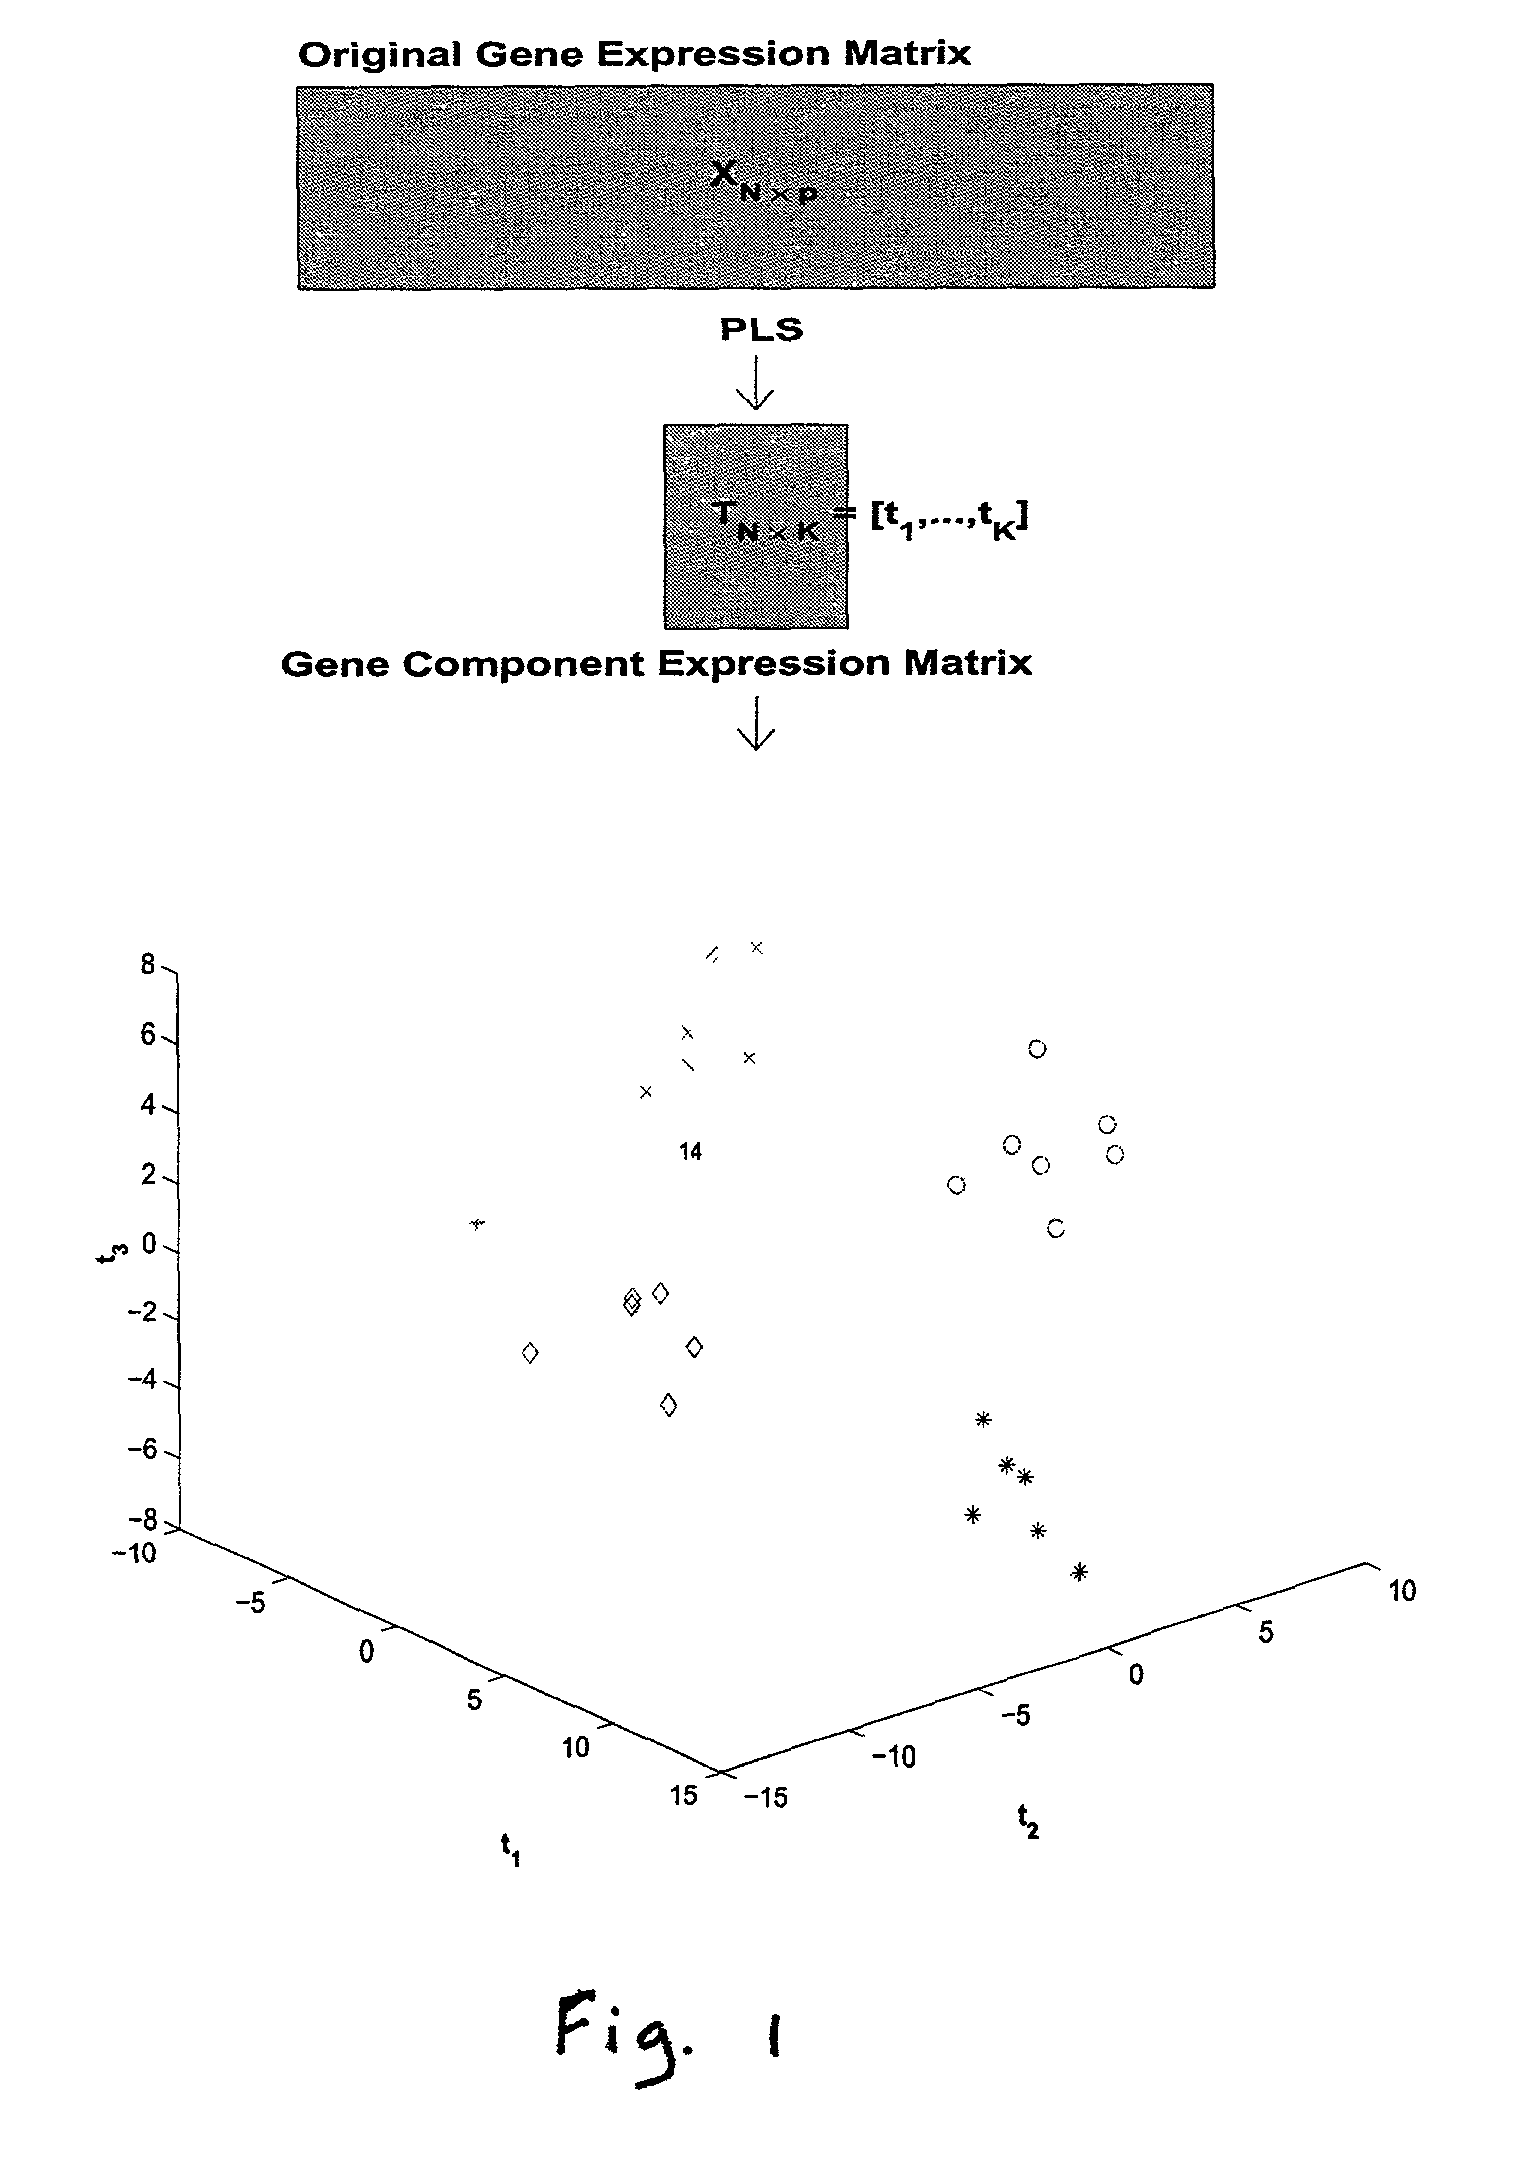
[0075]The microarray experiments consist of hybridizations of normal and ovarian tissues on arrays with probes for 97,802 cDNA clones. The ovarian data set considered here consists of 16 normal tissue samples and 14 ovarian tumor tissue samples. The normal tissue samples consist of a spectrum of normal tissues: 2 cyst, 4 peripheral blood lymphocytes, 9 ovary and 1 liver normal tissue. All normal and tumor samples are distinct, coming from different tissues (patients). We log transformed all the gene expression values due to the highly skewed data, typical of gene expression data. The expression of all genes also were standardized to have mean zero and standard deviation of one across samples.

[0076]We considered p*=50,100, 500, 1000, 1500 genes selected as described in the Methods section. Since there are few samples, we made leave-out-one CV prediction. Classification of the 30 tissue samples based on K=3 gene components constructed from p* genes using PL...

example 2

3.1.2. EXAMPLE 2

Leukemia Data

[0079]The data set used here is the acute leukemia data set published by Golub et al. (1999). The original training data set consisted of 38 bone marrow samples with 27 acute lymphoblastic leukemia (ALL) and 11 acute myeloid leukemia (AML) (from adult patients). The independent (test) data set consisted of 24 bone marrow samples as well as 10 peripheral blood specimens from adults and children (20 ALL and 14 AML). Four AML samples from the independent data set were from adult patients. The gene expression intensities were obtained from Affymetrix high-density oligonucleotide microarrays containing probes for 6,817 genes. We log transformed the gene expressions to have a mean of zero and standard deviation of one across samples. No further data preprocessing was applied.

[0080]We first applied the methods of the invention to the original data structure of 38 training samples and 34 test samples for p*=50, 100, 500, 1000, and 1500 genes selected as describe...

example 3

3.1.3. EXAMPLE 3

Lymphoma Data

[0087]The lymphoma data set was published by Alizadeh et al. (2000) and consists of gene expressions from cDNA experiments involving three prevalent adult lymphoid malignancies: diffuse large B-cell lymphoma (“DLBCL”), B-cell chronic lymphocytic leukemia (“BCLL”) and follicular lymphoma (“FL”). Each cDNA target was prepared from an experimental mRNA sample and was labeled with Cy5 (red fluorescent dye). A reference cDNA sample was prepared from a combination of nine different lymphoma cell lines and was labeled with Cy3 (green fluorescent dye). Each Cy5 labeled target was combined with the Cy3 labeled reference target and hybridized onto the microarray. Separate measurements were taken from the red and green channels. We analyzed the standardized log relative intensity ratios, namely the log(Cy5 / Cy3) values. To test the binary classification procedures of the present invention, we analyzed a subset of the data consisting of 45 DLBCL and 29 BCLL samples w...


PUM


Abstract

Provided are methods of classifying biological samples based on high dimensional data obtained from the samples. The methods are especially useful for prediction of a class to which the sample belongs under circumstances in which the data are statistically under-determined. The advent of microarray technologies which provide the ability to measure en masse many different variables (such as gene expression) at once has resulted in the generation of high dimensional data sets, the analysis of which benefits from the methods of the present invention. High dimensional data is data in which the number of variables, p, exceeds the number of independent observations (e.g. samples), N, made. The invention relies on a dimension reduction step followed by a logistic determination step. The methods of the invention are applicable for binary (i.e. univariate) classification and multi-class (i.e. multivariate) classifications. Also provided are data selection techniques that can be used in accordance with the methods of the invention.

Description

CROSS-REFERENCE TO RELATED APPLICATIONS[0001]This application claims the benefit of U.S. Provisional Patent Application No. 60 / 233,546, filed Sep. 19, 2000, the contents of which are hereby incorporated by reference for all purposes.STATEMENT REGARDING FEDERALLY SPONSORED RESEARCH[0002]The U.S. Government has certain rights to the invention pursuant to contracts ACI 96-19020 and DMS 98-70172 awarded by the National Science Foundation and contract P43 ES04699 awarded by the National Institute of Environmental Health Sciences, National Institutes of Health.REFERENCE TO A MICROFICHE APPENDIX[0003]Not applicable.BACKGROUND OF THE INVENTION[0004]The invention pertains to the field of biostatistics, and more particularly to methods of classifying high dimensional biological data.[0005]With the wealth of gene expression data from microarrays (such as high density oligonucleotide arrays and cDNA arrays) prediction, classification, and clustering techniques are used for analysis and interpre...

Claims


Application Information

Patent Timeline
Patent Type & Authority Patents(United States)
IPC IPC(8): G06F17/00G06K9/62G16B25/30G16B40/20
CPCG06K9/6267G06F19/24G06F19/20G16B25/00G16B40/00G16B25/30G16B40/20G06F18/24
Inventor ROCKE, DAVID M.NGUYEN, DANH V.
Owner RGT UNIV OF CALIFORNIA
Why Eureka
Try Eureka