Real-time, high frequency QRS electrocardiograph

Inactive Publication Date: 2006-09-26
NASA +2
View PDF10 Cites 51 Cited by
  • Summary
  • Abstract
  • Description
  • Claims
  • Application Information

AI Technical Summary

Benefits of technology

[0015]The present invention advances the state of the art by taking high frequency electrocardiographic data immediately as they are sensed from a patient, manipulating the data in conjunction with the conventional low frequency signals, and displaying the high frequency data in real time in a useful form on a computer screen or monitor. In one aspect, the invention displays the high frequency data from the QRS complex in microvolts adjacent to a display of the conventional ECG data in millivolts. In another aspect of the invention, the high frequency data are analyzed for their root mean square (RMS) voltage values (as well as for related values such as the high frequency energy (HFQE) and high frequency integral of absolute value (HFAV), both described hereinafter), with the discrete, lead-by-lead values being displayed in real time as useful diagnostic indicators for ischemia. Also, the high frequency data from the QRS complex are analyzed with imbedded algorithms to determine the presence or absence of reduced amplitude zones, referred to hereinafter as “RAZs”. The given RAZ, of which there are at least three possible variations (i.e., the “Abboud” RAZ, the “NASA” RAZ, and the skewness-kurtosis or “S-K” RAZ, all described below), is displayed as a real-time “go, no-go” signal on the screen. Finally, in still another aspect of the invention, not only the presence or absence any one of the three variations of RAZs, but also the RMS and related values (HFQE and HFAV) are displayed against time as time varying signals.
[0016]In still anoth

Problems solved by technology

However, until now, there has been no device capable of displaying, in real time, changes in these high frequency QRS components in the monitored patient.
While academic software programs have been designed that analyze the central high frequency QRS components, all such programs involve laborious off-line calculations and post-processing,

Method used


Image

  • Real-time, high frequency QRS electrocardiograph
  • Real-time, high frequency QRS electrocardiograph
  • Real-time, high frequency QRS electrocardiograph

Examples


Example

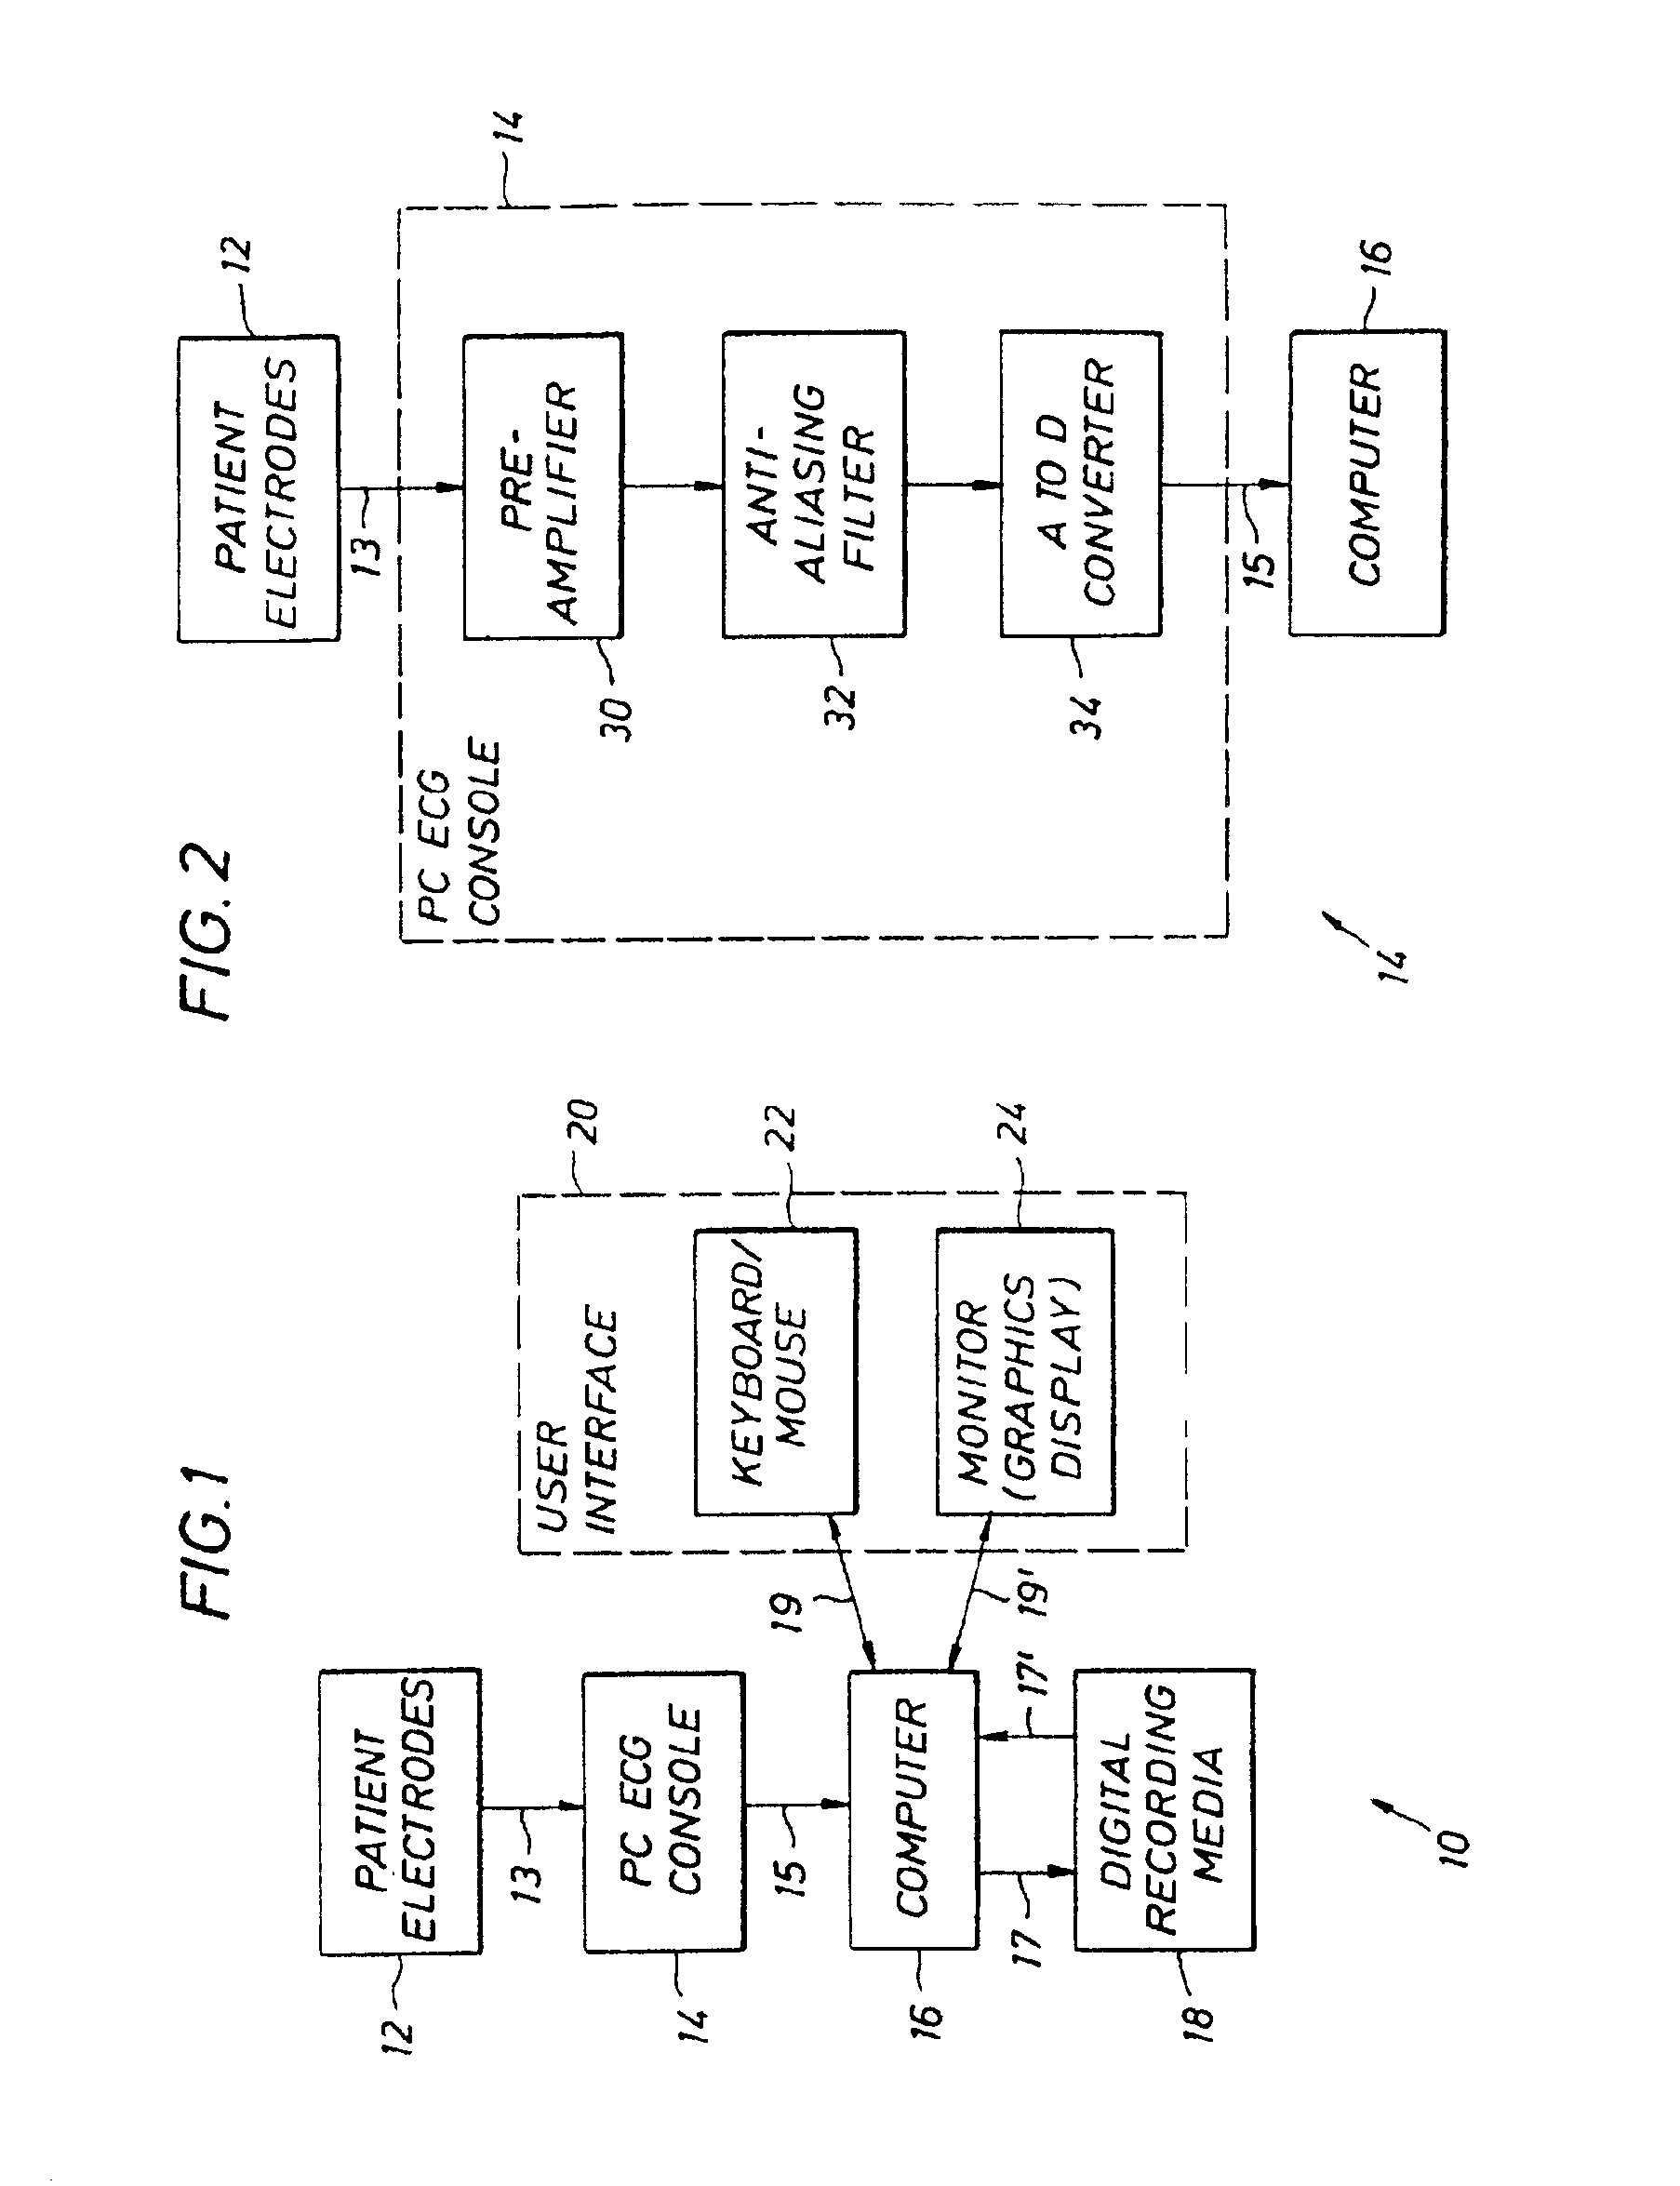
[0030]FIG. 1 shows a simplified, functional, block diagram of a real-time high frequency QRS electrocardiograph 10 constructed in accordance with the present invention. The invention monitors the cardiac function of a patient with a plurality of patient electrodes 12. The electrodes provide measurements of cardiac electrical function at various contact points on the skin of a patient in the conventional manner. For example, in the conventional 12-lead configuration, 10 electrodes placed upon the skin of the patient in the conventional configuration result in eight channels of incoming data. These eight channels are in turn translated into 12 leads of data on the patient monitor inasmuch as data for one of the bipolar limb leads and for all of the augmented unipolar limb leads can be derived if data for any two of the bipolar limb leads are already known. The analog measurements are coupled to a console 14 by way of a communications channel such as for example a cable 13. The console...


PUM


Abstract

Real time cardiac electrical data are received from a patient, manipulated to determine various useful aspects of the ECG signal, and displayed in real time in a useful form on a computer screen or monitor. The monitor displays the high frequency data from the QRS complex in units of microvolts, juxtaposed with a display of conventional ECG data in units of millivolts or microvolts. The high frequency data are analyzed for their root mean square (RMS) voltage values and the discrete RMS values and related parameters are displayed in real time. The high frequency data from the QRS complex are analyzed with imbedded algorithms to determine the presence or absence of reduced amplitude zones, referred to herein as “RAZs”. RAZs are displayed as “go, no-go” signals on the computer monitor. The RMS and related values of the high frequency components are displayed as time varying signals, and the presence or absence of RAZs may be similarly displayed over time.

Description

[0001]The invention described herein was made by employees of the United States Government and may be manufactured and used by or for the government for government purposes without payment of any royalties thereon or therefore.FIELD OF THE INVENTION[0002]The present invention relates generally to the field of electrocardiography, and more particularly to a real-time processing system and method to analyze and display electrocardiographic signals.BACKGROUND OF THE INVENTION[0003]Diagnosis of abnormal cardiac conditions has relied in the past on visible alterations in the P, QRS, and T-waves, i.e. portions of the electrocardiograph periodic signal. The electrocardiograph signal includes a low frequency portion and an impressed or imbedded high frequency portion, and it has been found that although the higher frequency portion of the signal is not particularly visible, it contains information that provides greater sensitivity in determining certain abnormalities, notably myocardial isc...

Claims


Application Information

Patent Timeline
IPC IPC(8): A61B5/0472A61B5/366
CPCA61B5/0452A61B5/044A61B5/339A61B5/349
Inventor SCHLEGEL, TODD T.DEPALMA, JUDE L.MORADI, SAEED
Owner NASA
Why Eureka
Try Eureka