
Method and MR apparatus for dynamic frequency detection in MR spectroscopy

a dynamic frequency detection and spectroscopy technology, applied in the field of magnetic resonance spectroscopy, can solve the problems of significant, negative influence on the quality of the overall spectrum, and change of resonance frequency up to a few hz per hour, and achieve the effect of easy diagnosis and correction

Inactive Publication Date: 2007-05-08
SIEMENS HEALTHCARE GMBH
View PDF6 Cites 12 Cited by
  • Summary
  • Abstract
  • Description
  • Claims
  • Application Information

AI Technical Summary

Benefits of technology

[0026]An object of the present invention is to provide a method by which a frequency drift in MR spectroscopy with water suppression can easily be diagnosed and corrected.
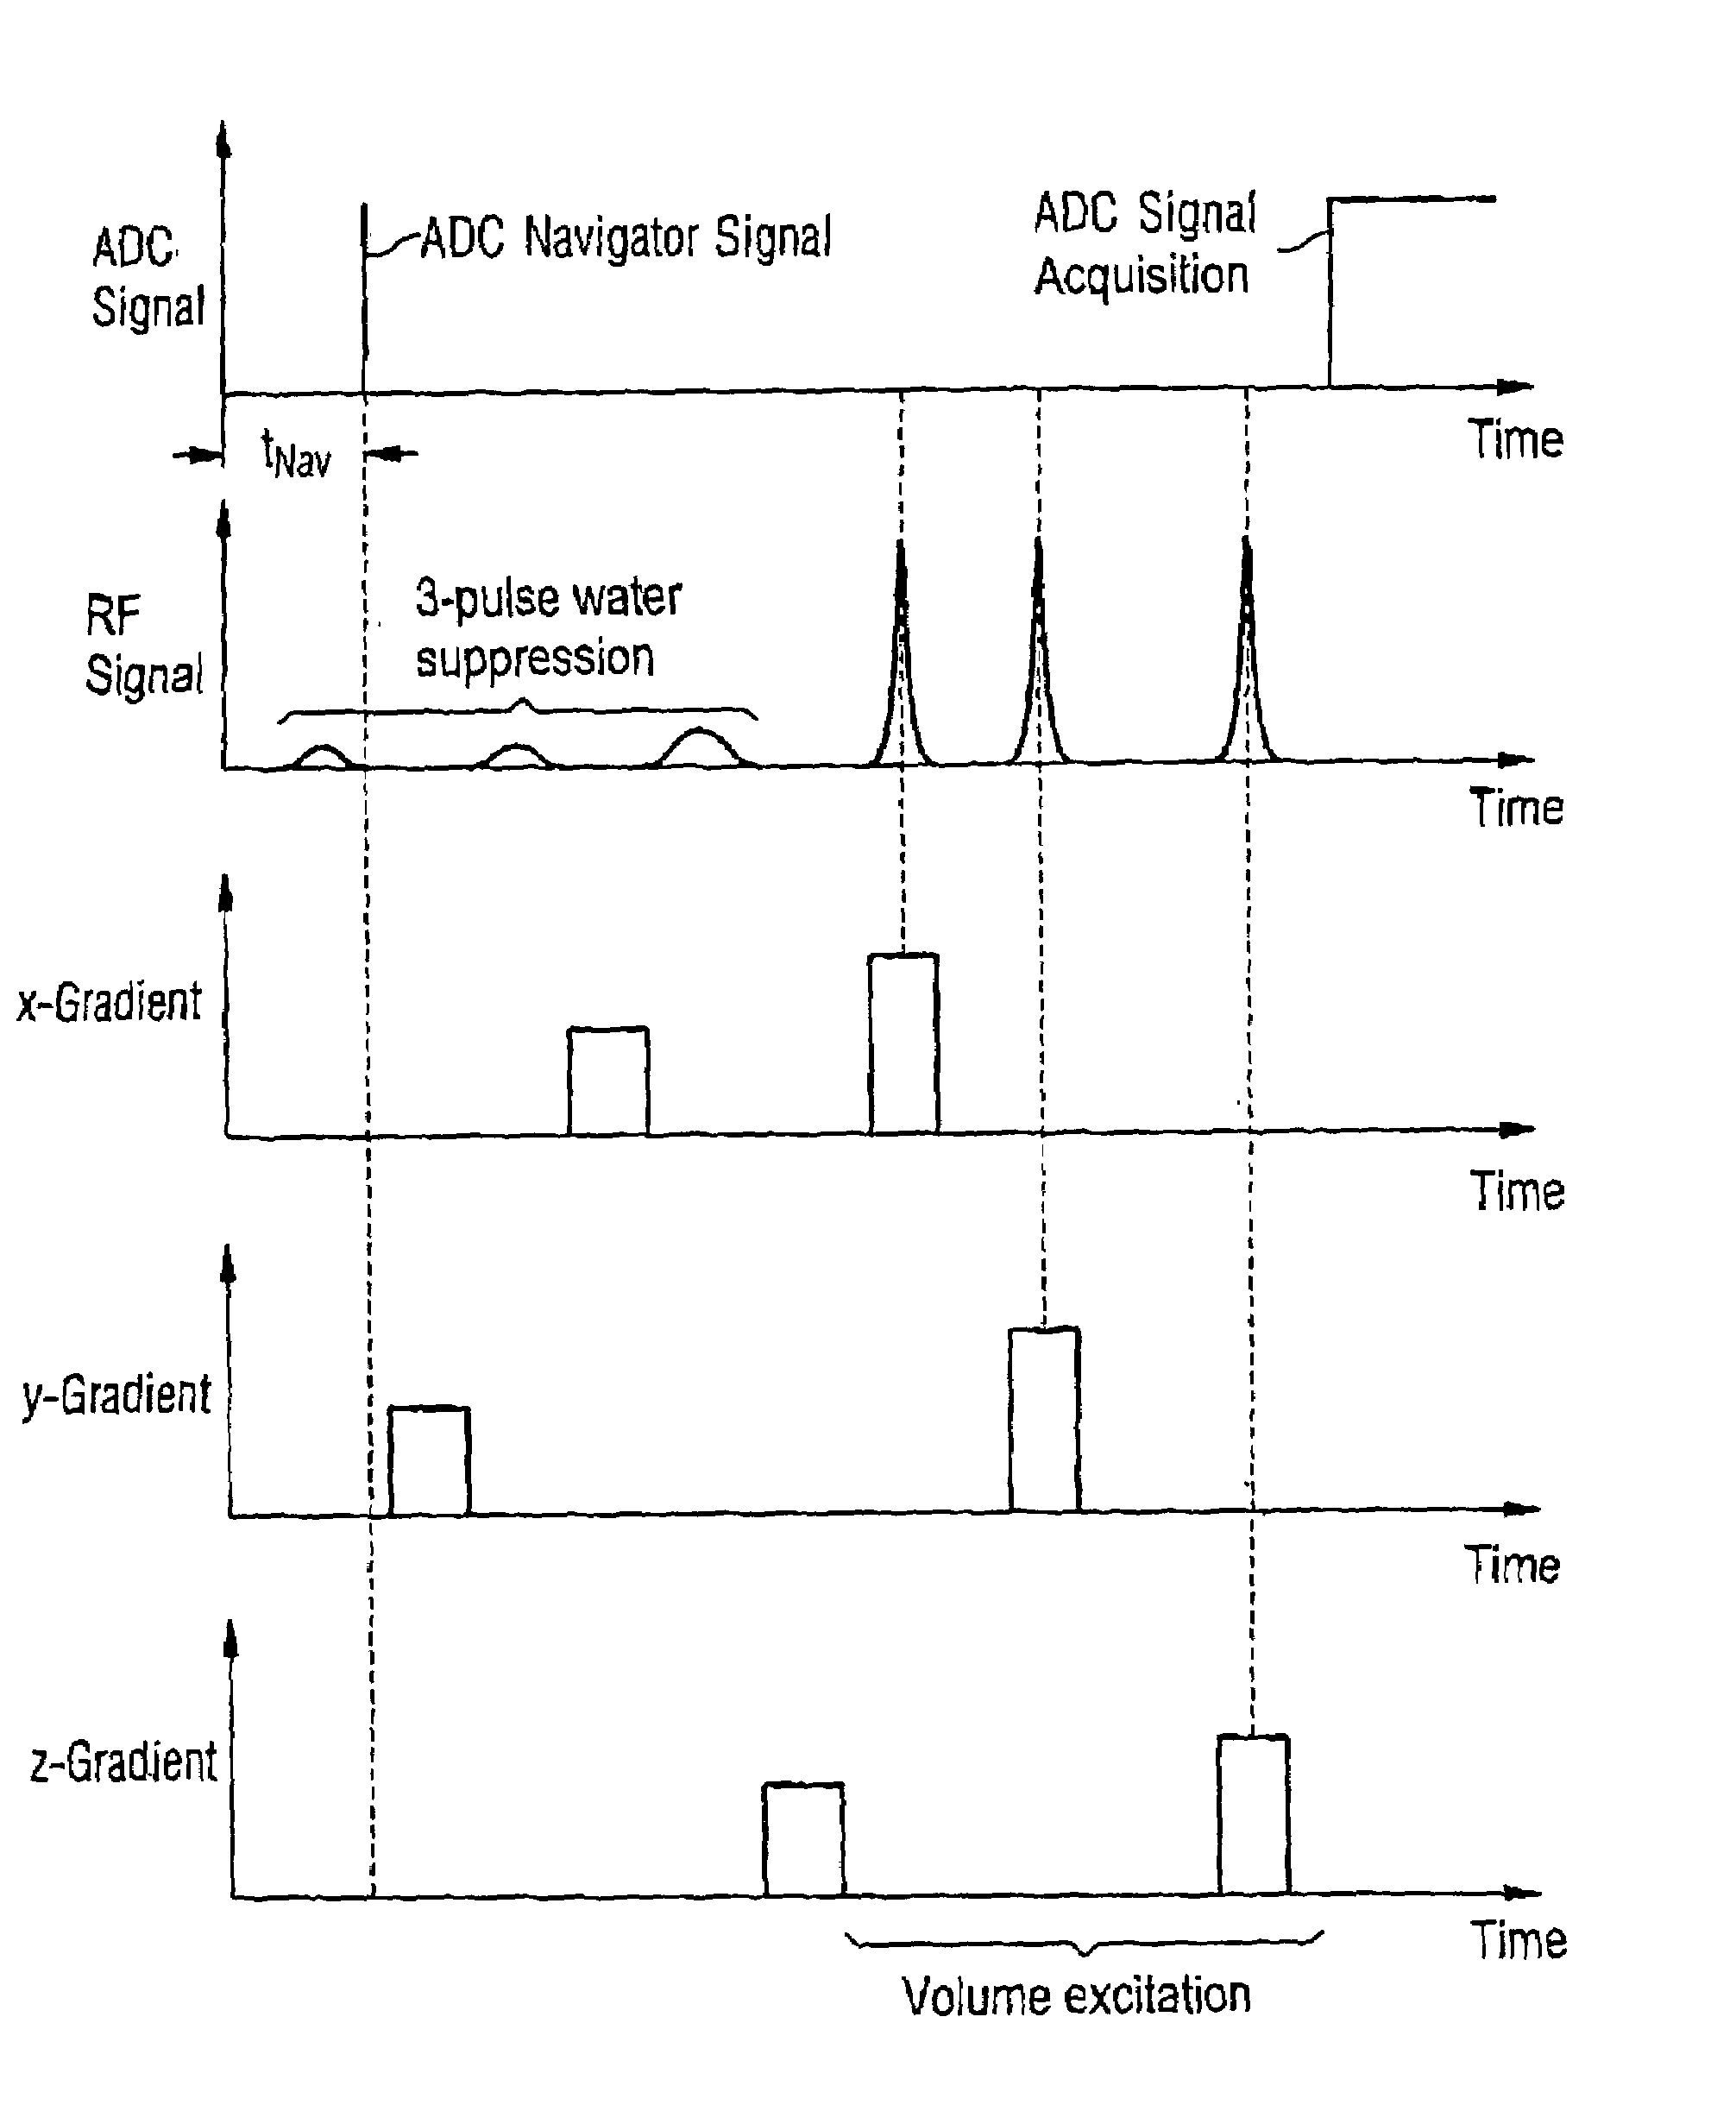
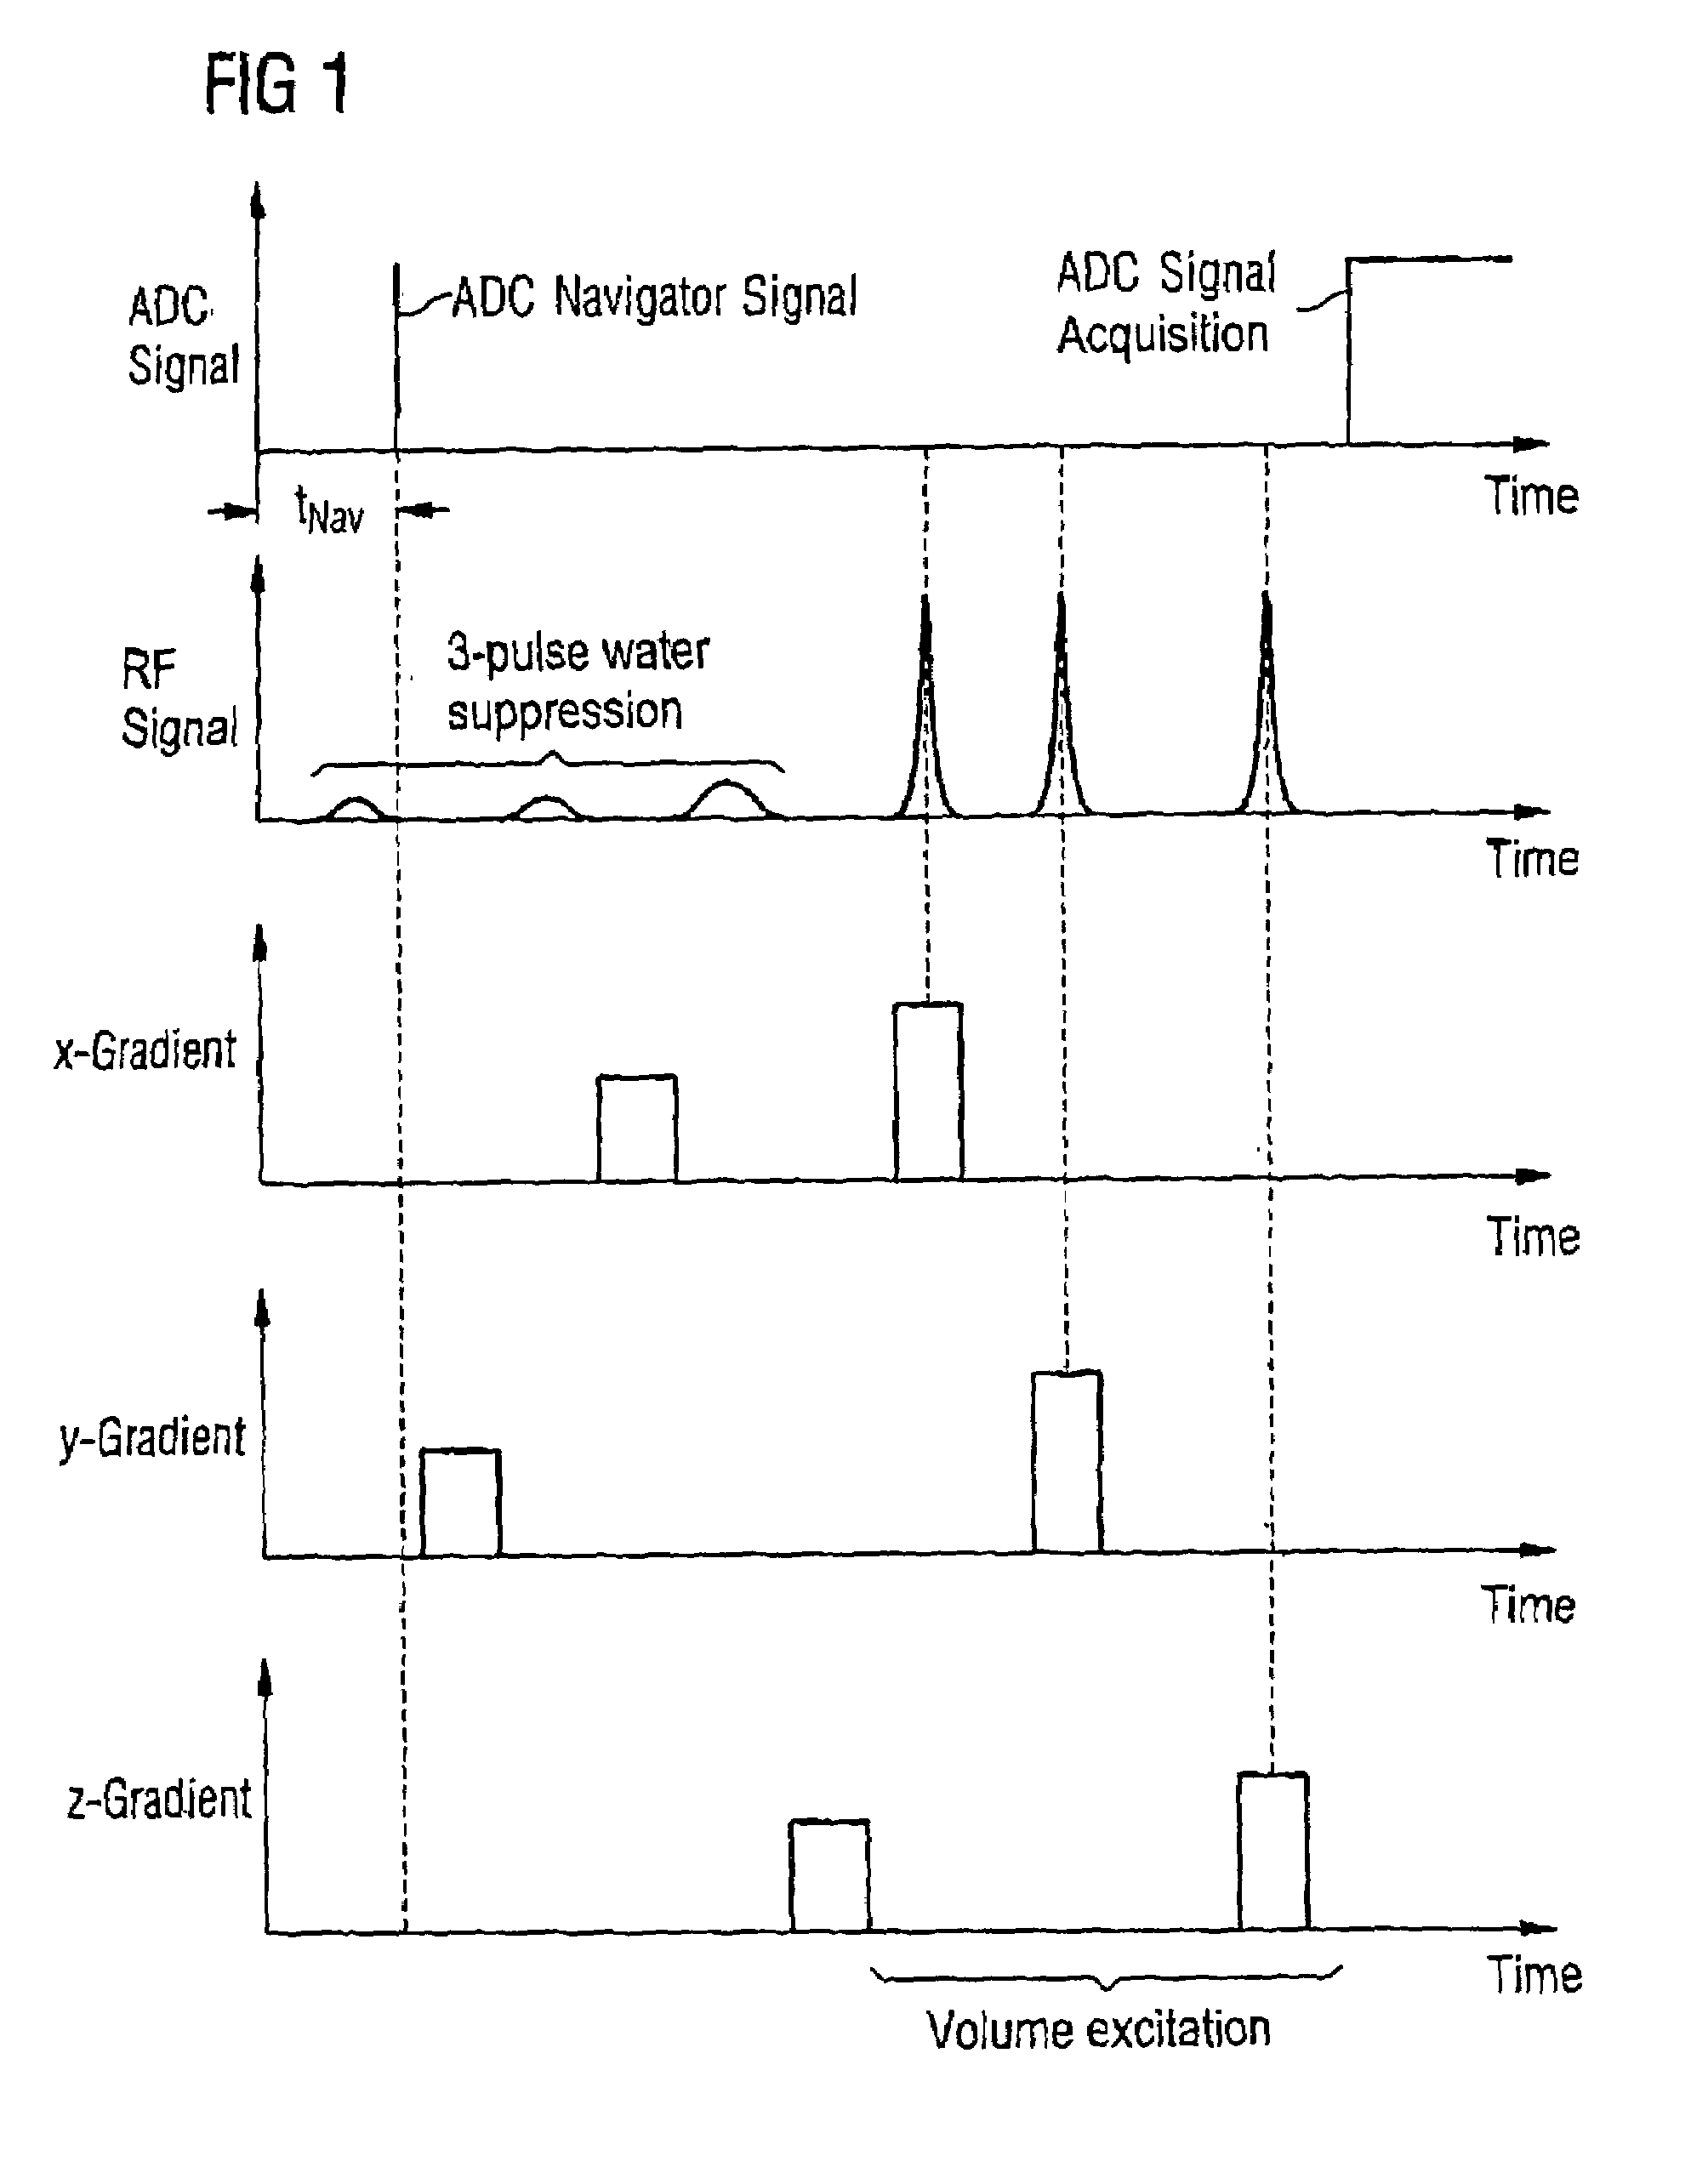
[0029]In addition, in the case of a multiple-pulse water suppression it is advantageous to cause the navigator signal to take place immediately after the first RF saturation pulse.
[0030]Here, it is advantageous to switch the analog-digital converter, and thus the duration of the navigator signal, on the order of magnitude of 100 μs, or to limit the analog-digital conversion data acquisition according to the present invention to the order of magnitude of 10 analog-digital conversion measurement values.

Problems solved by technology

During this comparatively long acquisition time of up to several minutes, the individual spectra to be recorded are exposed to external influences (e.g., hardware imperfections, temperature changes of the electronic components used), which can cause a change of the resonance frequency of up to a few Hz per hour; this can have a significant, possibly negative influence on the quality of the overall spectrum as the mean value of the individual spectra.
A disadvantage of this method is that metabolites close to water are situated at the broad foot of the water line, and additional post-processing steps are required to recreate at least the visual impression of an MR spectrum (peaks on a horizontal baseline).
A further disadvantage of this method is that when there is a drift of the system frequency the quality of the water suppression is also adversely affected; this method thus is not very robust.
A disadvantage of this method is the increased time requirement for the additional reference measurements, which in the end makes this method unattractive.
However, this results in strong saturation effects, which ultimately further worsens the signal-to-noise ratio, which is already poor due to the shortening of the measurement time.
In sum, the problem of frequency drift correction in 1H spectroscopy currently has not been satisfactorily solved.

Method used


Image

  • Method and MR apparatus for dynamic frequency detection in MR spectroscopy
  • Method and MR apparatus for dynamic frequency detection in MR spectroscopy
  • Method and MR apparatus for dynamic frequency detection in MR spectroscopy

Examples


Embodiment Construction

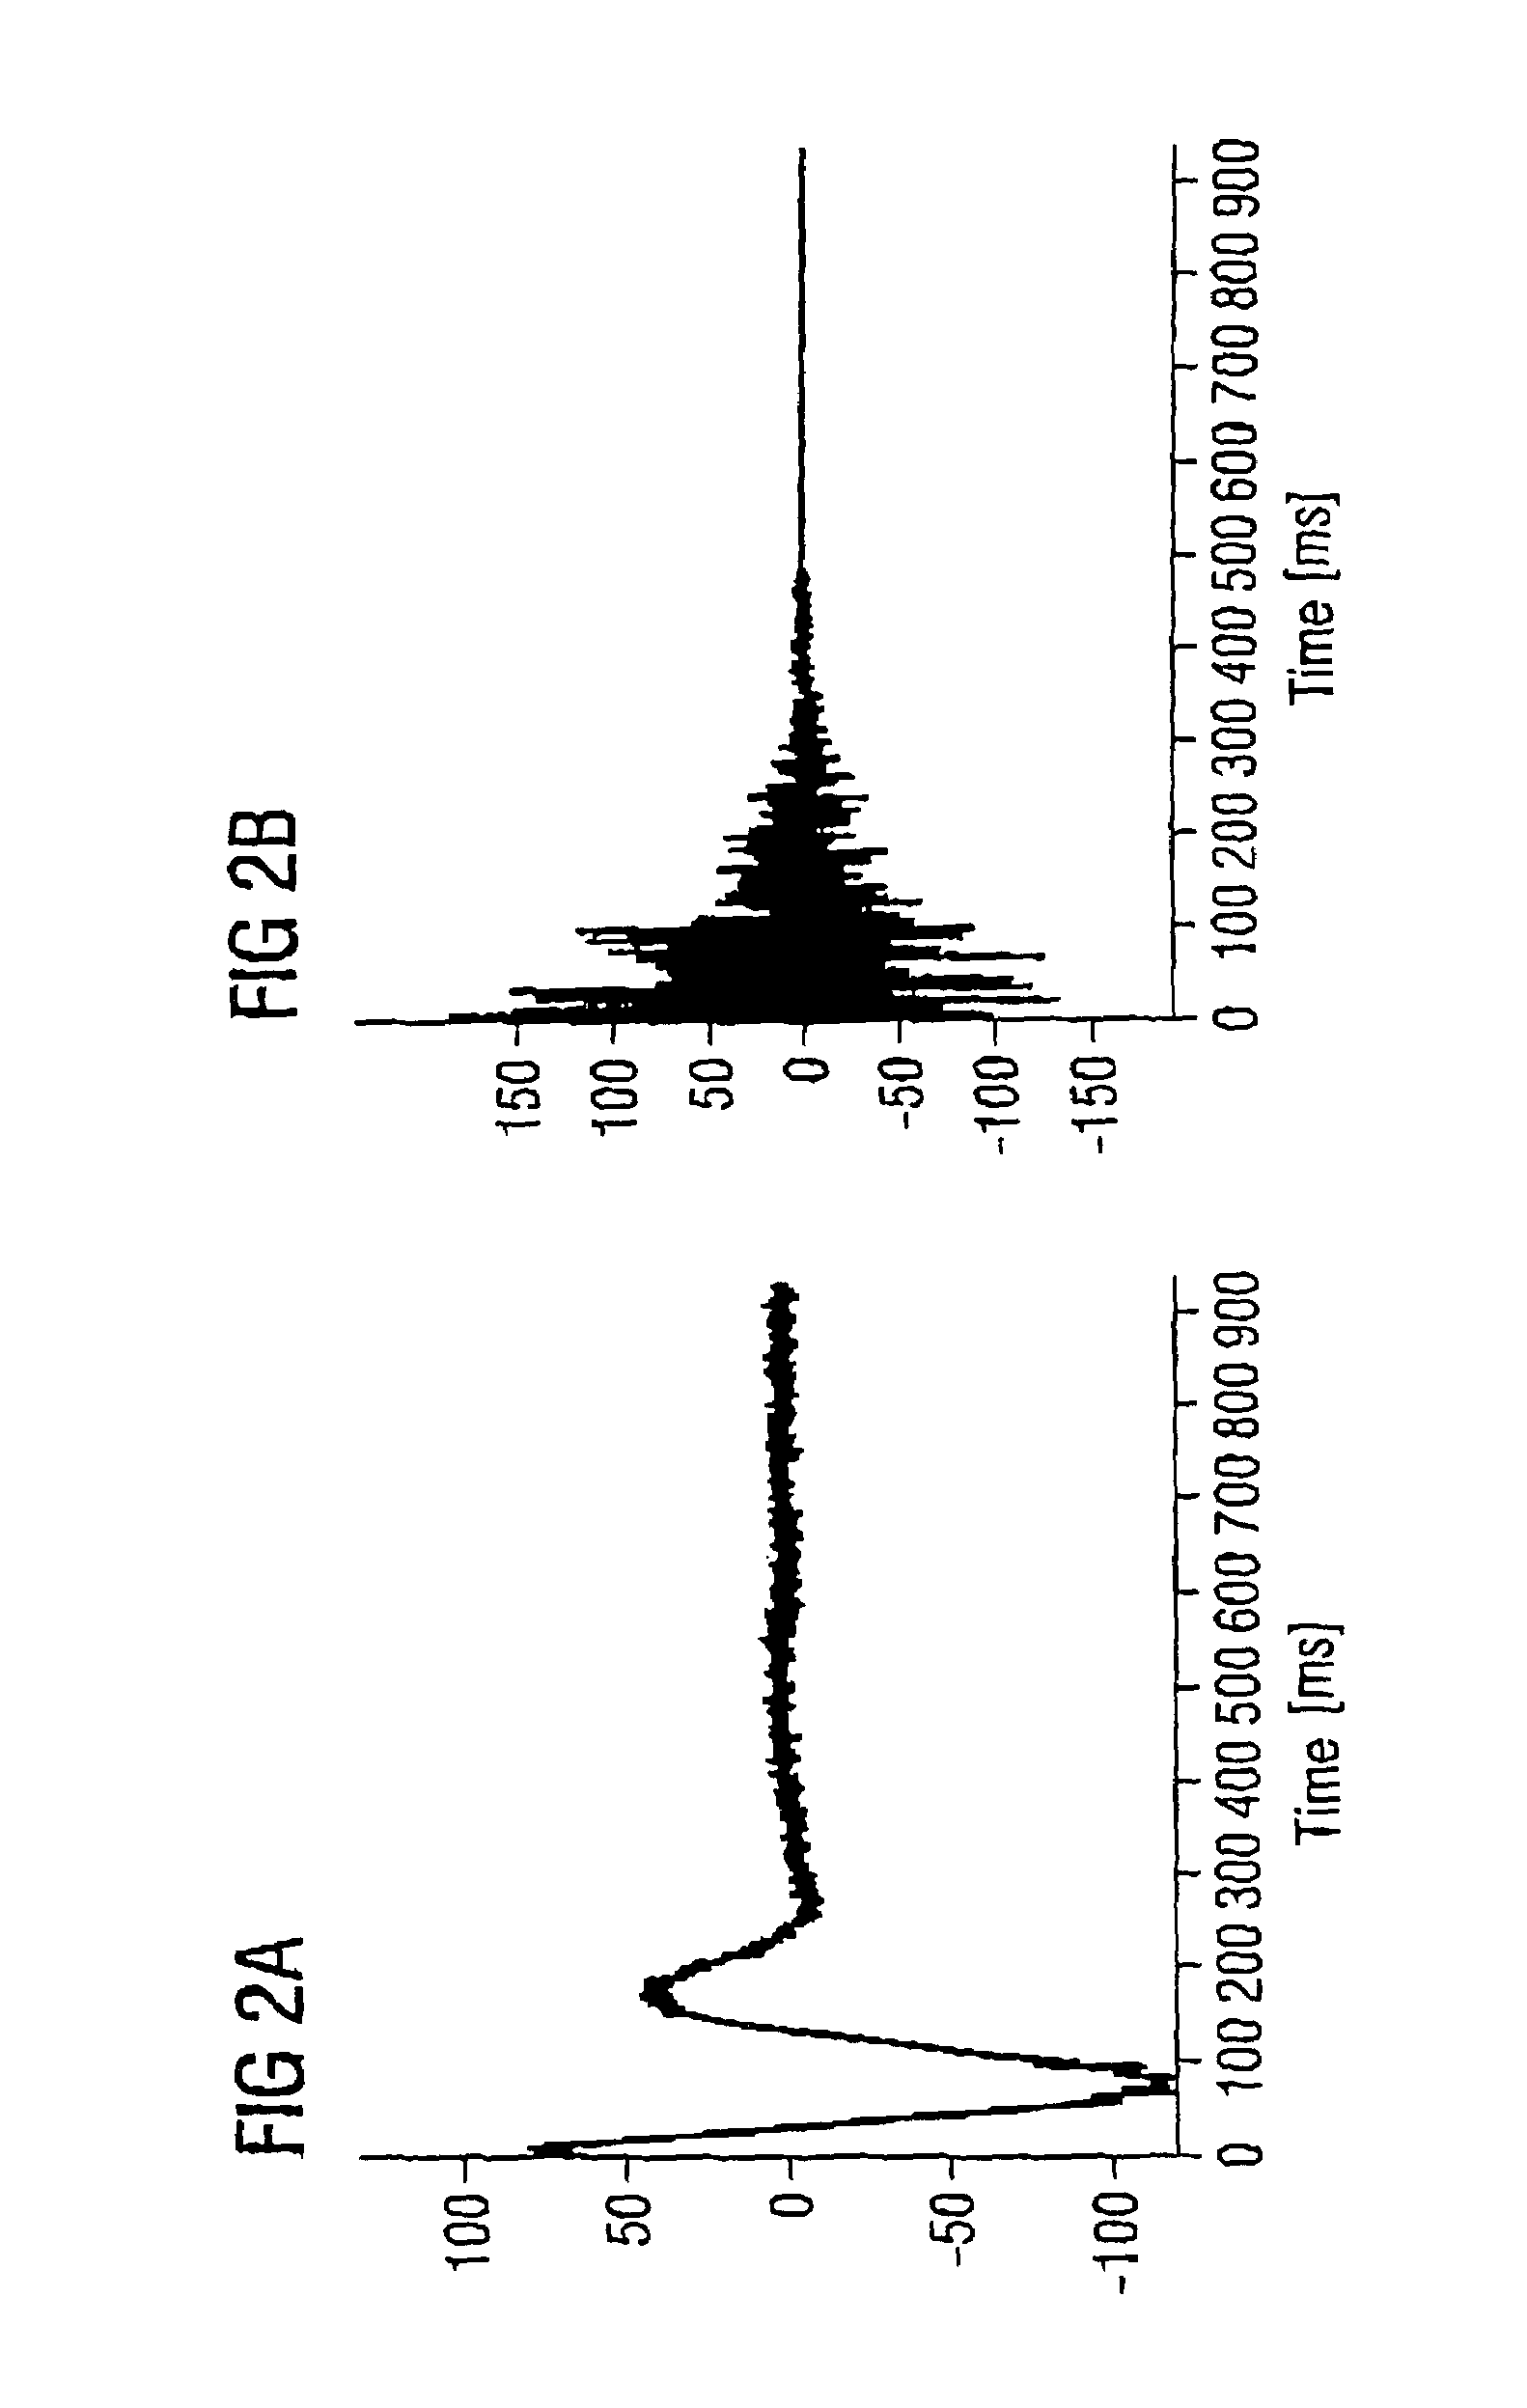
[0039]Examination of tissue by means of magnetic resonance spectroscopy supplies a damped magnetic resonance signal (MR signal) that oscillates periodically with the Lamor frequency, known as the free induction decay (FID), as shown for example in FIGS. 2a and 2b. The FID signal is, roughly, the electromagnetic response to a radio-frequency excitation pulse that was previously radiated into the tissue under examination. As mentioned above, the irradiated RF excitation pulse represents a frequency spectrum in the MHz range that extends over the expected resonance range of the metabolites. In proton spectroscopy, this is a range of 10 ppm at approximately 60 MHz; the spectral width in phosphorus spectroscopy is approximately 30 ppm at 26 MHz; and in 13C spectroscopy the resonances in the spectra are distributed over a range of 200 ppm at approximately 16 MHz.

[0040]The FID signal itself is a chronologically dependent response signal in whose frequency curve all the resonances of the ex...


PUM

PropertyMeasurementUnit
magnetic fieldaaaaaaaaaa
frequencyaaaaaaaaaa
frequencyaaaaaaaaaa

Abstract

In a method for dynamic frequency detection of the resonance frequency in magnetic resonance spectroscopy, by measuring navigator signals at the same point in time in each of a number of successive sequence passes, and by comparing the navigator signals, a frequency shift of the resonance frequency is determined on the basis of which the respective individual spectrum obtained from each sequence repetition is corrected with respect to the measured frequency shift.

Description

BACKGROUND OF THE INVENTION[0001]1. Field of the Invention[0002]The present invention relates generally to magnetic resonance spectroscopy (MRS), as used in the field of medicine for the examination of biochemical or metabolic processes in the human body. The present invention relates in particular to a method for determining and correcting the frequency drift of the resonance frequency during the acquisition of the image series of an individual spectrum.[0003]2. Description of the Prior Art[0004]Magnetic resonance spectroscopy (MRS) is based, as is magnetic resonance tomography (MRT), on the phenomenon of nuclear spin resonance, discovered in 1946, which was first used in basic research to measure the magnetic properties of nuclei. When it was first noted in the 1960s that the magnetic resonance signal (MR signal) of a nucleus is also influenced by its chemical environment, and that this chemical shift can be used to characterize chemical substances, high-resolution NMR in the test...

Claims


Application Information

Patent Timeline
Patent Type & Authority Patents(United States)
IPC IPC(8): G01V3/00G01N24/08G01R33/483
CPCG01R33/483
Inventor KRUGER, GUNNARROLL, STEFAN
Owner SIEMENS HEALTHCARE GMBH
Learn More