Method and system for simulating risk factors in parametric models using risk neutral historical bootstrapping

a risk factor and parametric model technology, applied in the field of market and credit risk measurement, can solve the problems of insufficient funds available to cover losses, complicating the modeling process, and overestimating the var. also undesirable effects

Active Publication Date: 2007-06-05
GOLDMAN SACHS & CO LLC
View PDF5 Cites 24 Cited by
  • Summary
  • Abstract
  • Description
  • Claims
  • Application Information

AI Technical Summary

Benefits of technology

[0011]This and other needs are addressed by present invention which provides an improved method for varying the value of risk factors in a parametric simulation. The new method accurately accounts for “fat-tail” probability distributions and cross-correlation between various risk factors while allowing the model to be risk neutral. In addition, the method is suitable for use in developing models which are accurate for both short horizon VAR simulations and long horizon potential credit exposure (“PE”) simulations.

Problems solved by technology

If an estimate of the VAR is too low, there is a possibility that insufficient funds will be available to cover losses in a worst-case scenario.
Overestimating the VAR is also undesirable because funds set aside to cover the VAR are not available for other uses.
A serious drawback to this technique, however, is that the noise components ε used to vary the risk factor values are generally assumed to have a normal distribution.
Another problem with parametric models is that the model must expressly model cross-correlations between various risk factors.
Detecting these variations and compensating for them through the use of multiple variance-covariance matrices is difficult and can greatly complicate the modeling process.
In addition, the computational cost of determining the cross-correlations grows quadratically with the number of risk factors.
It is not unusual for large derivative portfolios to depend on 1000 or more risk factors and determining the cross-correlations for the risk factors quickly becomes unmanageable, particularly when the simulation process must be run daily.
However, this method is limited because the statistical distribution of values is restricted to the specific historical sequence which occurred.
In addition, historical data may be missing or non-existent, particularly for newly developed risk factors, and the historical simulation is generally not risk neutral.

Method used


Image

  • Method and system for simulating risk factors in parametric models using risk neutral historical bootstrapping
  • Method and system for simulating risk factors in parametric models using risk neutral historical bootstrapping
  • Method and system for simulating risk factors in parametric models using risk neutral historical bootstrapping

Examples


Embodiment Construction

:

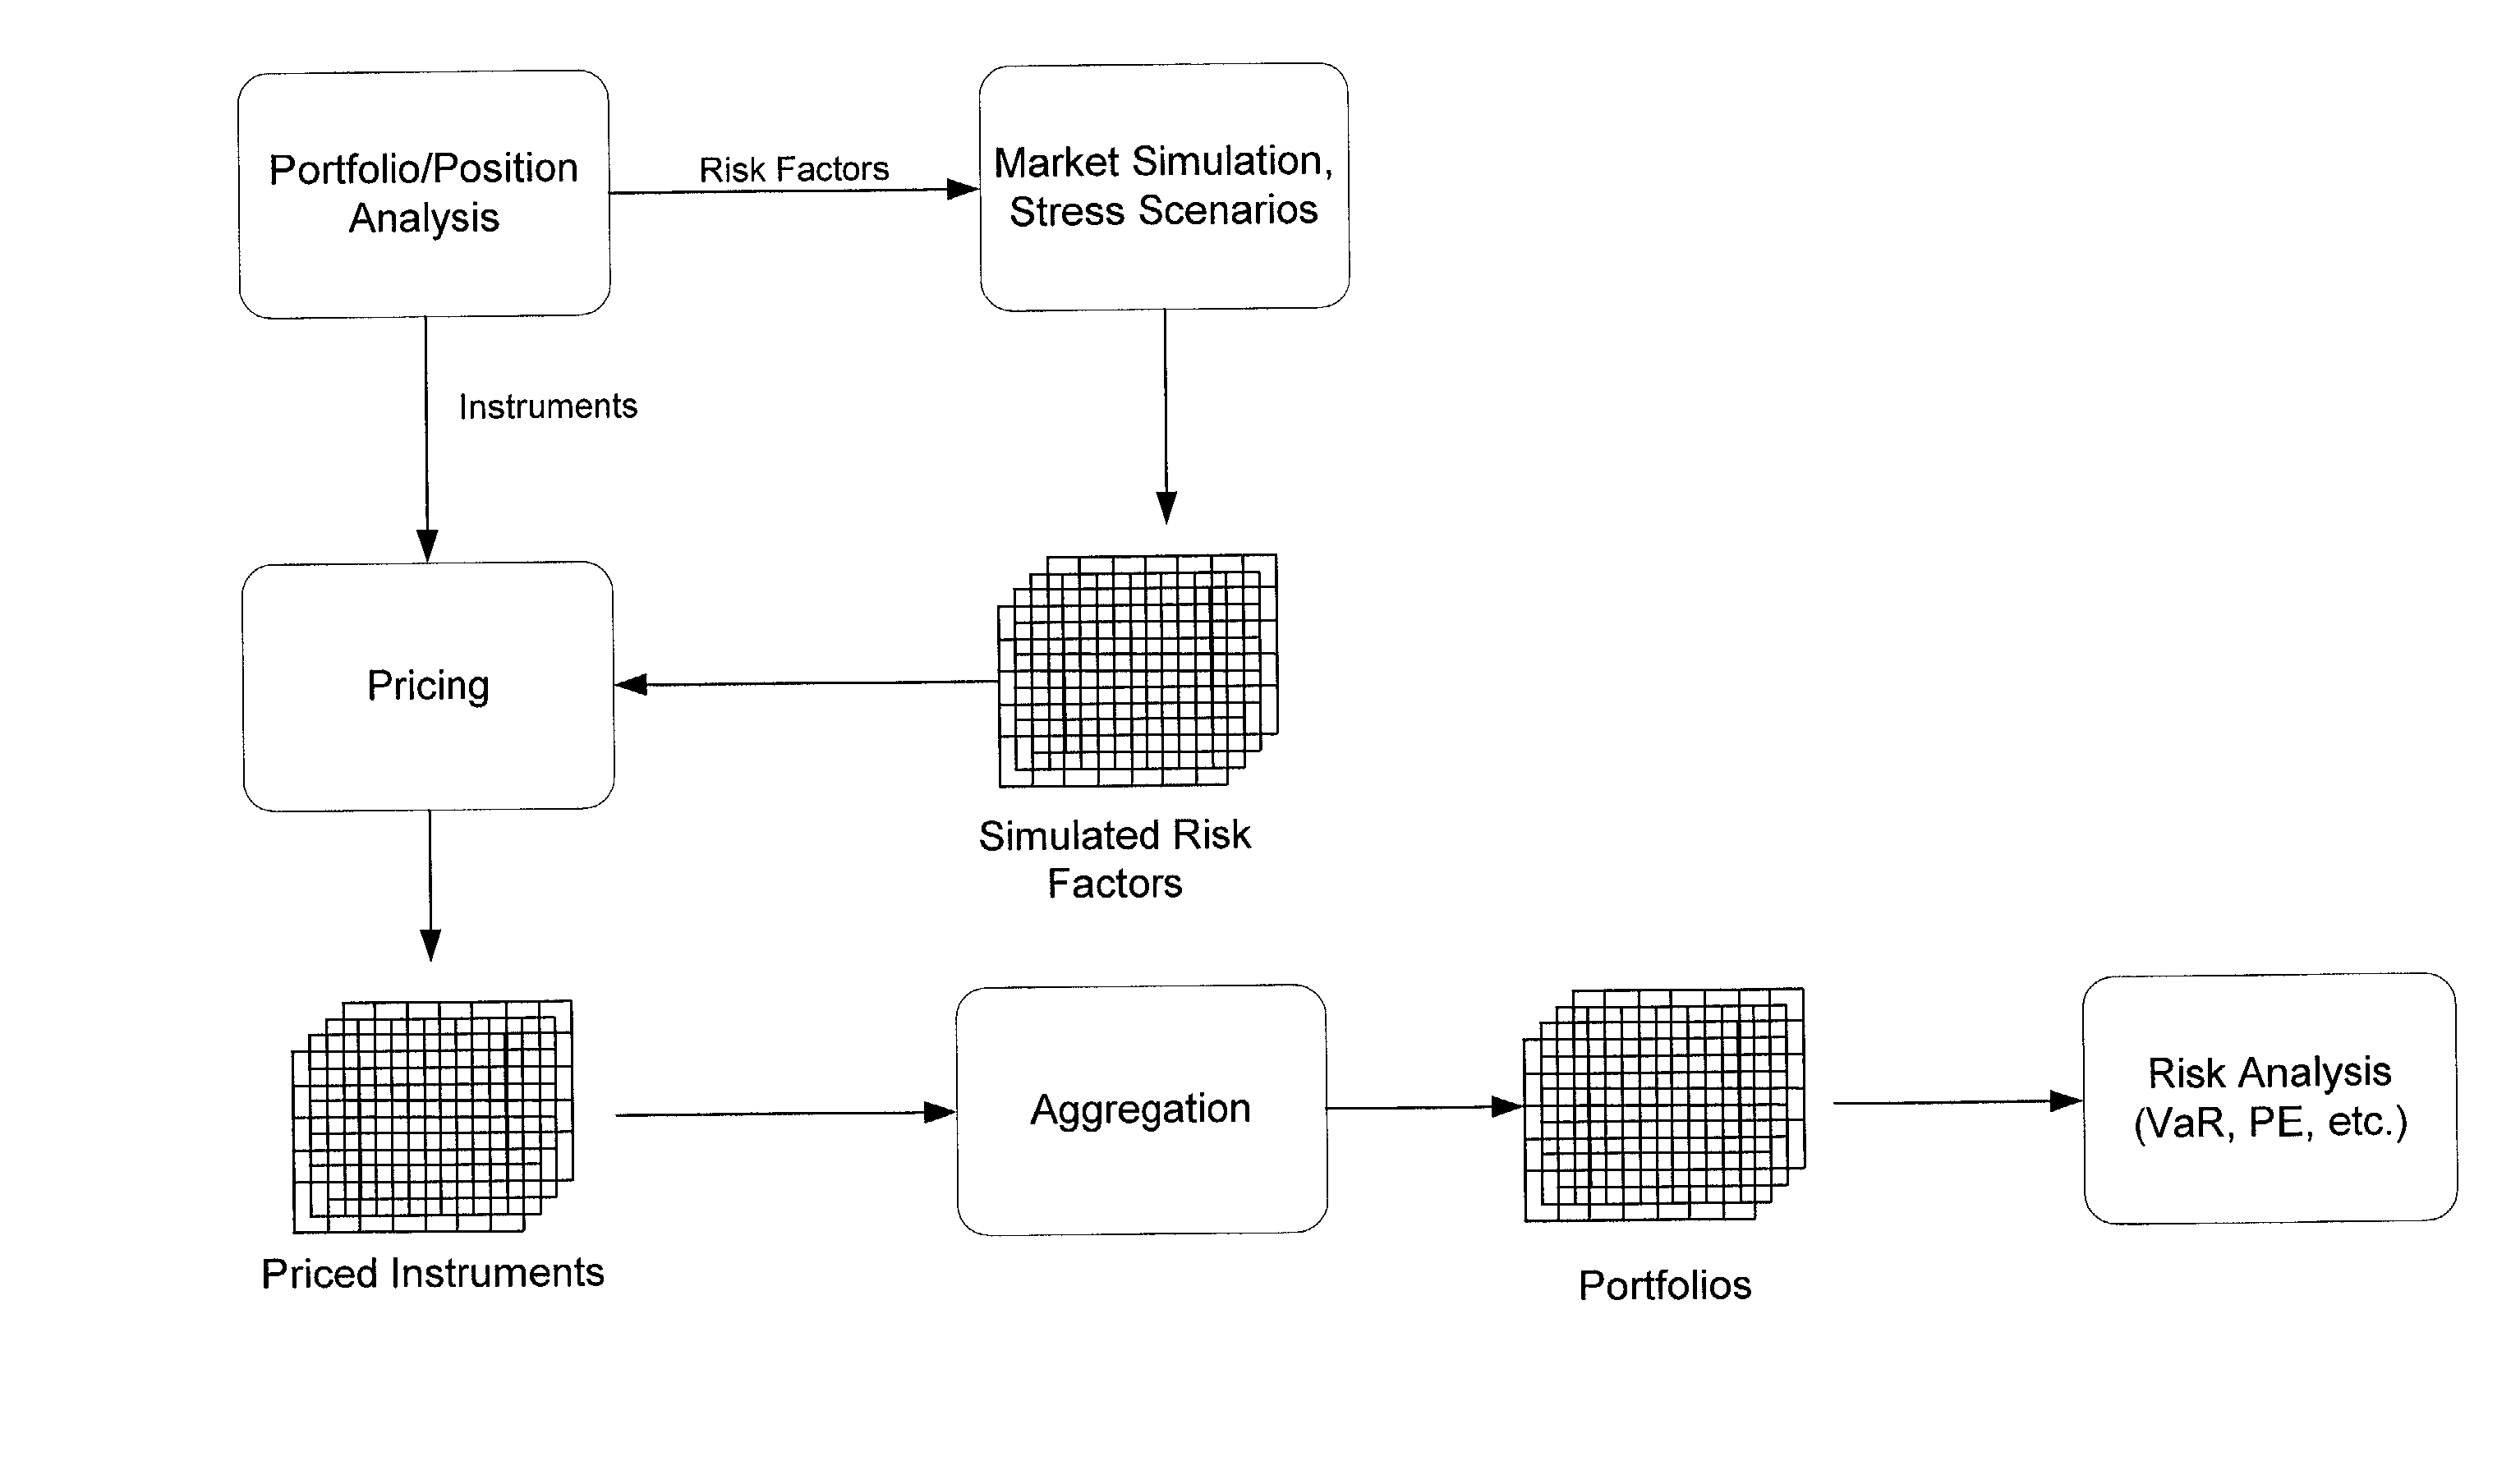
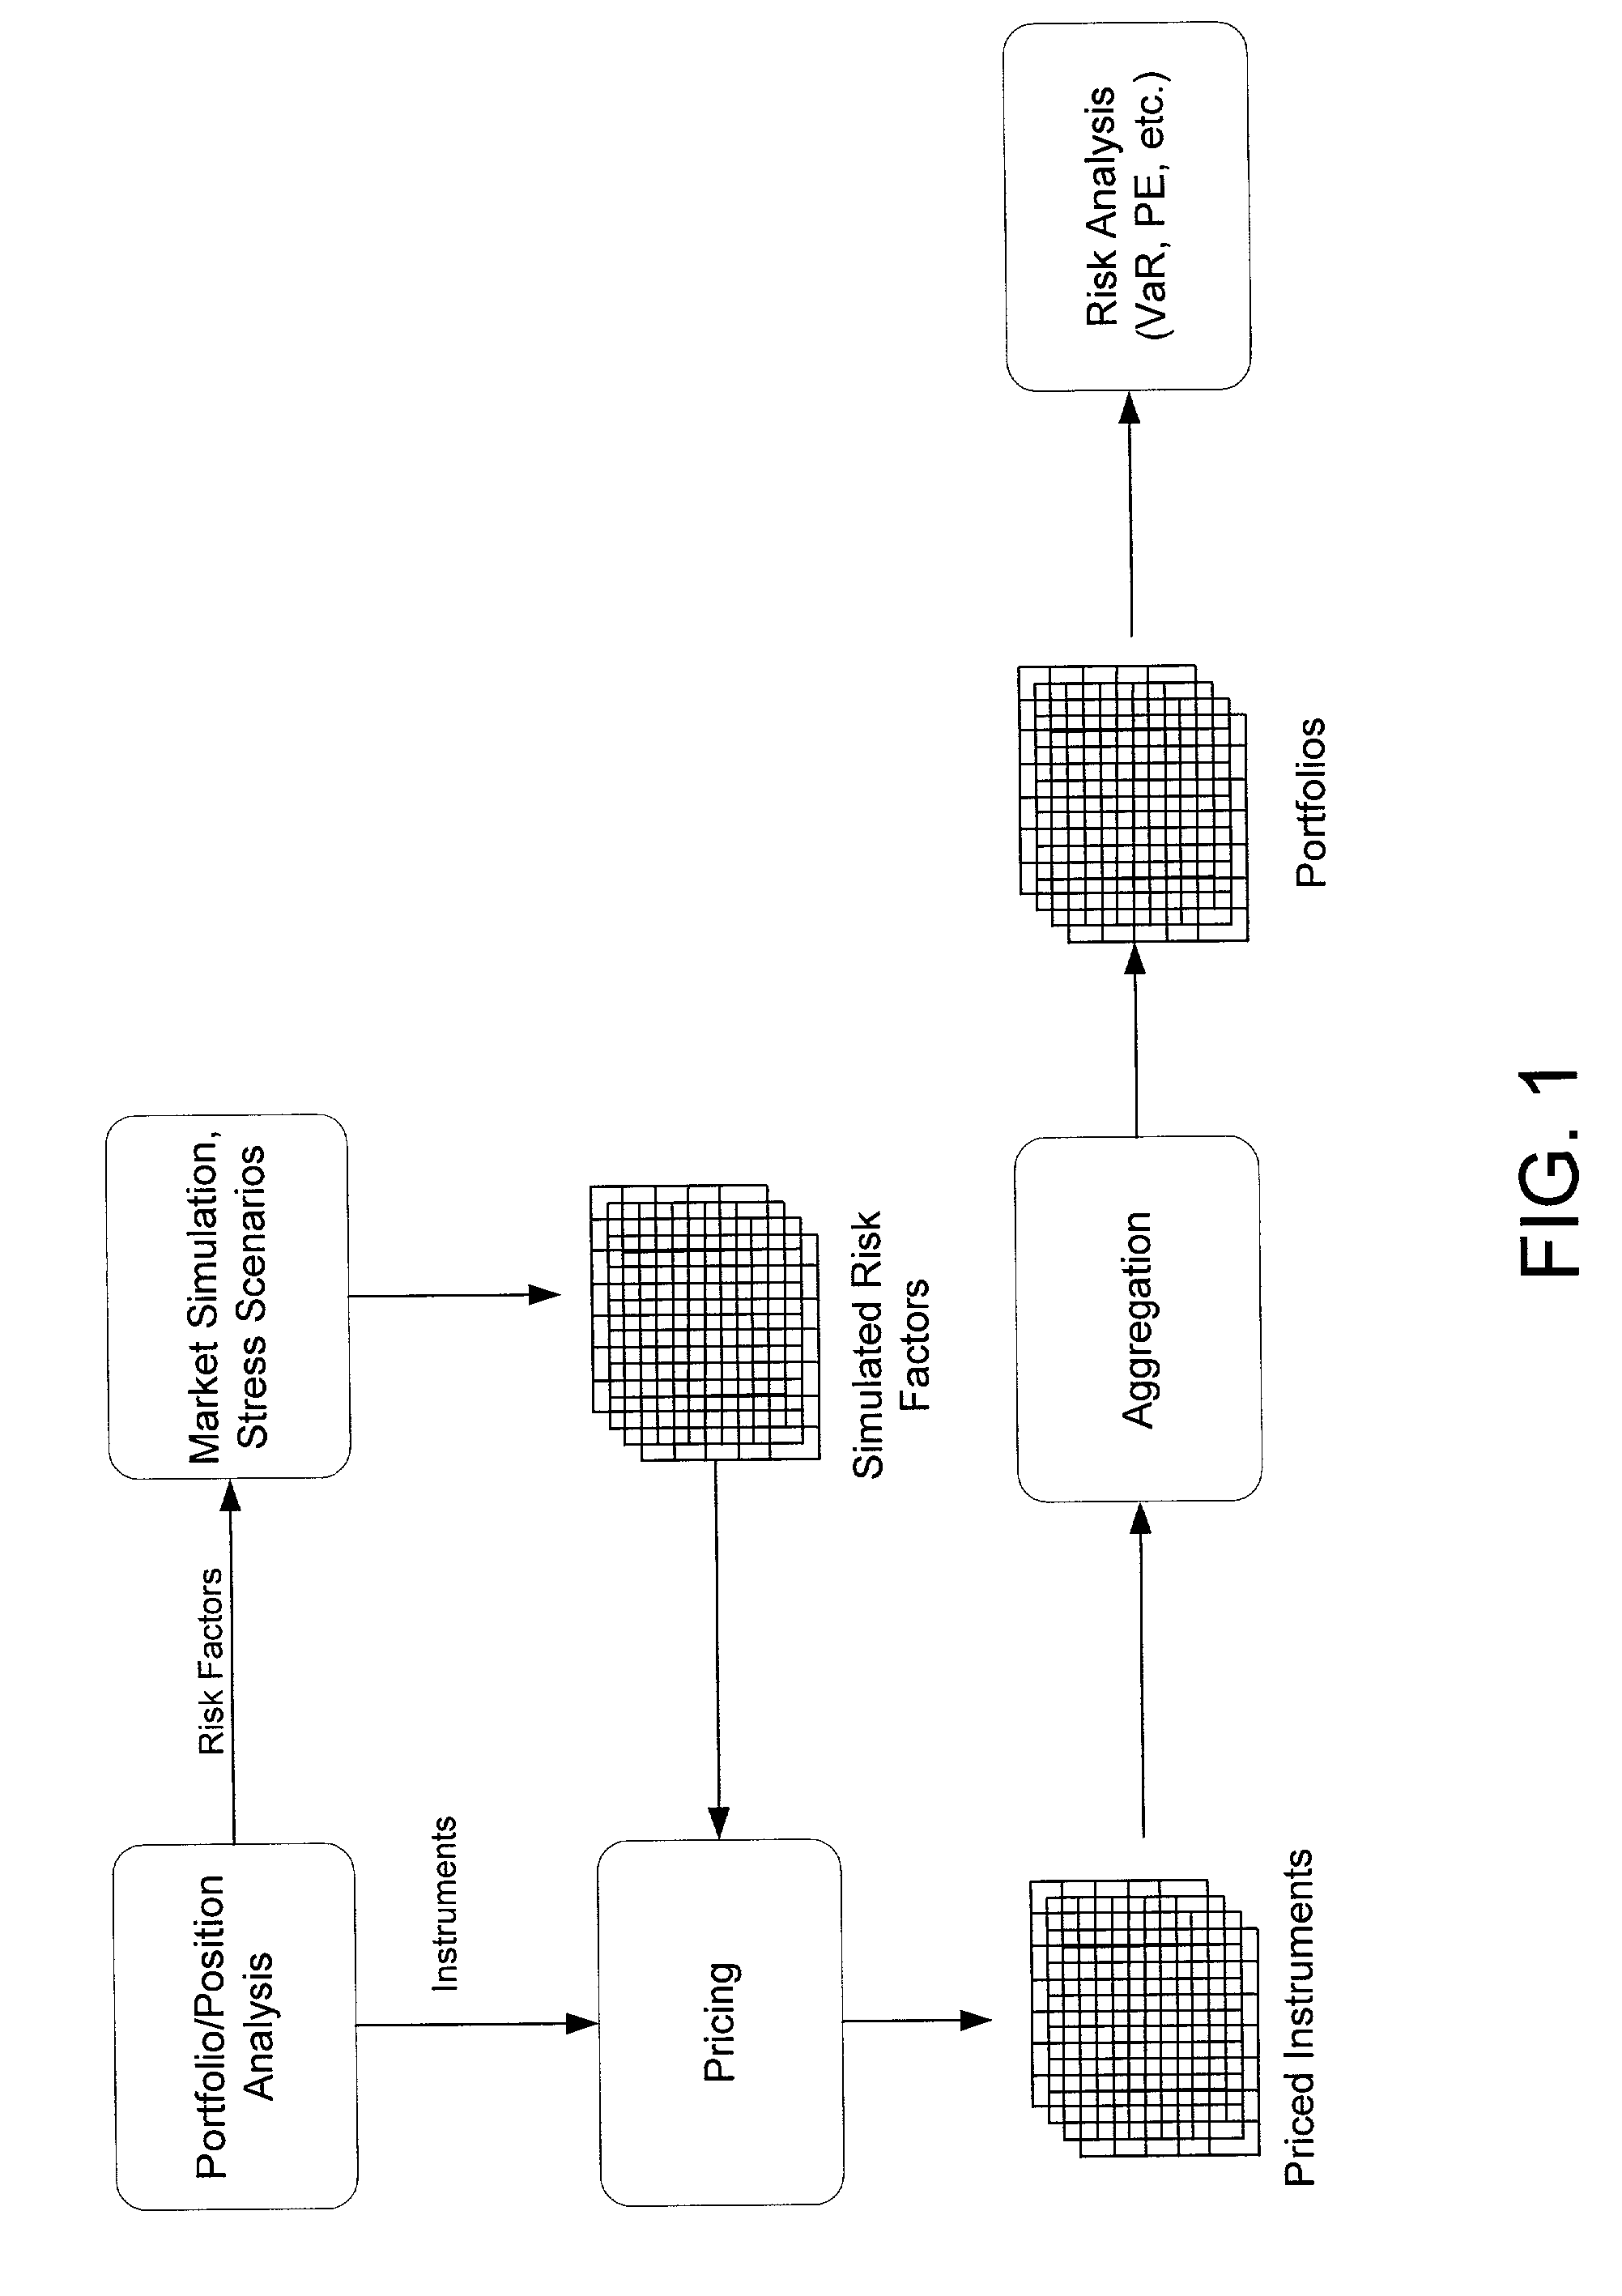
[0018]Turning to FIG. 1, there is shown a general flow diagram of a system for evaluating an integrated risk in a portfolio. Initially, the portfolio or position at interest is analyzed to determine the appropriate risk factors to apply. The risk factors are simulated using a market simulation model or other stress scenarios to produce sets of simulated risk factors for the time period of interest. The simulated risk factors are applied to pricing models for the various instruments in the portfolio and a set simulated prices for each of the instruments is generated. The simulated values for the priced instruments are then aggregated to produce a set of simulated prices for the portfolio. These prices can then be analyzed to evaluate various risk measures, such as VAR.

[0019]According to the invention, a risk neutral bootstrap method is used to generate a set of historical residuals for a given factor in a parametric model based. The residuals are determined by calculating the value ...


PUM


Abstract

An improved method for simulating noise-varying risk factor values in a parametric simulation comprises analyzing historical data to determine the actual value of the risk factors and other attributes in the model and using this data to generate historical residual values which reproduces the historical price when used in the model with corresponding historical attribute values. The set of historical residual values is standardized and can be bootstrapped to increase the number of members in the set or vary the sets properties. Values of the historical residuals are then selected, e.g., at random, and used in place of the random noise components to produce simulated risk factor values which are used in the parametric model to simulate the evolution of the instrument price.

Description

FIELD OF THE INVENTION[0001]This invention is related to a method and system for measuring market and credit risk and, more particularly, to an improved method for the simulation of risk factors in parametric models for use in making value at risk and other risk evaluations.BACKGROUND[0002]A significant consideration which must be faced by financial institutions (and individual investors) is the potential risk of future losses which is inherent in a given financial position, such as a portfolio. There are various ways for measuring potential future risk which are used under different circumstances. One commonly accepted measure of risk is the value at risk (“VAR”) of a particular financial portfolio. The VAR of a portfolio indicates the portfolio's market risk at a given percentile. In other words, the VAR is the greatest possible loss that the institution may expect in the portfolio in question with a certain given degree of probability during a certain future period of time. For e...

Claims


Application Information

Patent Timeline
Patent Type & Authority Patents(United States)
IPC IPC(8): G06Q40/00
CPCG06Q40/00G06Q40/025G06Q40/04G06Q40/06G06Q40/03
Inventor BROWNE, SIDMAGHAKIAN, ARTHUR
Owner GOLDMAN SACHS & CO LLC
Why Eureka
Try Eureka