Visualization of S transform data using principal-component analysis

a transform data and principal component analysis technology, applied in the field of visualizing transform data, can solve the problems of reducing the usefulness of both gt and wt in the analysis of imaging signal data, unable to interpret time-scale representation of a signal, and not providing sufficient information in standard fourier analysis, so as to achieve better capture local spectral information

Active Publication Date: 2008-01-15
CALGARY SCIENTIFIC INC
View PDF3 Cites 4 Cited by
  • Summary
  • Abstract
  • Description
  • Claims
  • Application Information

AI Technical Summary

Benefits of technology

[0014]It is, therefore, an object of the invention to provide a method for visualiz

Problems solved by technology

However, in many situations of frequencies changing over time or space the standard Fourier analysis does not provide sufficient information.
Both of these methods unfold the time information by localizing the signal in time and calculating its “instantaneous frequencies.” However, both the GT and the WT have limitations substantially reducing their usefulness in the analysis of imaging signal data.
Therefore, the time-scale representation of a signal is difficult if not impossible to interpret.
Therefore, visualization of 2D ST results is a difficult task requiring substantially large computer storage capability and

Method used


Image

  • Visualization of S transform data using principal-component analysis
  • Visualization of S transform data using principal-component analysis
  • Visualization of S transform data using principal-component analysis

Examples


Embodiment Construction

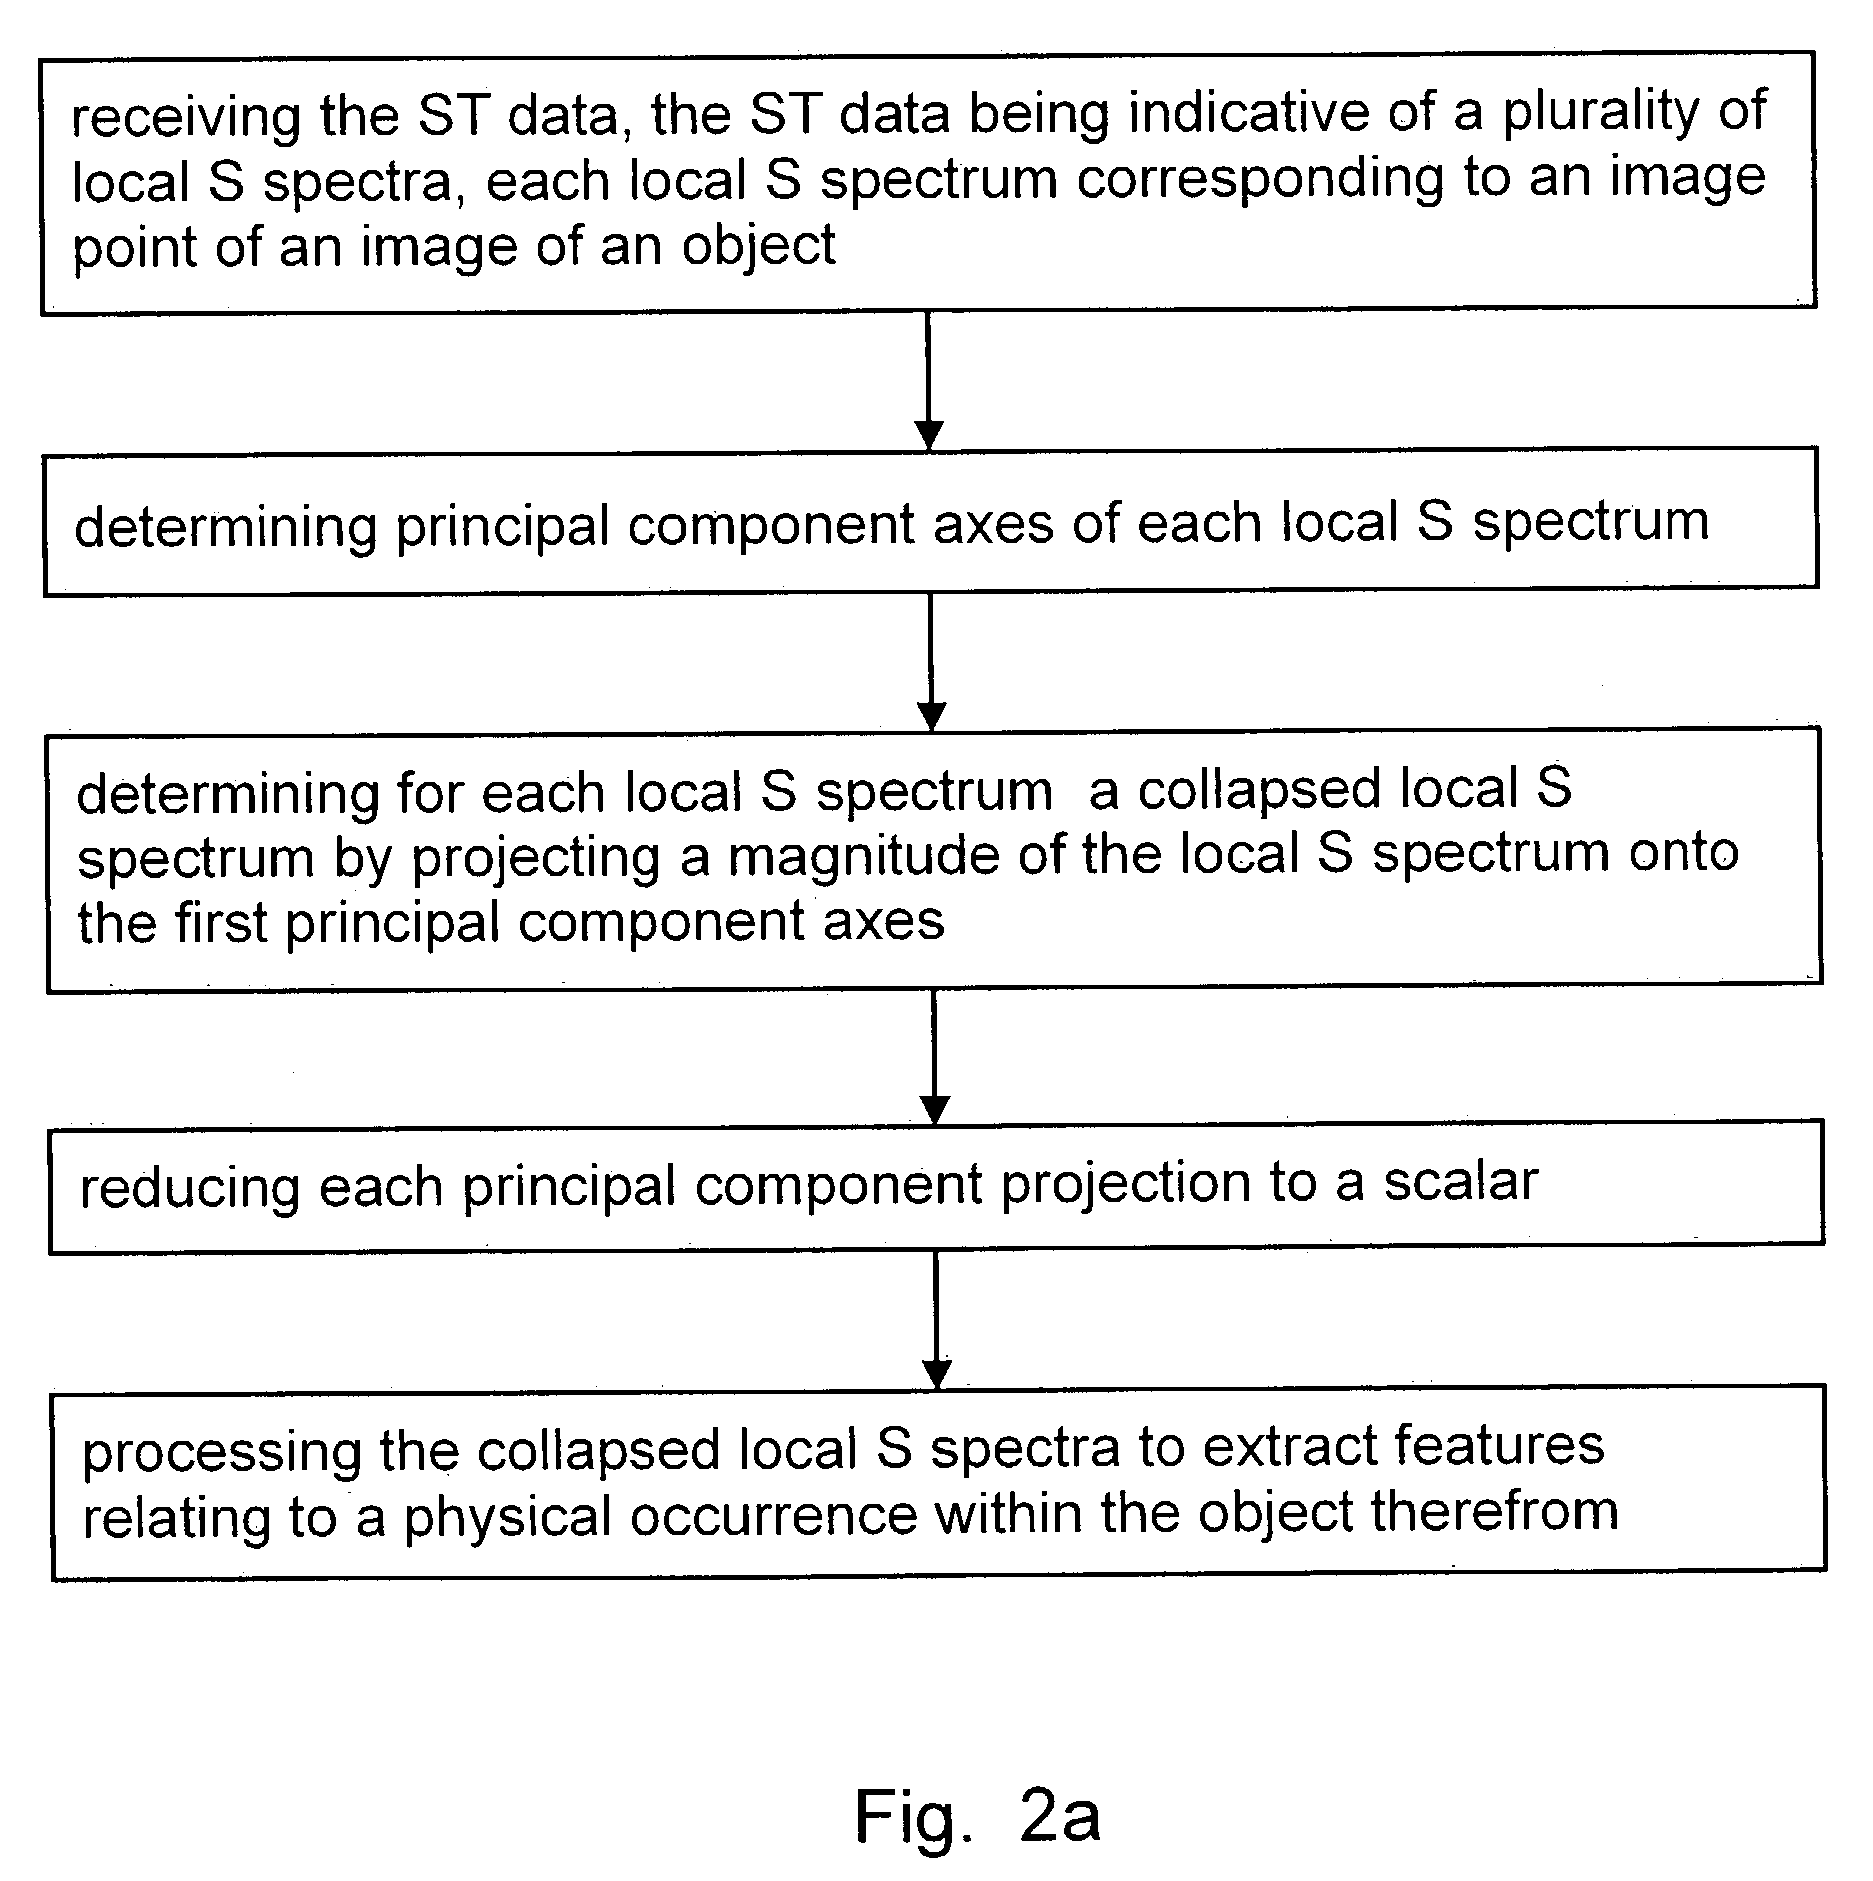
[0030]Hereinbelow, the method for visualizing ST data according to the invention is disclosed describing processing of ST data of 2D images. It is evident to those of skill in the art based on the explanation below that the method for visualizing ST data according to the invention is not limited thereto but is also applicable for the processing of higher dimensional image data such as 3D images or time varying 3D images resulting in 4D image data. Furthermore, the method for visualizing ST data according to the invention provides means for directly visualizing local frequency content of other 2D data such as 1D spatial series evolving over time, where the local frequency content is calculated using the S transform or other localized transforms such as Gabor or Wavelet transforms.

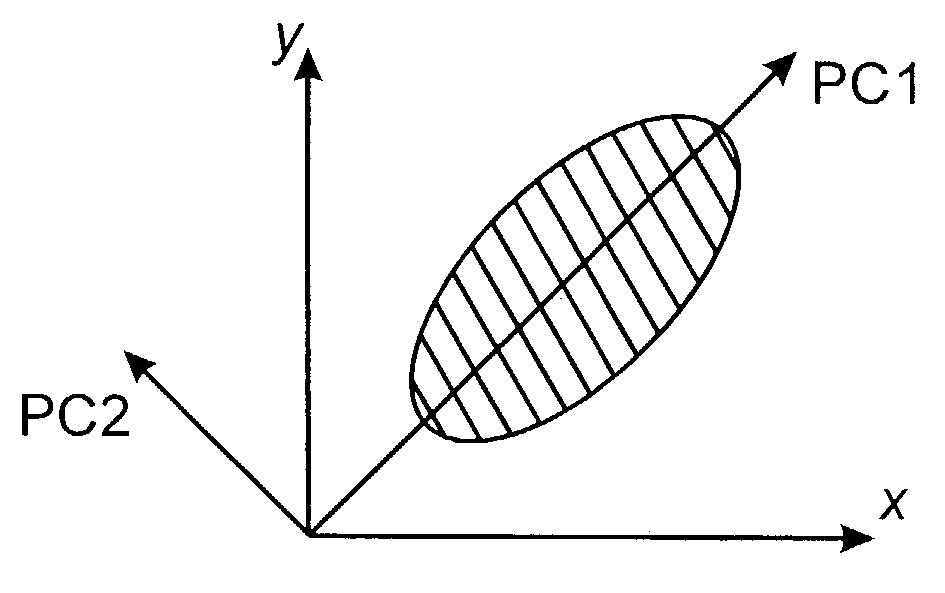
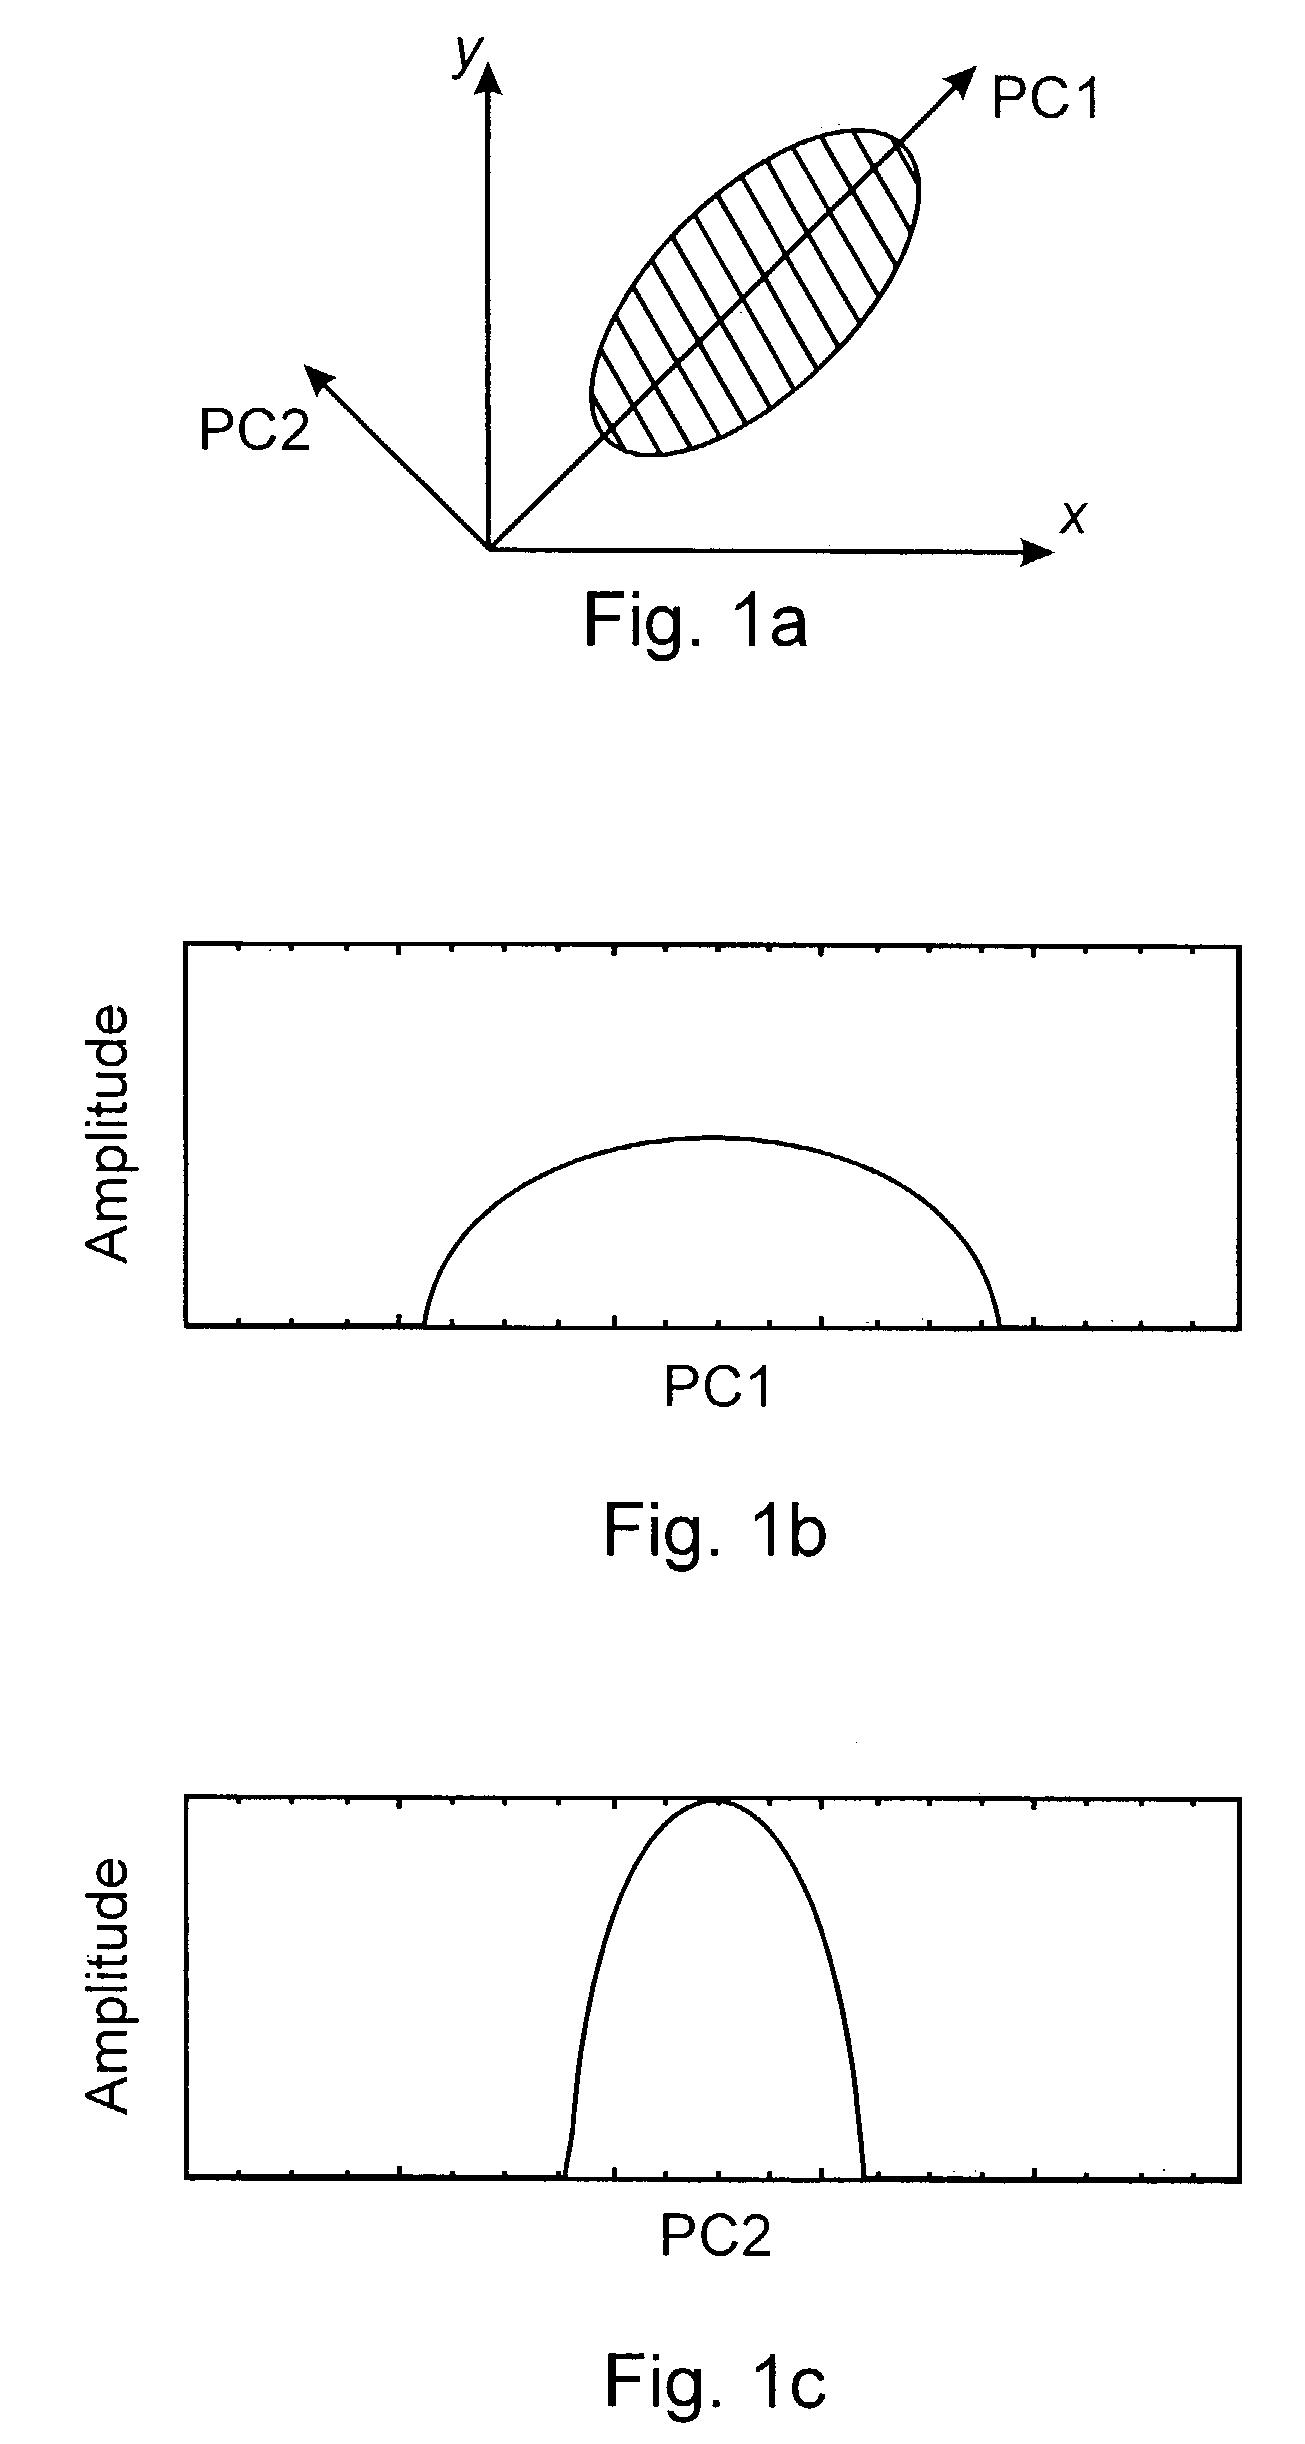
[0031]The method for visualizing ST data according to the invention is based upon principal-component analysis (PCA) of a local spectrum. The PCA aligns a 2D data set or image with its principal eigenvectors...


PUM


Abstract

The present invention relates to a method for visualizing ST data based on principal component analysis. ST data indicative of a plurality of local S spectra, each local S spectrum corresponding to an image point of an image of an object are received. In a first step principal component axes of each local S spectrum are determined. This step is followed by the determination of a collapsed local S spectrum by projecting a magnitude of the local S spectrum onto at least one of its principal component axes, thus reducing the dimensionality of the S spectrum. After determining a weight function capable of distinguishing frequency components within a frequency band a texture map for display is generated by calculating a scalar value from each principal component of the collapsed S spectrum using the weight function and assigning the scalar value to a corresponding position with respect to the image. The visualization method according to the invention is a highly beneficial tool for image analysis substantially retaining local frequency information but not requiring prior knowledge of frequency content of an image. Employment of the visualization method according to the invention is highly beneficial, for example, for motion artifact suppression in MRI image data, texture analysis and disease specific tissue segmentation.

Description

[0001]This application claims benefit from U.S. Provisional Application No. 60 / 378,962 filed May 10, 2002.FIELD OF THE INVENTION[0002]This invention relates to visualization of S transform data and in particular to a new method for processing S transform data based on principal-component analysis.BACKGROUND OF THE INVENTION[0003]The Fourier transform of a function ƒ(t) has served as the most important transform in numerous signal processing applications. For example, the Fourier transform is widely used in imaging analysis such as CT and Magnetic Resonance Imaging (MRI).[0004]Standard Fourier analysis reveals individual frequency components involved in a signal or image. However, in many situations of frequencies changing over time or space the standard Fourier analysis does not provide sufficient information. In numerous applications processing of non-stationary signals or images reveals important information. For example, in MRI signal processing motion caused by respiratory activ...

Claims


Application Information

Patent Timeline
IPC IPC(8): G06K9/34G06F19/00G06K9/00G06K9/62
CPCG06K9/00523G06K9/6253G06F2218/08G06F18/40
Inventor MITCHELL, J. ROSSFONG, T. CHENZHU, HONGMEI
Owner CALGARY SCIENTIFIC INC
Why Eureka
Try Eureka