Quantification of disease progression by means of interpolation between parameters based on electromagnetic spectra

a technology of interpolation and measurement parameters, applied in the field of analytical methods, can solve the problems of disease diagnosis, difficult diagnosis of individual diseases, and inability to allocate unknown samples whose measured parameters are in the intersection range of the two data records, so as to simplify the generation of interpolation data records, accurately image and track

Inactive Publication Date: 2008-05-06
ROCHE DIAGNOSTICS OPERATIONS INC
View PDF18 Cites 17 Cited by
  • Summary
  • Abstract
  • Description
  • Claims
  • Application Information

AI Technical Summary

Benefits of technology

[0042]Before being used according to the present invention, the multivariate analytical methods must be trained for the area of use. This is usually done through a number of training runs in which infrared spectra of a plurality of samples of known classifications are input into the analytical method. Likewise, the analytical method is notified of the type of classification of the individual samples. In the aforementioned training run, the analytical algorithm automatically selects parameters that ensure a reliable allocation of samples to the specified classes. The parameters obtained in this way can be used in the remaining course to calculate the interpolated data record. It does not matter according to the present invention whether an interpolation is performed among the parameters directly or whether an interpolation is first performed between the spectral data before the parameters are generated. However, it is found that determining the parameters first and then performing the interpolation among the parameters greatly simplifies generation of the interpolated data record.
[0043]As a rule, the analytical system may include a plurality of different classes between which an interpolation can be performed according to this invention. The inventive method makes it possible to reflect the course of a disease by interpolation between data and thus also accurately image and track intermediate stages of a disease syndrome. With the help of the inventive method, the sample is classified in different curves for different disease courses which would have previously required a plurality of separate analytical processes using the methods available in the past. Classes that fall in the range of internal diseases are particularly important for the clinical analysis. For example it is possible with inventive methods to generate curves for disease courses that make it possible to predict whether or not a patient has a liver disease or a kidney disease. The classification of an unknown sample described here is not equivalent to an unambiguous diagnosis, however, because the same spectral changes in a sample may under some circumstances be caused by different diseases or dysfunctions. Instead, the said classification of the sample constitutes a screening method with which it is possible to decide which diseases the sample is to be tested for by using traditional methods. This eliminates the need for a plurality of analytical tests that would normally be necessary, e.g., for admission testing in a clinical laboratory.
[0044]In addition, the inventive method permits early detection of diseases that could not be performed under some circumstances by using traditional methods.

Problems solved by technology

Frequently, however, it is found that diagnosing individual diseases is particularly difficult because the substances to be analyzed for the disease cannot be determined unambiguously or are even unknown.
An allocation of unknown samples whose measured parameters are in this intersection range of the two data records is therefore impossible.
However, such a large data record also includes the allocation of samples that have been incorrectly allocated to this class so that a sensitive allocation will have a low specificity accordingly.
Consequently, one disadvantage of the prior art is that a disease can be diagnosed only with respect to different classes (e.g., “healthy” or “sick”), without being able to take into account data within the intersection, for example.
It is thus impossible to take into account a real course of a disease having stages of the disease.
Especially in the case of biological samples in which the water content is frequently very high, infrared measurements often lead to falsified analytical results because there is a strong absorption band of water in the middle infrared range.
The classification of an unknown sample described here is not equivalent to an unambiguous diagnosis, however, because the same spectral changes in a sample may under some circumstances be caused by different diseases or dysfunctions.
In addition, the inventive method permits early detection of diseases that could not be performed under some circumstances by using traditional methods.

Method used


Image

  • Quantification of disease progression by means of interpolation between parameters based on electromagnetic spectra
  • Quantification of disease progression by means of interpolation between parameters based on electromagnetic spectra
  • Quantification of disease progression by means of interpolation between parameters based on electromagnetic spectra

Examples


Embodiment Construction

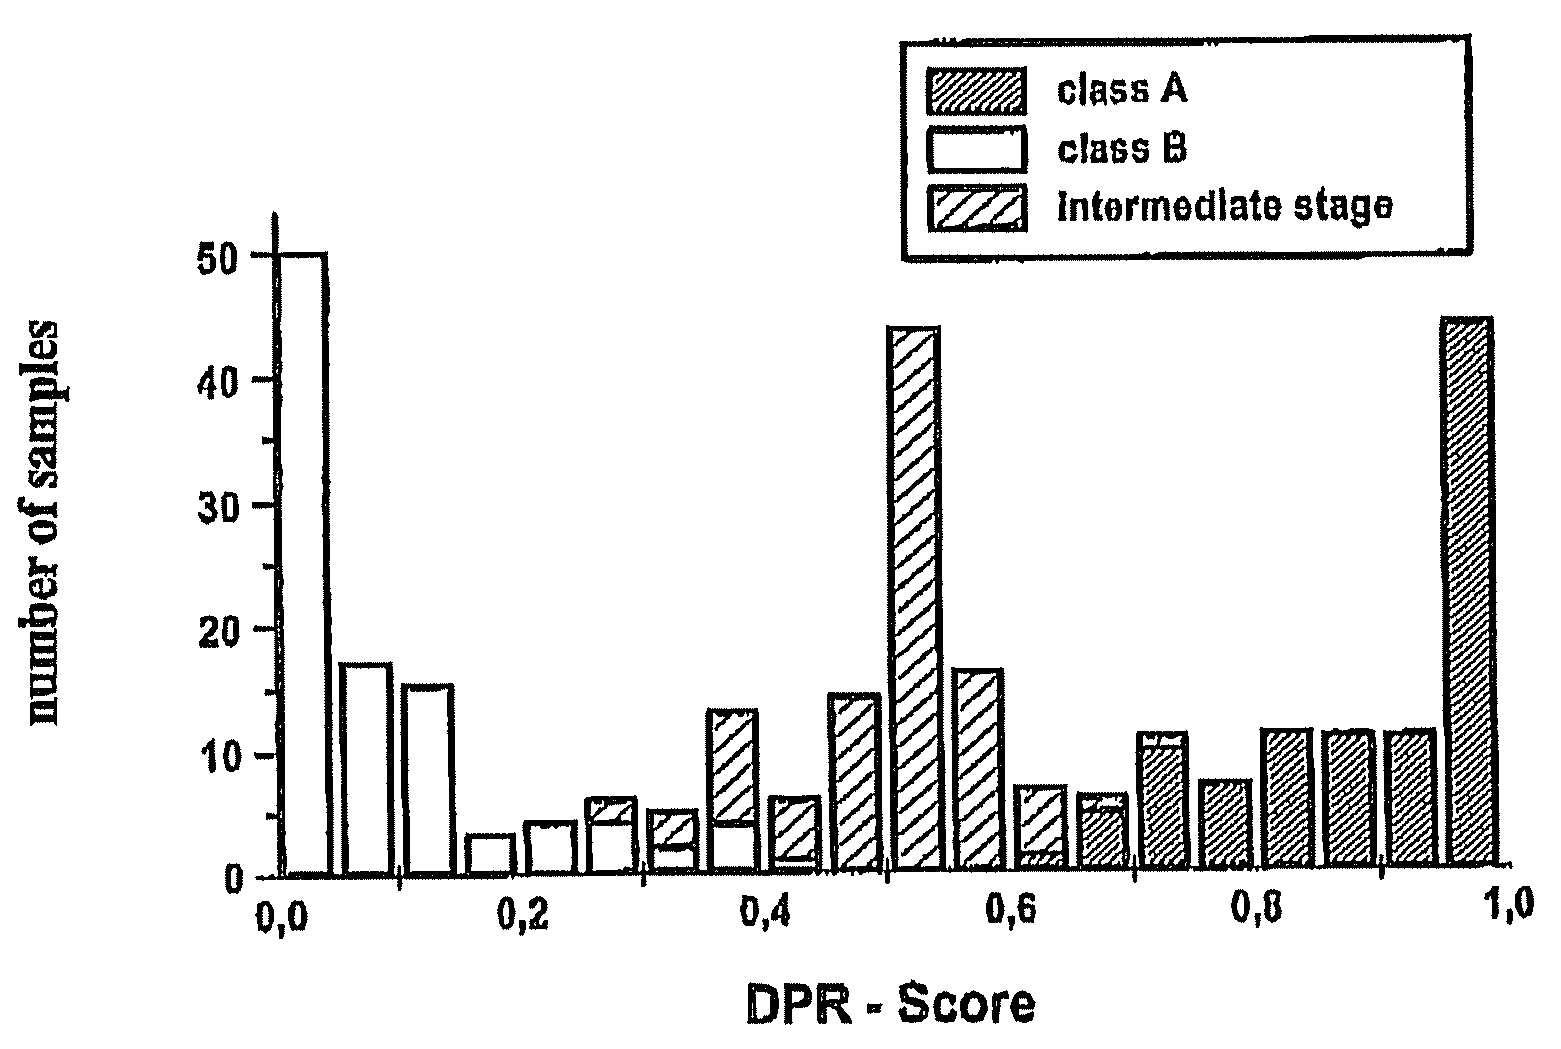
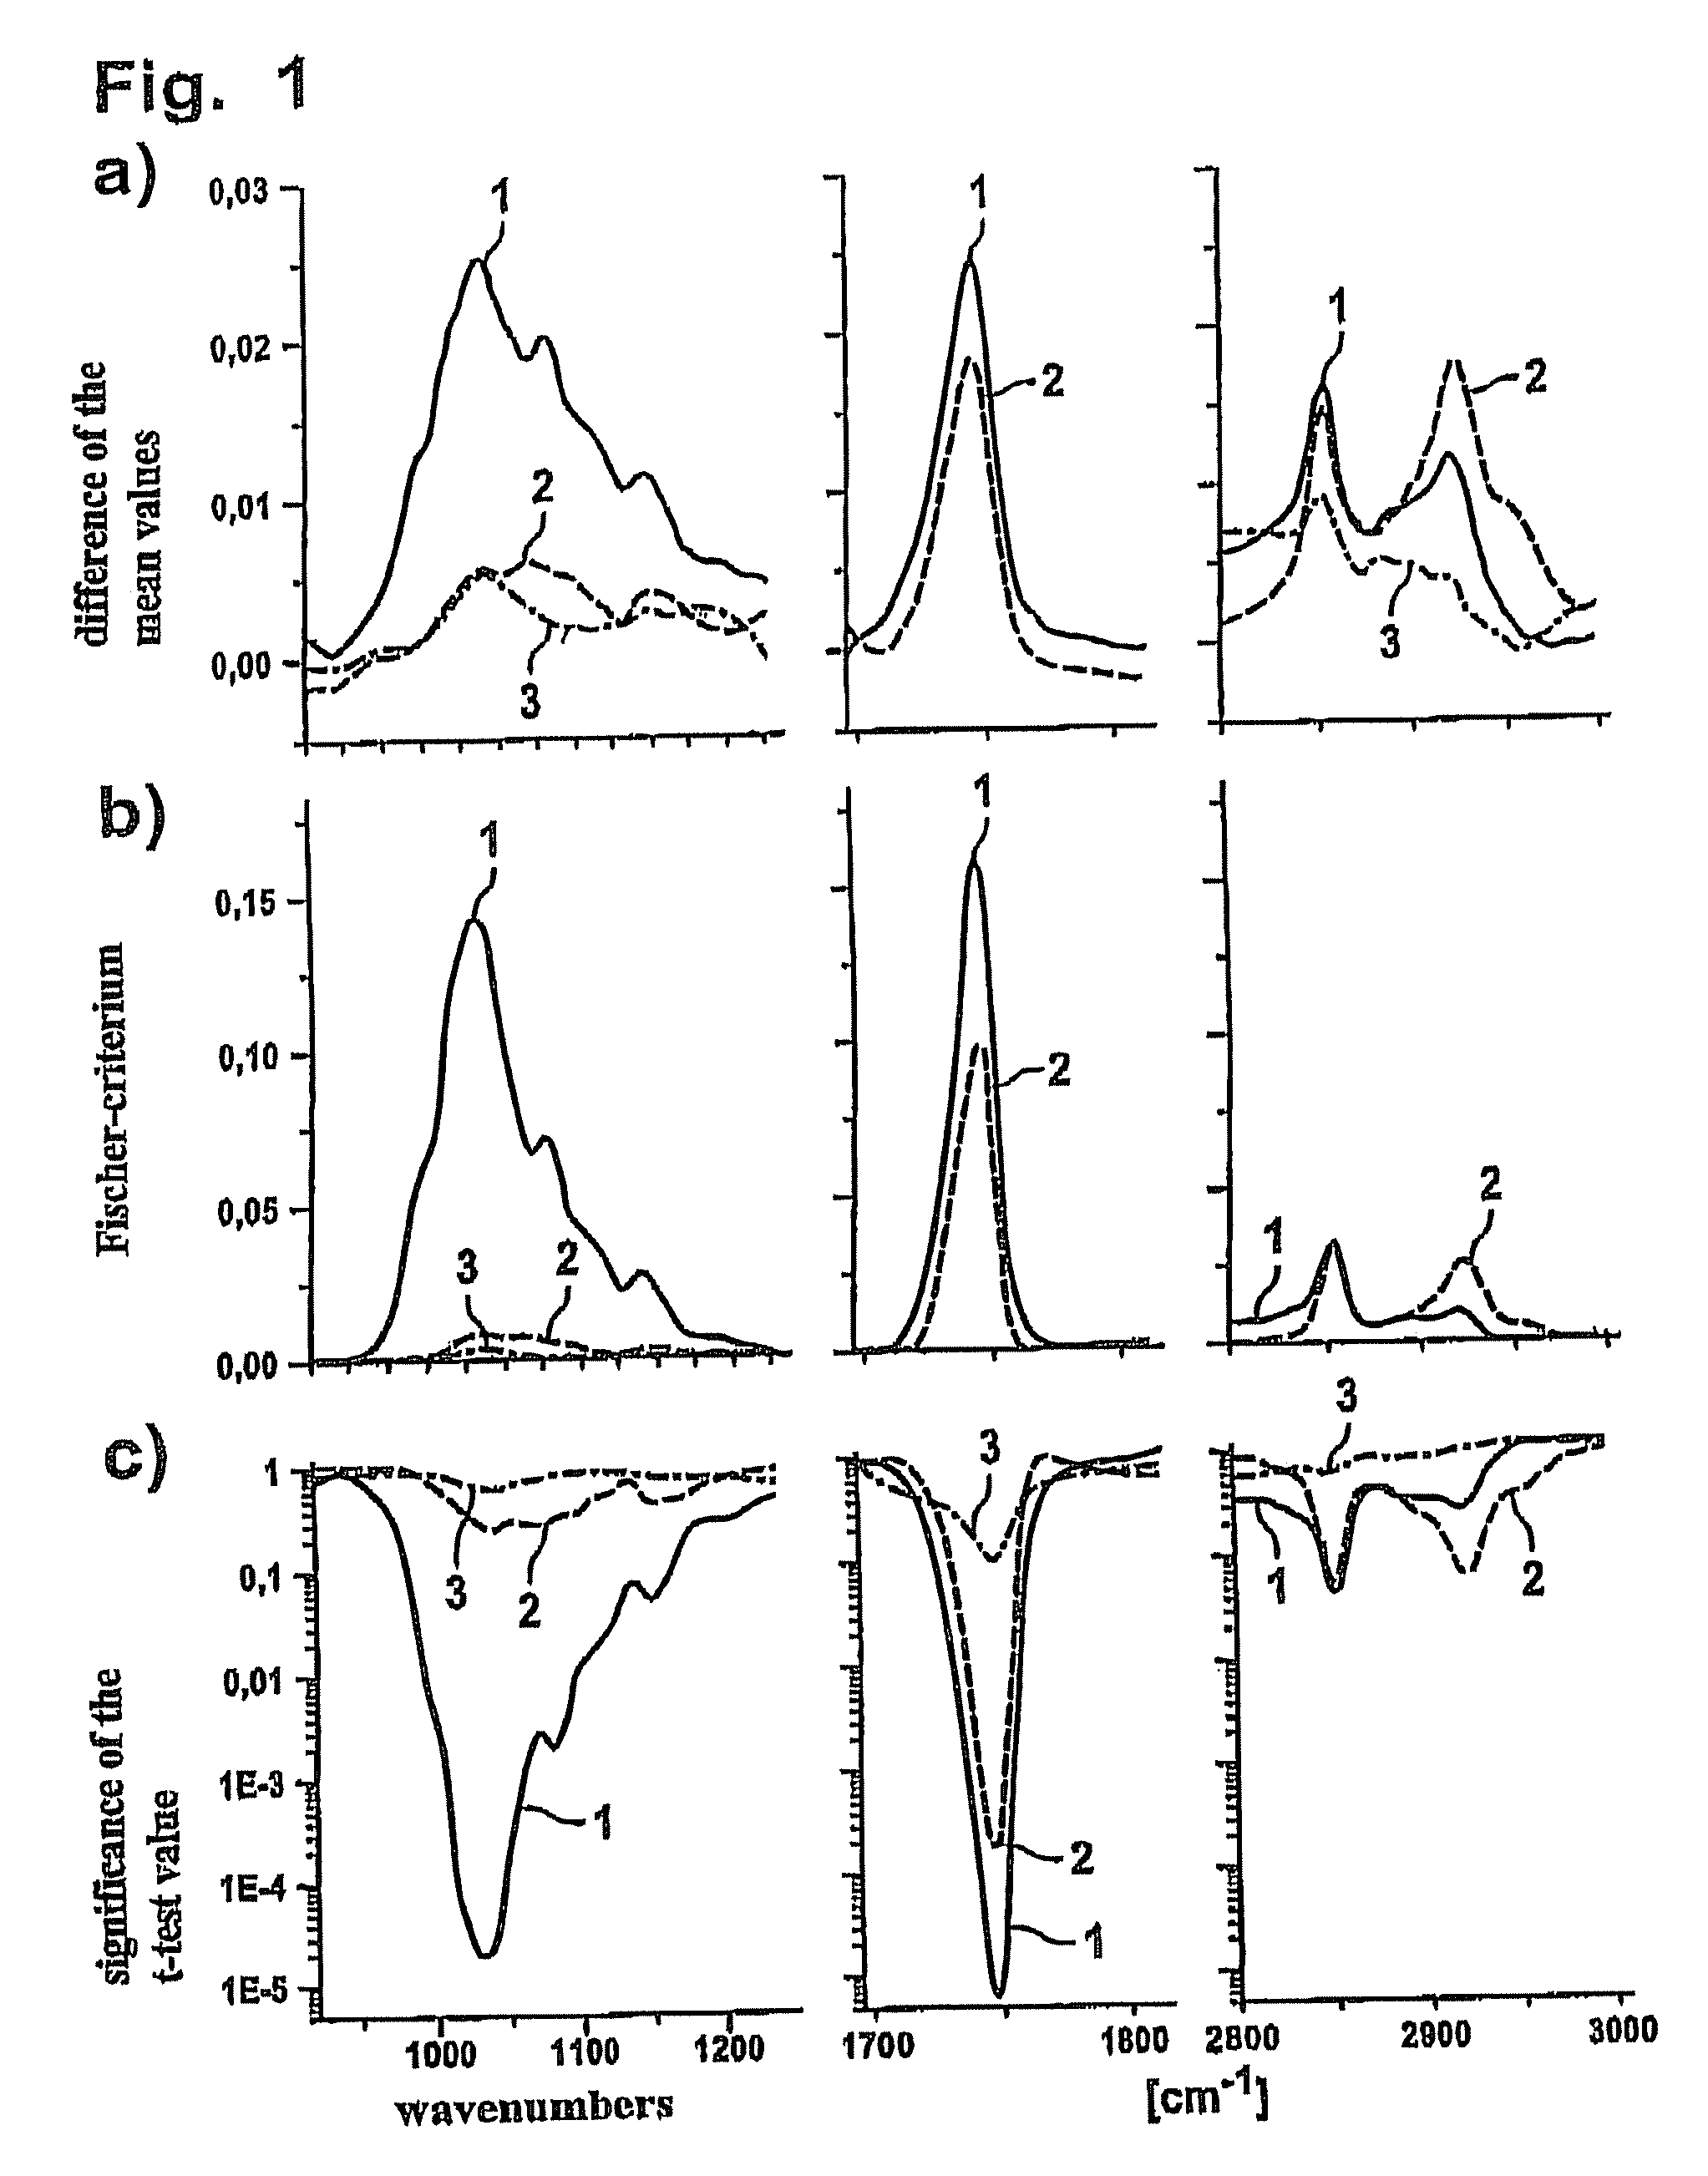
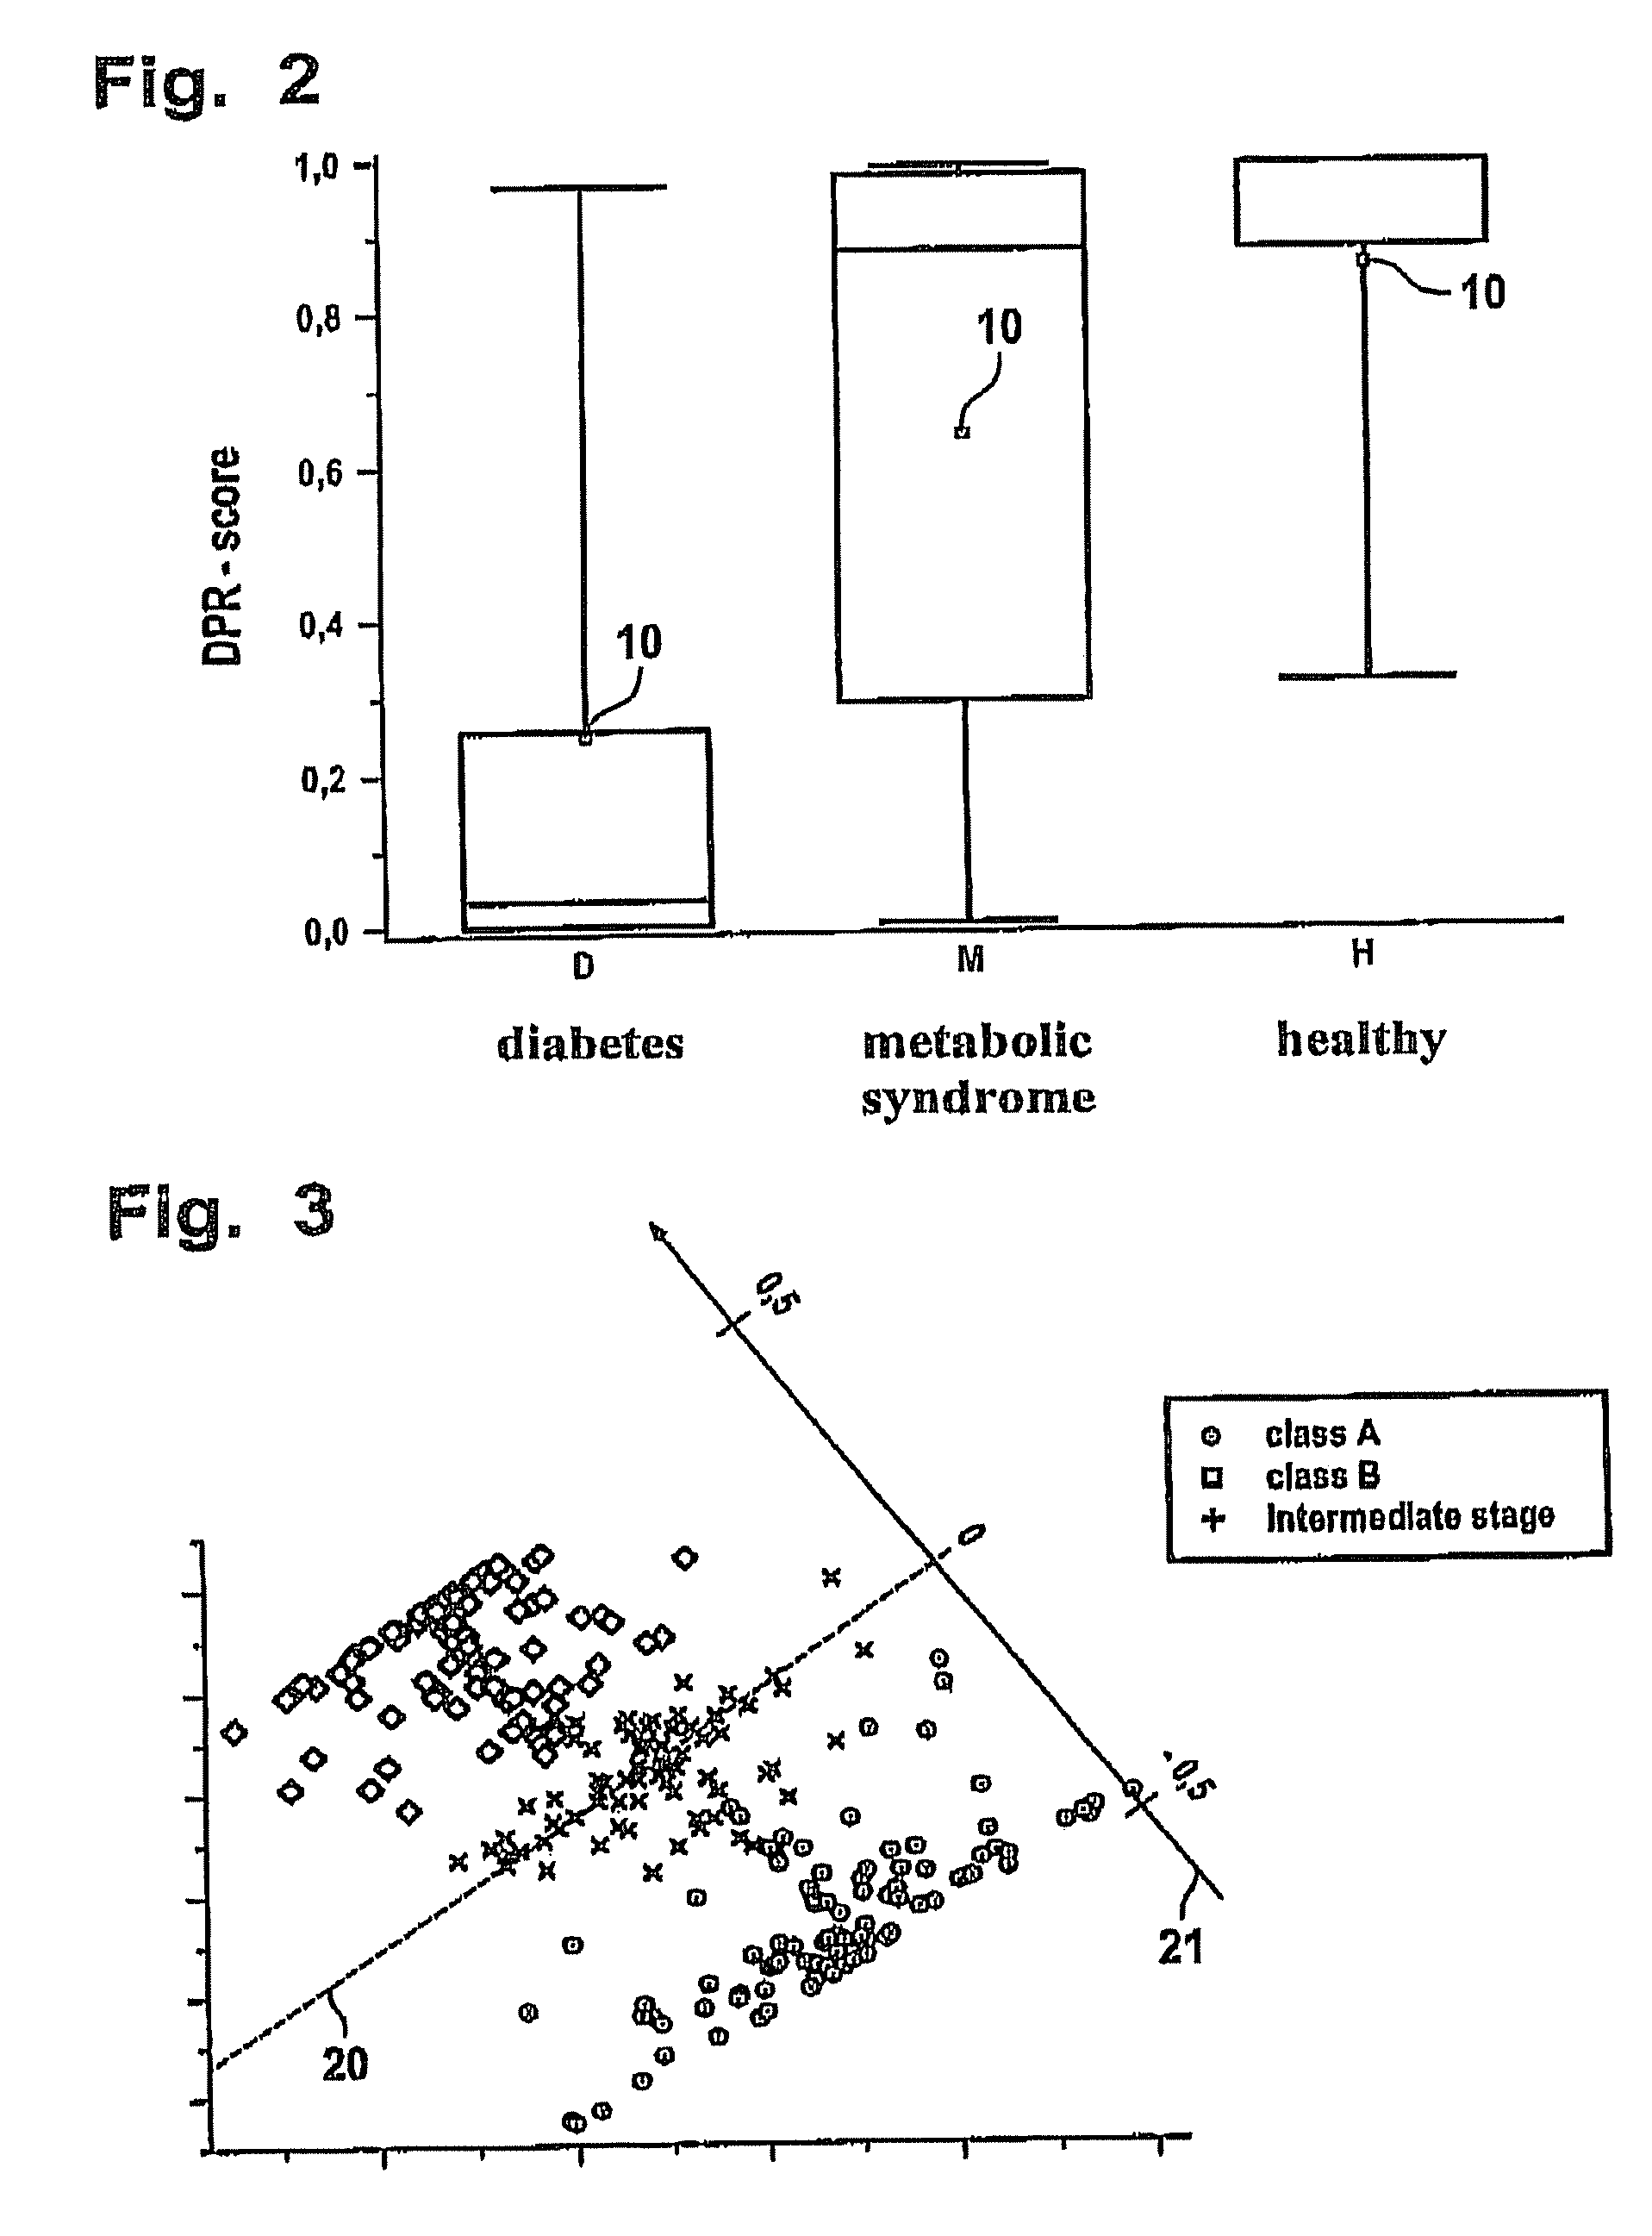
[0059]FIG. 1 shows various analyses of spectral data generated in performing measurements on samples of a healthy person, a patient with metabolic syndrome and a diabetic. The corresponding samples and the classes in this regard are referred to below for the sake of simplicity as healthy, metabolic syndrome and diabetes.

[0060]FIGS. 1a through 1c each show characteristic wavenumber ranges between 900 cm−1 and 1,200, 1,700 to 1,800 cm−1 and 2,800 to 3,000 cm−1. Curve 1 in FIG. 1 shows the difference between the data from a healthy person and a diabetic, while curve 2 shows the difference between data from a healthy subject and a patient with metabolic syndrome. Curve 3 illustrates the differences in spectra that are obtained between the data from two healthy subjects generated by random differences.

[0061]FIG. 1a shows the particular curve in the aforementioned wavenumber ranges, each derived from the difference in the mean values of the data points. To be able to obtain a better diffe...


PUM


Abstract

The invention relates to analysis methods for diagnosing diseases on human and animal samples. Said invention also relates to an evaluation method for diagnosing the individual stages of a disease in such a way that it is possible to display the progression thereof. Said invention also makes it possible to identify diseases in an early manner and to carry out therapeutic controls. The inventive method consists in carrying out actually known multivariable evaluation methods for classifying samples. Nevertheless, the invention is characterised in that no sample is allocated to a certain class, but it is classified in a data record based on the interpolation between different classes.

Description

BACKGROUND[0001]1. Field[0002]The invention relates to the field of analytical methods suitable for diagnosing diseases with human or animal samples. To analyze the samples, electromagnetic spectra are recorded, stored and analyzed by multivariate analytical methods. The diagnosis of diseases using multivariate analytical methods is already known in the prior art and is explained in greater detail below. However, with the help of the inventive method, it is also possible for the first time to reliably detect individual manifestations of a disease syndrome in addition to detecting a specific disease. The inventive method thus makes it possible for the first time to diagnose individual stages of progression of a disease; this could provide information regarding the development of a disease, for example, or might reflect the effects of therapeutic methods on a patient's health status.[0003]2. Description of the Related Art[0004]In the prior art, most diagnostic methods are currently ba...

Claims


Application Information

Patent Timeline
Patent Type & Authority Patents(United States)
IPC IPC(8): G01R23/16G06F19/00
CPCG06F19/3437G06F19/366G16H10/40G16H50/50
Inventor PETRICH, WOLFGANGWERNER, GERHARDHEIN, HEINZ-MICHAELKUHR, HANS-JUERGEN
Owner ROCHE DIAGNOSTICS OPERATIONS INC
Why Eureka
Try Eureka