Method of identifying endmember spectral values from hyperspectral image data

a technology of endmember spectral values and image data, applied in the field of identifying endmember spectral values from multi-spectral or hyper-spectral image data, can solve the problems of insufficient accuracy of correction for distortions, image distortions are also subject to distortion, and it is not enough to allow reliable comparisons to reference libraries, and match spectra with ground-based libraries

Inactive Publication Date: 2009-07-28
COMMONWEALTH SCI & IND RES ORG
View PDF3 Cites 7 Cited by
  • Summary
  • Abstract
  • Description
  • Claims
  • Application Information

AI Technical Summary

Problems solved by technology

Images are also subject to distortion due to noise from various sources including instruments, atmospheric interference, viewing geometry and topography of the area scanned.
Corrections for these distortions are still not sufficiently accurate to allow for reliable comparisons to reference libraries.
Therefore, there are problems with matching spectra with ground-based libraries.
Similar problems occur in other fields where it is desired to determine endmembers from multispectral, hyperspectral or other data where a signal is detected on a number of channels or bands.
For example a similar problem occurs in the analysis of proteomics and genomics array data where the signal represents cell or organism response across a range of proteins, cDNAs or oligonucleotides.
Similar problems also occur in fluorescence imaging such as fluorescence microscopy.
One of the main disadvantages of Boardman's method is that it requires considerable manual intervention in processing.
These solutions cannot satisfactorily deal with the common situation where pure or almost pure endmembers are absent from the scene.
Furthermore, they do not deal well with noise in the data.

Method used


Image

  • Method of identifying endmember spectral values from hyperspectral image data
  • Method of identifying endmember spectral values from hyperspectral image data
  • Method of identifying endmember spectral values from hyperspectral image data

Examples


Embodiment Construction

[0031]Multispectral image data is obtained from a multispectral scanner, such as the AVIRIS airborne scanner. A typical scan for mineral applications includes a short wave infra red scan with wavelengths in the region of 2,000 to 2,500 nanometers. This spectral range is useful for exhibiting distinctive shapes for important clay minerals. Typically this will provide 10's of thousands to millions of pixels or even many more.

[0032]A MNF transform is performed on the relevant bands of data to produce variables which are uncorrelated and approximately Normally distributed with an estimated error variance of 1. It is usual to retain MNF bands with the highest signal to noise ratios.

[0033]We let d be the number of MNF bands retained, N is the number of pixels, and M is the number of endmembers (assumed to be less than or equal to d+1).

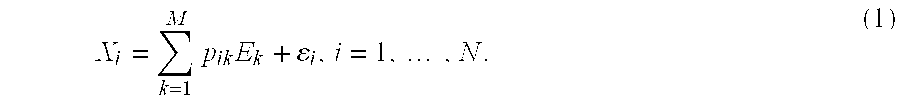
[0034]It is convenient to think of the MNF data as an N×d matrix, whose ith row is written as Xi, and whose jth column is written as xj. Similarly, it will ...


PUM

PropertyMeasurementUnit
wavelength rangeaaaaaaaaaa

Abstract

A method of identifying endmember spectral values from multispectral image data, where each multispectral data value is equal to a sum of mixing proportions of each endmember spectrum. The method comprises the steps of processing the data to obtain a multidimensional simplex having a number of vertices equal to the number of endmembers. The position of each vertex represents a spectrum of one of the endmembers. Processing the data is conducted by providing starting estimates of each endmember spectrum for each image data value. The mixing proportions for each data value is estimated from estimates of the spectra of all the endmembers. The spectrum of each endmember is estimated from estimates of the mixing proportions of the spectra of all the endmembers for each image data value. The estimation steps are repeated until a relative change in the regularised residual sum of squares is sufficiently small. The regularised residual sum of squares includes a term which is a measure of the size of the simplex.

Description

[0001]This application is the U.S. National Phase of International Application PCT / AU03100409, filed on Apr. 4, 2004, which designated the U.S. and claims priority to Australian Application No. PS 1552, filed Apr. 5, 2002. The entire contents of these applications are incorporated herein by reference.FIELD OF THE INVENTION[0002]The present invention relates to a method of identifying endmember spectral values from multispectral or hyperspectral image data, which is particularly useful in identifying different materials from multispectral or hyperspectral images.BACKGROUND TO THE INVENTION[0003]It is known to collect remote sensing data to provide images of scenes to aid in broad scale discrimination of various features of land scanned including identifying mineral deposits and vegetation Two examples of hyperspectral scanners are NASA's 224 band AVIRIS, which has bands spaced about every 10 nanometers in a range from 400 to 2500 nanometers, and the 128 band Australian commercial sca...

Claims


Application Information

Patent Timeline
Patent Type & Authority Patents(United States)
IPC IPC(8): G06K9/46G01V9/00G01J3/28G01N21/27G01N21/35G01N21/64G06F19/00G06T7/40G06T7/90G06V20/13
CPCG06K9/0063G06T7/408G06K9/624G06T7/90G06V20/13G06V10/7715G06F18/2134
Inventor BERMAN, MARKKIIVERI, HAARI TAPLOLAGERSTROM, RYANDUNNE, ROBERT ALDAN
Owner COMMONWEALTH SCI & IND RES ORG
Why Eureka
Try Eureka