Automated sample analysis

a sample analysis and sample technology, applied in the field of specimen analysis, can solve the problems of contaminated fluids used in manufacturing processes, unsatisfactory contaminants, and decreased fluid performance for the intended purpose,

Active Publication Date: 2009-09-29
CAPLIPER LIFE SCI INC
View PDF5 Cites 92 Cited by
  • Summary
  • Abstract
  • Description
  • Claims
  • Application Information

AI Technical Summary

Benefits of technology

[0009]In one aspect, the indicators include fluorescing compounds or materials, which when exposed to specific materials present in the sample within a desired range of concentration or quantity, fluoresce and thereby provide a signal indicative of the presence of a specific material in the sample being analyzed, as well as of the quantity of the material. Preferably the microfluidic device is interfaced with a standalone instrument, i.e., an instrument which includes all control and reporting peripherals and software therein, such that once the sample is prepared for analysis, the standalone instrument directs any additional diluting and the mixing of samples, indicators and buffers necessary to enable analysis without further operator or technician intervention. In one aspect, the instrument and microfluidic device, in combination can be self-calibrating by comparing sample data to one or more reference samples having known concentrations of the constituent of interest. In an additional aspect, the small dimensions of the fluidic elements in the microfluidic device enable small amounts of sample, indicator and other reagents to be utilized to determine the properties of interest of the sample. In yet another aspect, the analysis determines the concentration of ions of inorganic substances in a sample.

Problems solved by technology

These materials may be used in the process, or they may be undesirable contaminants.
Errors inherent in this analysis, which relies upon the judgment of the technician to determine the quantities of additives in the samples, can result in inadequate or improper addition of the additives, resulting in decreased performance of the fluid for its intended purpose.
Likewise, some fluids used in manufacturing processes may become contaminated with undesirable materials.
For example, it may be illegal to discharge fluids from industrial, chemical, mineral exploration and other sites when those fluids contain certain levels of hazardous materials.
In many industrial settings, this analysis is again made manually, typically through visual titration techniques, and errors in the analysis can result in the unwanted discharge of hazardous materials, or the perceived inability to discharge fluid streams that are properly dischargeable.
Microfluidic devices, which are widely used in the analysis of biological materials, have not been widely used to analyze samples from industrial processes.
The use of microfluidic devices has been almost exclusively limited to the analysis of biological materials largely because the concentration of the components of interest in biological samples, and the pH of those samples, are within relatively narrow and predictable ranges.
For example, many fluorescent dyes used to label components of interest in an analysis are only effective over a certain concentration range of the material the dyes detect.
However, fluorescent dyes only have a limited dynamic range, meaning that the level of fluorescence is indicative of the concentration of the material over a narrow range of concentration.
Similarly, many of those fluorescent dyes are only effective within a certain range of pH.
Thus it would be very difficult to employ a fluorescent dye to analyze a sample in which the pH and the concentration of the material of interest is completely unknown, as is typically the case for samples of fluids from industrial operations.
Another factor limiting the application of microfluidic devices to the analysis of industrial fluids is that the level of fluorescence generated by a sample may vary between individual microfluidic devices.

Method used


Image

  • Automated sample analysis
  • Automated sample analysis
  • Automated sample analysis

Examples


Embodiment Construction

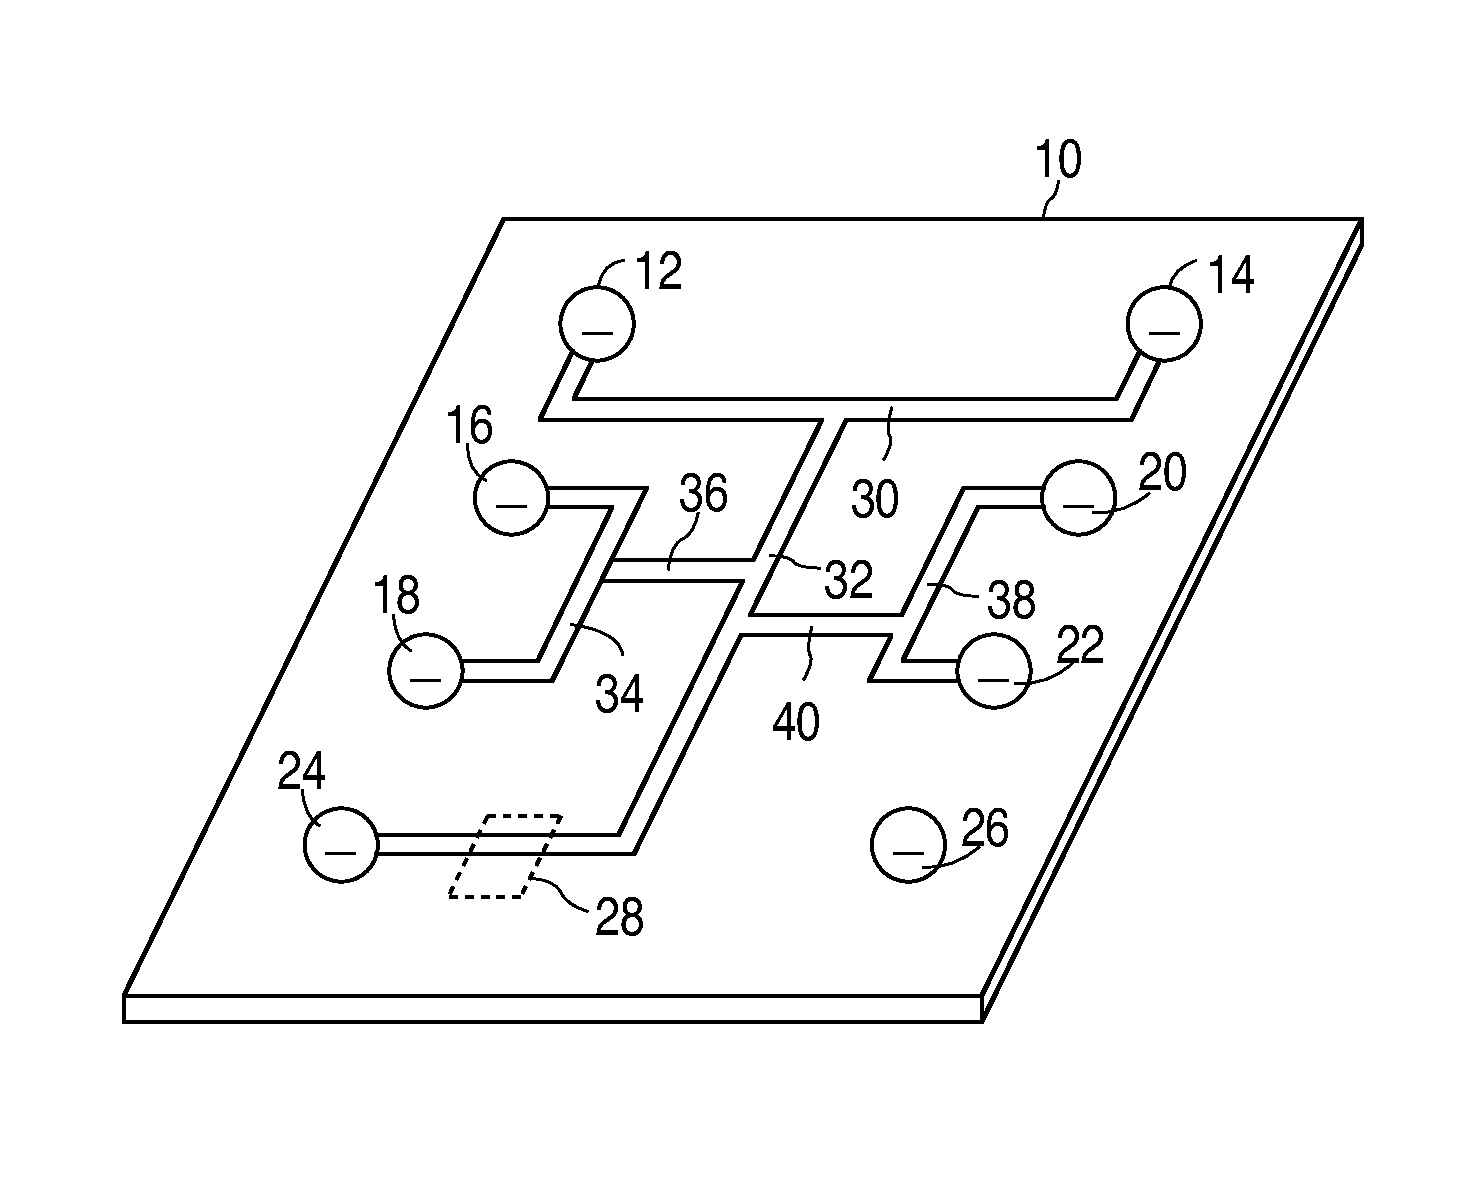
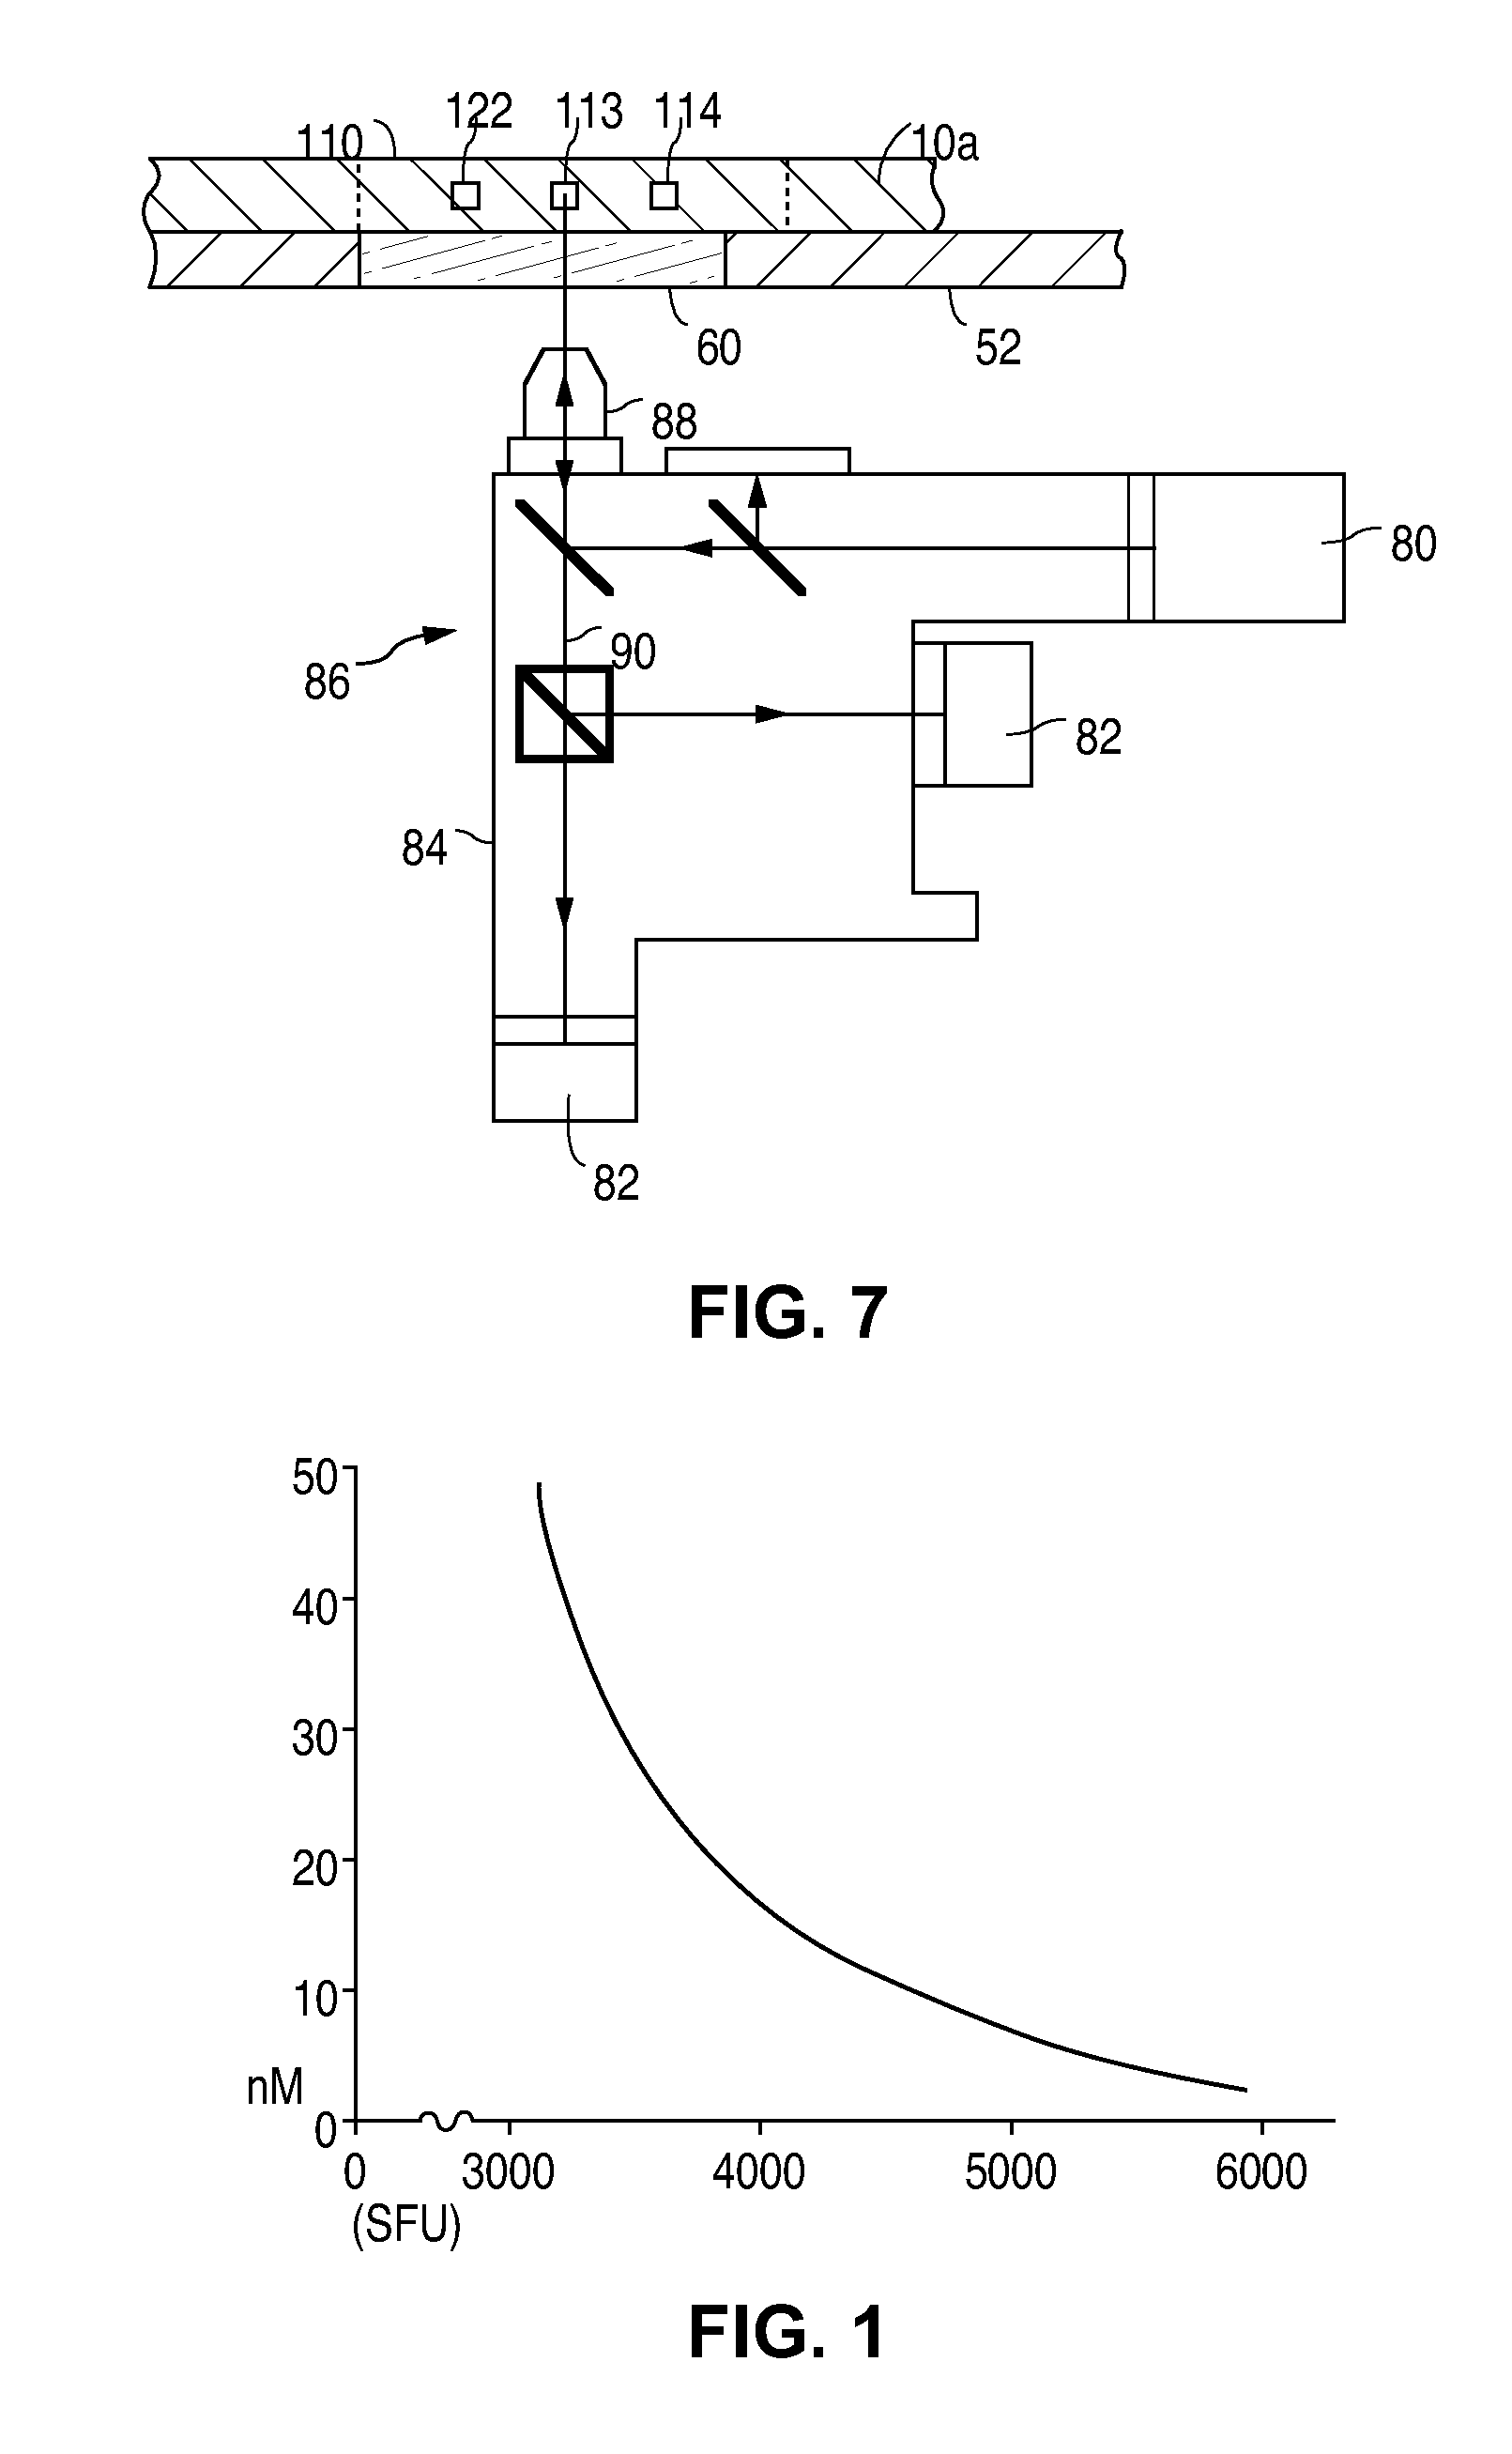
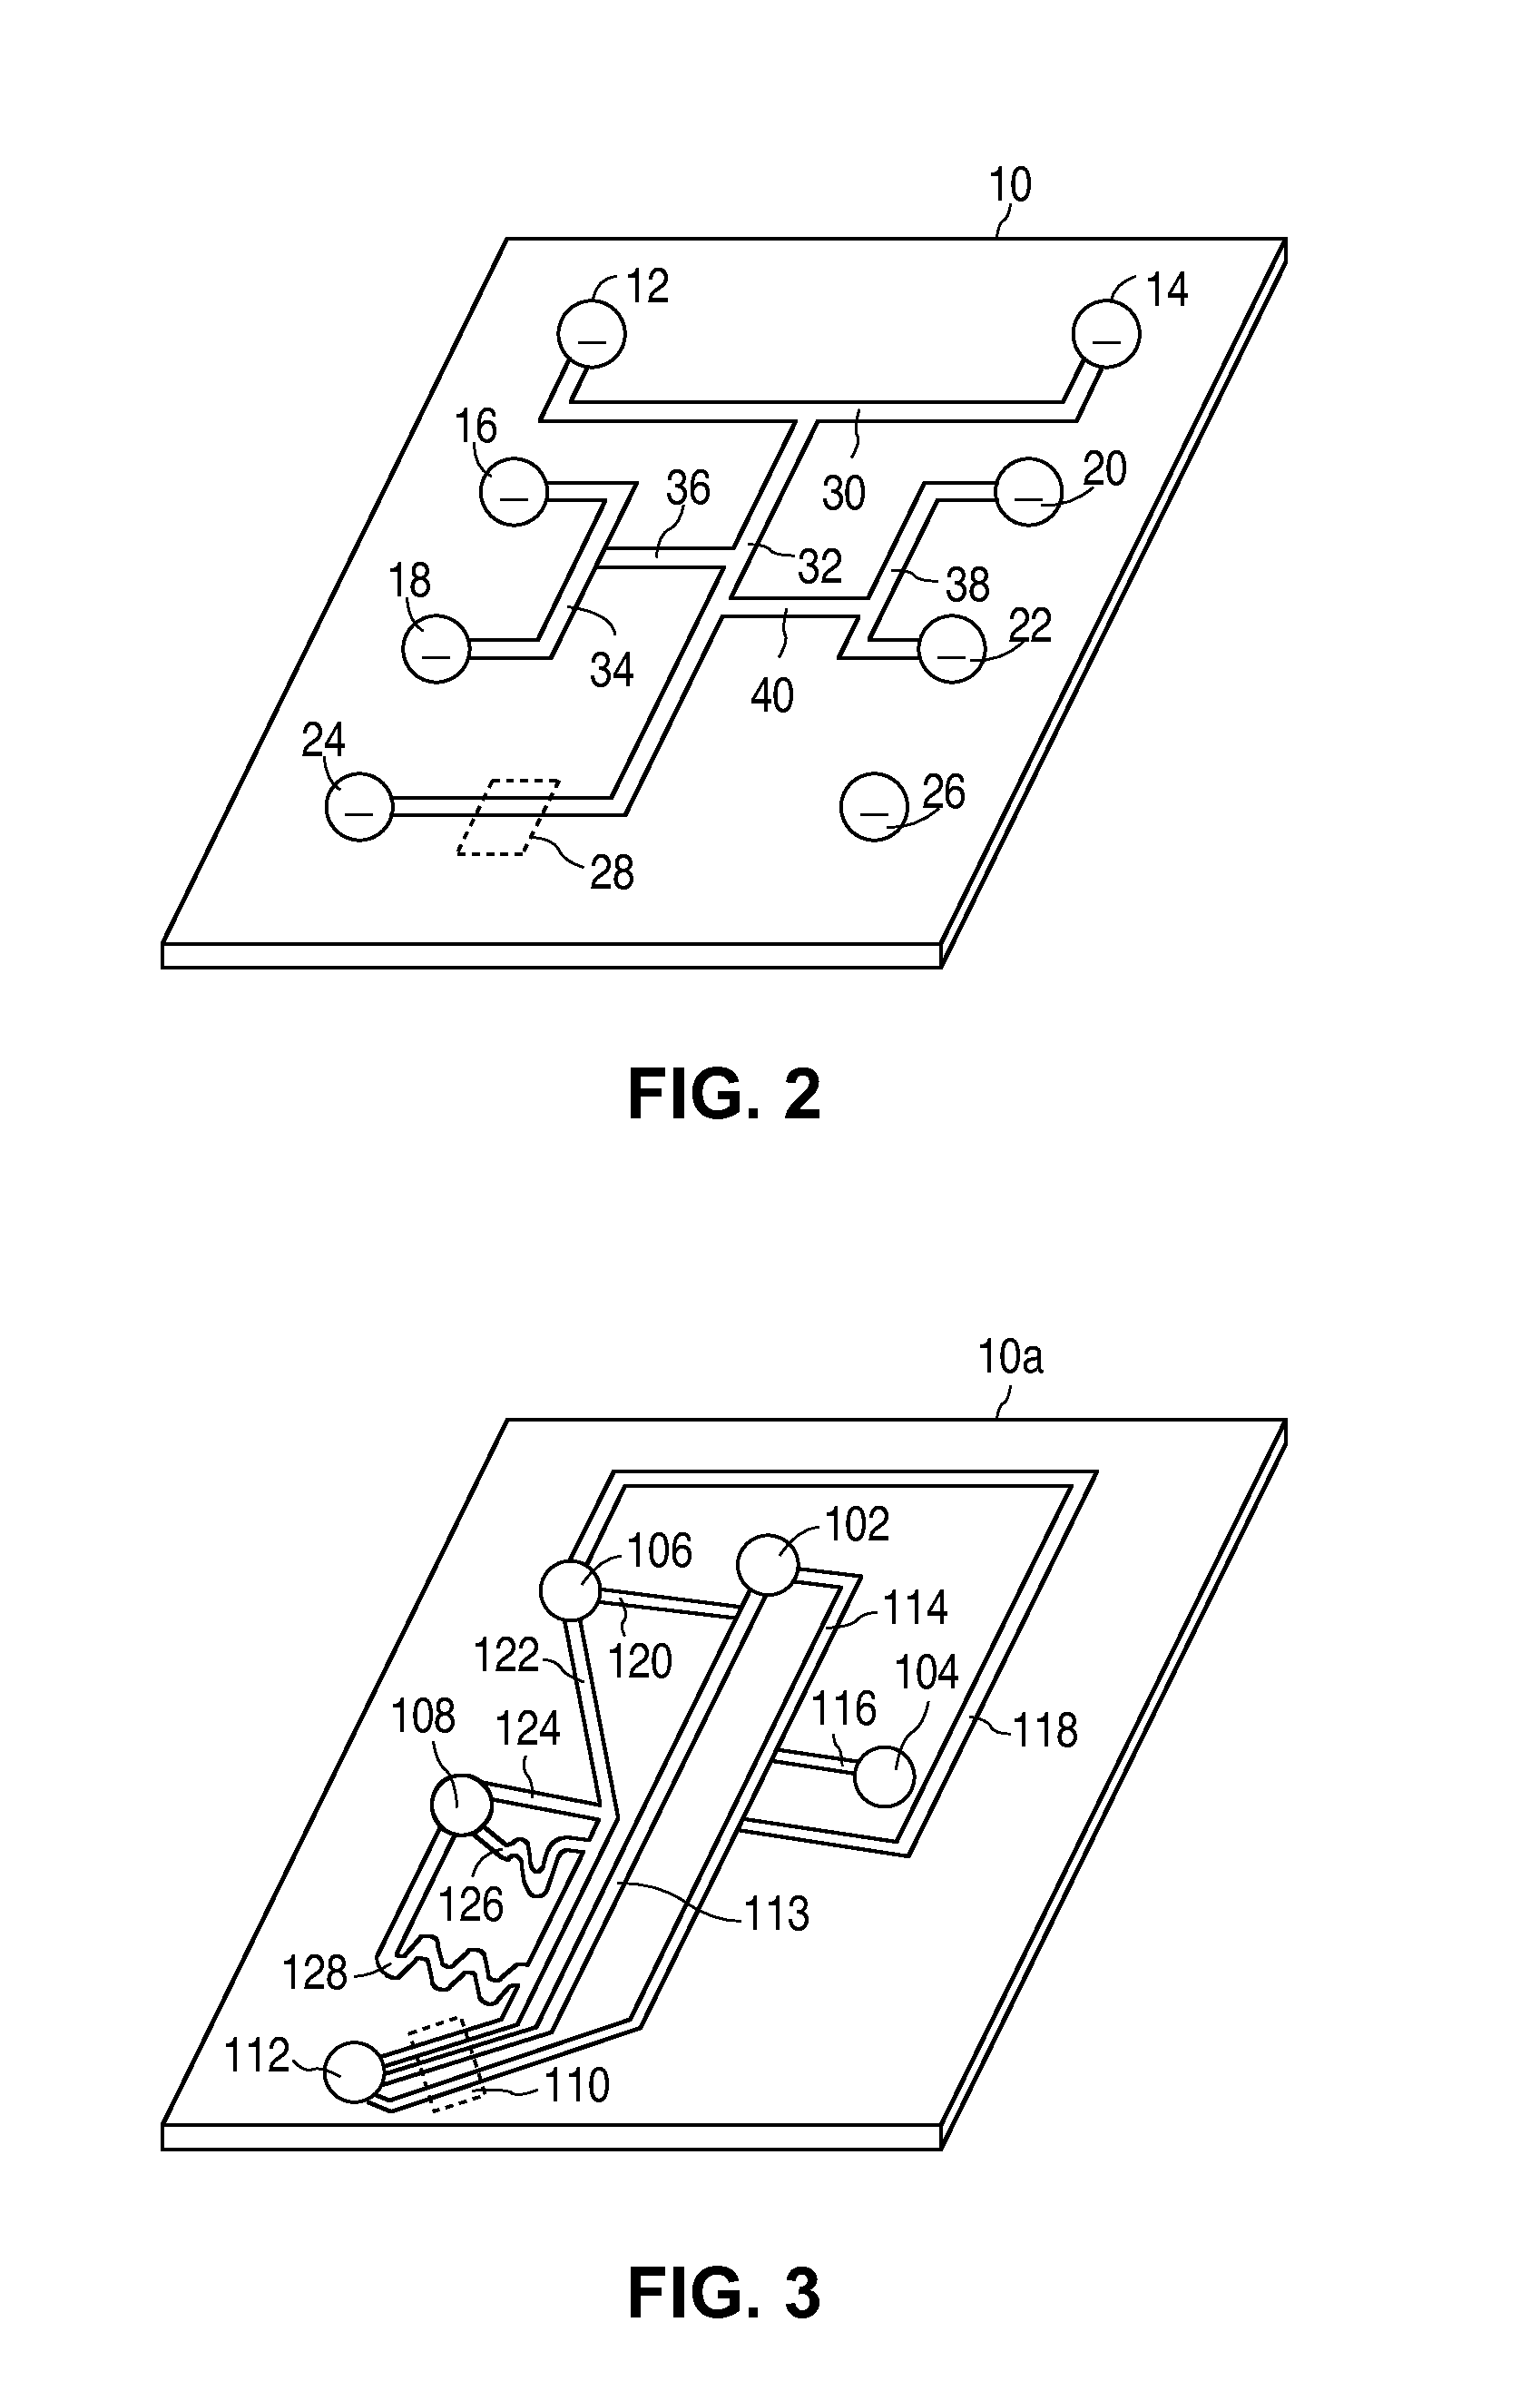
[0020]The present invention provides methods and apparatus for the analysis, such as the chemical analysis, of samples of materials for selected properties thereof, and in particular, enables relatively rapid and accurate quantitative analysis of chemicals in non-biological samples, which quantities are indicative of the relative status or correctness of an industrial process, or condition of the material from which the sample was taken. The methods and apparatus are applicable to the replacement of traditional laboratory analysis techniques, and have the particular advantage of being compact in size, relatively easy to use, and not subject to operator interpretation to provide the resulting determination of the quantity of a substance or constituent present in a sample. In one aspect, the analysis relies on the reaction of dyes that fluoresce when exposed to light within a specific wavelength range with a material of interest that may be present in a sample. By analysis of the magn...


PUM

PropertyMeasurementUnit
diameteraaaaaaaaaa
diameteraaaaaaaaaa
wavelengthaaaaaaaaaa

Abstract

Samples of materials used in industrial processes are analyzed to determine the concentration of certain materials of interest. The quantitative analysis of samples for these materials is provided without the need for manual methods such as titration. Indicators such as fluorescent dyes for which the intensity of fluorescence is indicative of the concentration of a material of interest are used. The dyes are made to fluoresce by means of a light source, and a photomultiplier or other detector capable of measuring light intensity detects the resulting fluorescence. The intensity of fluorescence in the sample is compared to the intensities of fluorescence produced by samples with known concentrations of the material of interest to determine the concentration of the material of interest of the sample.

Description

RELATED APPLICATIONS[0001]This application is based on U.S. Provisional Application Ser. No. 60 / 469,431, filed May 9, 2003.BACKGROUND OF THE INVENTION[0002]1. Field of the Invention[0003]The present invention relates to the field of specimen analysis, and methods and apparatus therefor. More particularly, the invention relates to the field of specimen analysis for monitoring and controlling industrial, agricultural, mineral exploration and similar processes and operations.[0004]2. Description of the Related Art[0005]The need to monitor or control an operation or process arises in many industrial operations. Such industrial operations include the manufacture of goods, and the exploration for and production of minerals. Frequently, the data required to monitor or control an operation or process is generated by a chemical analysis that determines the presence or quantity of certain materials. These materials may be used in the process, or they may be undesirable contaminants. For examp...

Claims


Application Information

Patent Timeline
Patent Type & Authority Patents(United States)
IPC IPC(8): G01N21/76G01N1/10G01N21/64G01N33/00B01F5/04B01F13/00B01L3/00B01L9/00G01N21/27G01N21/79G01N27/447G01N35/00
CPCB01L3/5027B01L3/502715B01L3/502746G01N21/276G01N21/643G01N21/645G01N27/44721G01N27/44791G01N35/00029B01F5/0403Y10T436/11B01L9/527B01L2200/10B01L2200/148B01L2300/0816B01L2300/0864B01L2300/0867B01L2400/0415B01L2400/0487B01L2400/049B01L2400/084G01N21/79G01N2021/6443G01N2021/6482G01N2035/00148G01N2035/00158Y10T436/2575B01F13/0059B01F25/31B01F33/30
Inventor BRASSEUR, MICHAEL
Owner CAPLIPER LIFE SCI INC
Why Eureka
Try Eureka