[0018]To analyze the extent to which a drive test route covers a given population in a market area, the market area could be divided into a plurality of blocks, each having a measured (or approximated) population. The computer system could then flag each block through which the drive test route passed and could then total the population of those blocks to establish a covered population value. The computer system could then compare the covered population with the total market population to derive an extent (e.g., percentage) of population covered. If that extent of population is less than a desired threshold, such as 60%, the computer system may then generate a message advising of this or suggesting an alternative route.
[0019]In a more refined embodiment, by reference to the geographic data points in the drive test data, the computer system could compute the length along which a drive test route passed through each block. (If the drive test route passed along a straight line through the block, the length would be simple to compute. If the drive test route passed over a curved path through the census block, the length could be approximated as the sum of lengths between each successive geographic data point recorded in the drive test data). The computer system could then multiply the length by a width representing the range of communication to / from the MDM tool (e.g., 400 feet), so as to establish an approximate measure of the area of the block actually covered by the drive test route. That area could then be compared to the total known area of the block to determine a fraction of the census block covered. The fraction could be applied to the population of the block to establish an approximation of the population covered as the drive test proceeded through the block. The computer system could add those measures together for each block through which the drive test passed and, as noted above, could then compare the total covered population with the total market population. If the total covered population does not cover at least a threshold extent of the total market population, then the computer system can generate a message indicating this.
[0020]In a related embodiment, the invention involves determining which of a set of census blocks or other geographic blocks one or more drive test routes did not pass through during a given time period, and responsively generating a set of drive test route instructions to facilitate drive testing through those missed blocks. For instance, the computer system could flag each block through which one or more drive test routes passed and could then generate a listing of the uncovered blocks. The listing could then be used as a direction for a drive test driver to cover. Alternatively, the computer system could produce a route (e.g., shortest path) through the uncovered blocks, to serve as specific driving directions for a drive test driver. Other examples are possible as well.
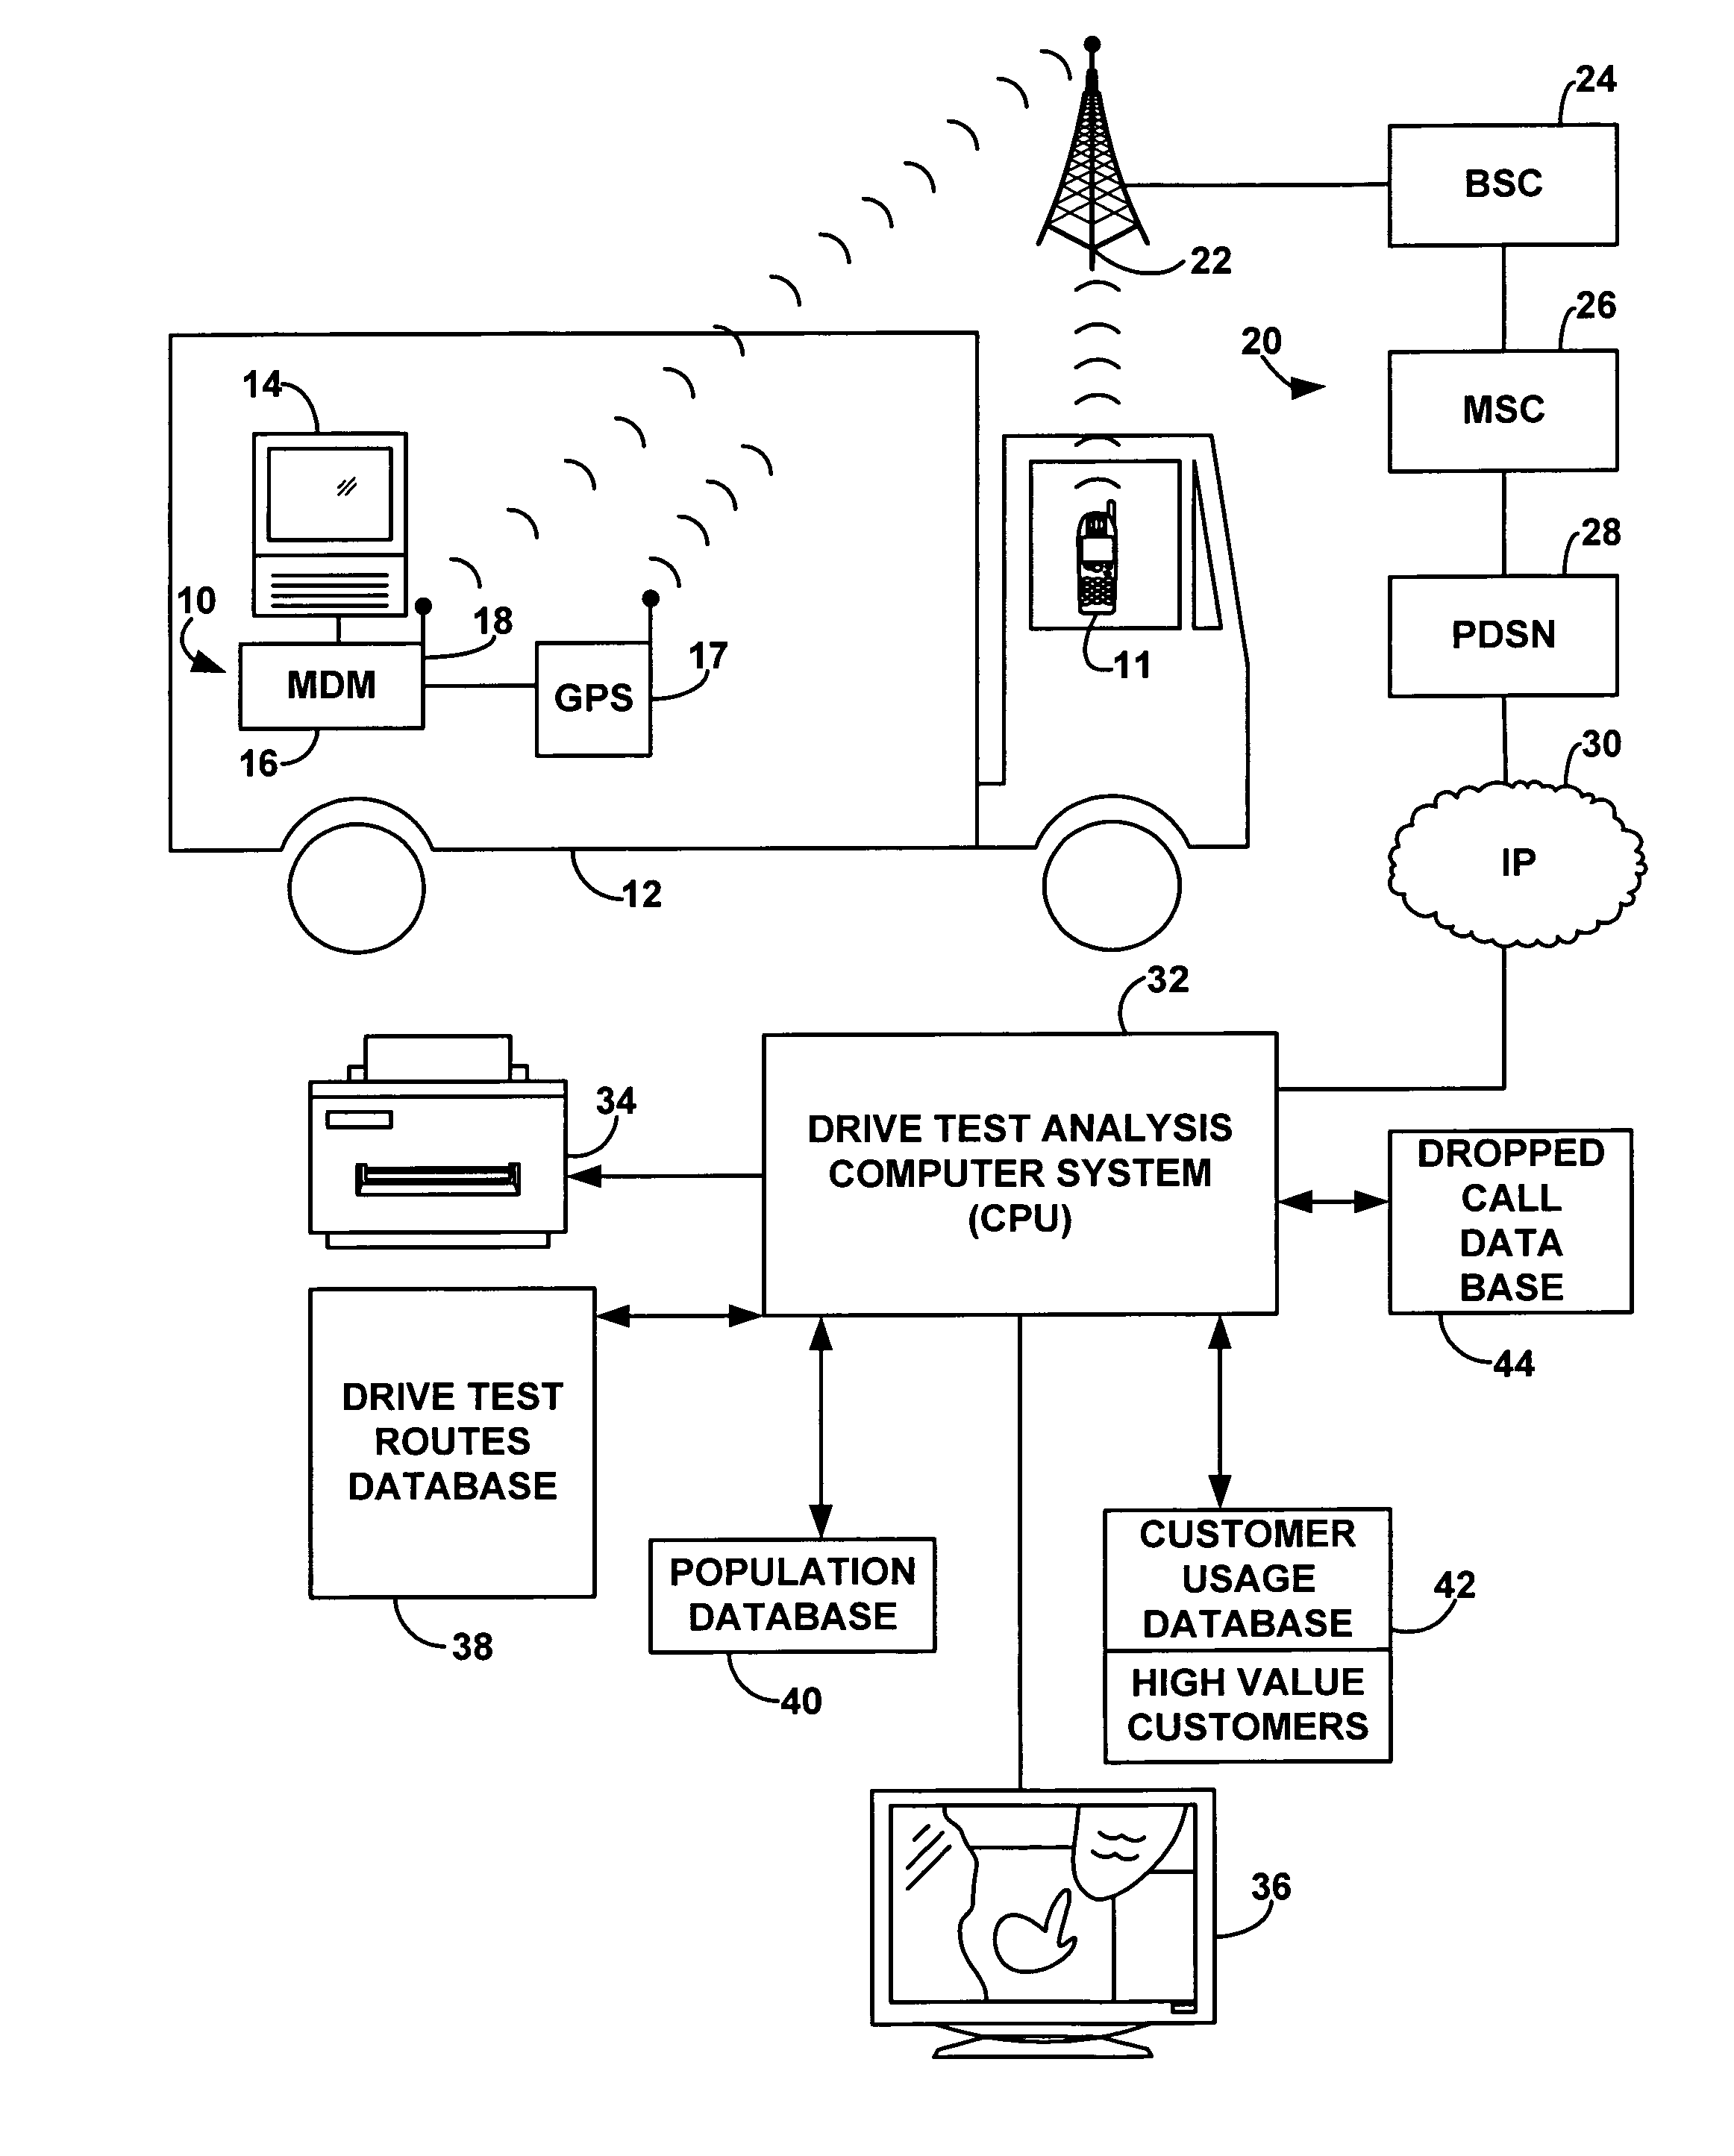
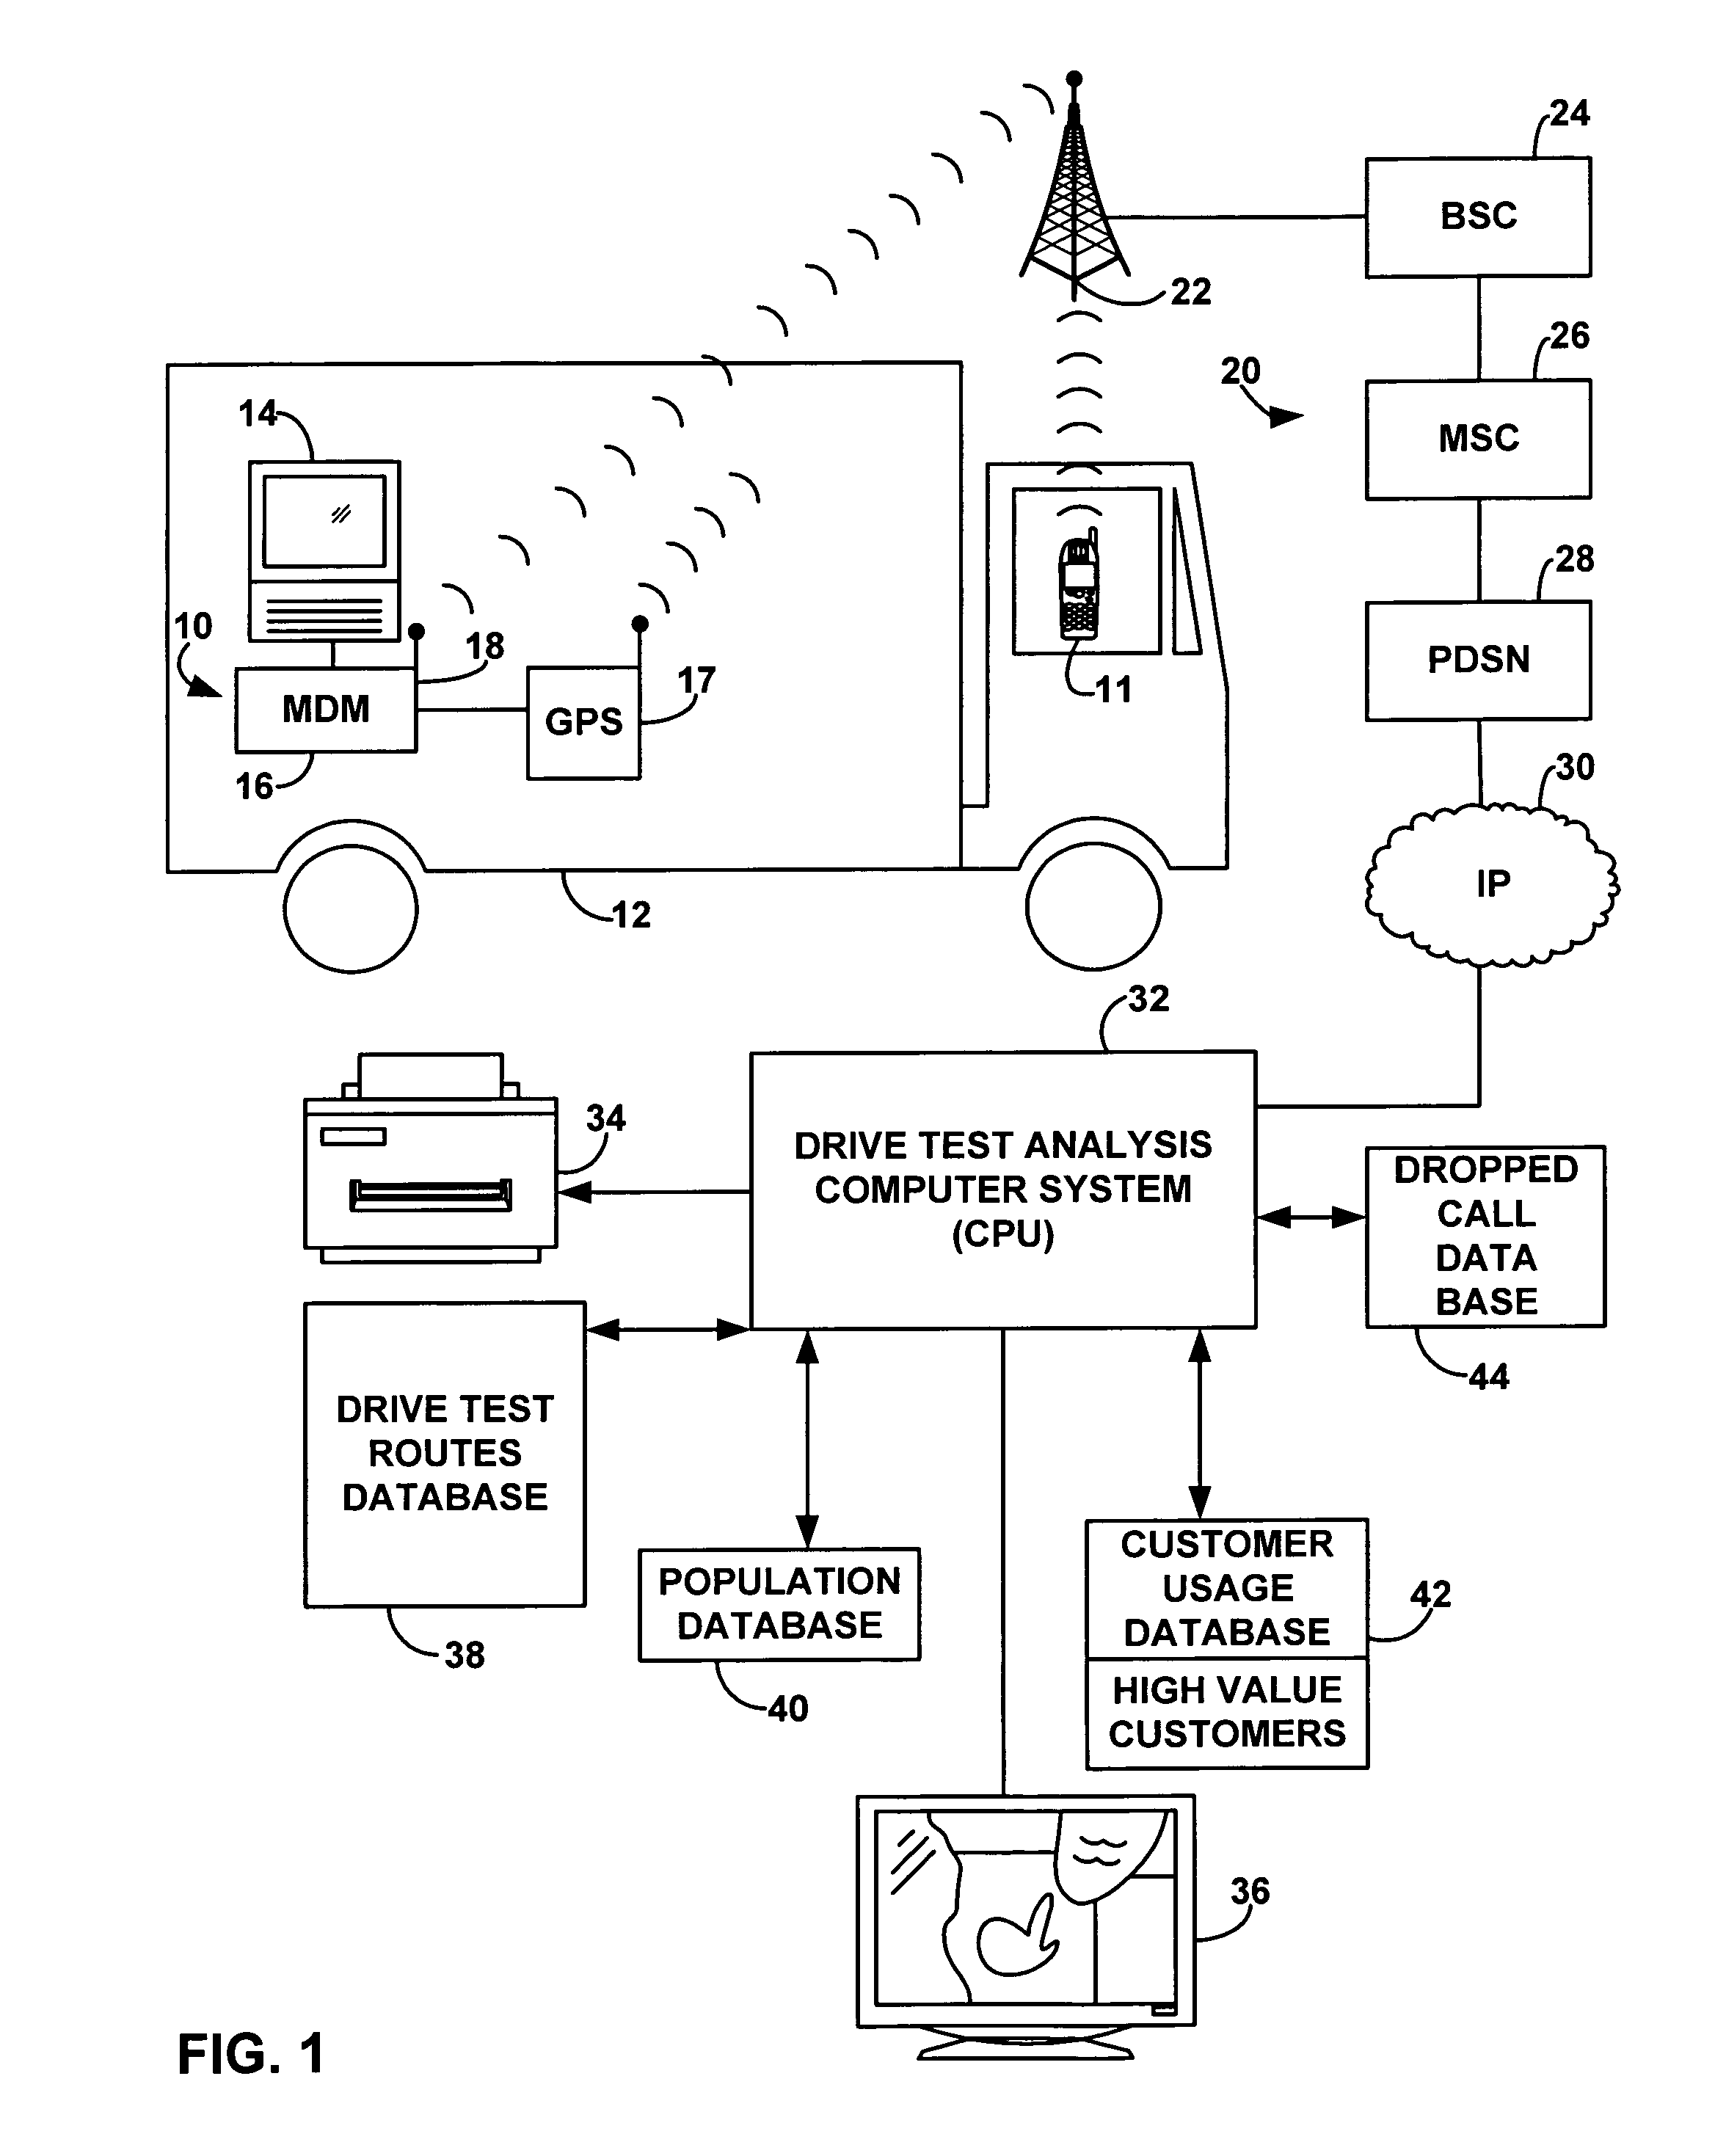
[0021]While the above examples have described analysis and management of drive test routes based on geographic population distributions, the analysis of drive test coverage could be based on other geographical data, including data as to (a) where the customers use their phone, e.g., from call attempt or minute-of-use data that is present in the wireless carrier system, (b) where the problems in wireless service tend to be located, e.g., from data on dropped calls and data where blocked calls are occurring, and (c) where a subset of customers such as so-called “high value” customers are or where such customers use their phones. In situation (c), wireless service providers maintain databases of call-detail records for their customers that can be mined to determine customers with a high volume of calls (or other indicia of value). Such databases can also be mined to determine where those customers are located (e.g., their billing address) and also to geographical locations of where these high value customers are using their phones.
[0022]The computing unit analyzing drive test routes could prioritize these parameters (and possibly other parameters as well), for example using weighting formulae, when determining whether the drive test routes satisfy a criteria, e.g., are adequate according to some predetermined drive test standard. The computing unit might, for example, weight geographic data as to wireless device usage (parameter (a) above) high, and weight geographic data for high-value customers (parameter (c) above) high, and weight general population distribution data and geographic data for problem areas (parameter (b) above) low, and then analyze existing drive test routes with this weighting to determine the adequacy of the drive test routes, and generate a signal proposing modifications to the routes. For example, the computer could generate a map showing areas that are insufficiently covered with existing drive test routes (perhaps with the areas given high weighting shown on the map) and propose modifications to the drive test routes to more thoroughly test the areas that are weighted high that are missed with existing drive test routes.
[0023]Further details on these and other aspects of the invention will be more fully appreciated from the following detailed description.

