Multi-channel system for beat to beat QT interval variability

a multi-channel system and qt interval technology, applied in the field of electrocardiography, can solve the problems of affecting reproducibility, time-consuming and laborious human intervention steps, and the limitations of existing software programs, so as to reduce the overall effect of noise, reduce the effect of noise, and rapid and regular updating

Inactive Publication Date: 2011-07-19
CARDIOSOFT
View PDF11 Cites 25 Cited by
  • Summary
  • Abstract
  • Description
  • Claims
  • Application Information

AI Technical Summary

Benefits of technology

[0009]To address these limitations, the present invention provides a PC-based software program that allows for the automated and real-time monitoring of multiple indices of QTV and PQV, not only in each of the independent channels that constitute the standard 12-lead or Frank-lead ECG, but also in certain related signals derived from singular value decomposition (SVD) that help to reduce the overall effects of noise. The development of this invention was, in part, based on the assumption that automatically constructed templates are more reproducible than manually constructed templates, and also better meet the demand for rapid and regular updating as required for the continuous and real-time monitoring of changes in QTV, PQV and TWM. It was also assumed that QT and PQ interval data derived from multiple leads not only provide more information than similar data derived from a single lead, but also, with proper statistical treatment, help to reduce the effects of noise.

Problems solved by technology

However, there are a number of limitations associated with these existing software programs.
This step of human intervention is both time consuming and labor intensive, and affects the reproducibility of the result.
This can lead to spuriously high QTV values, particularly when the T wave in the channel being studied is small, noisy or otherwise poorly defined.
Third, no known existing programs for QTV analyses perform in real time, only offline, with the exception of one real-time program that is focused on dynamic QT vs.
A lack of real-time capability necessarily entails that any acute or subacute change in QTV, as might occur for example during myocardial ischemia or the treatment thereof, cannot be readily observed or acted upon.
Similar limitations also apply to all existing programs that attempt to measure PQ interval variability (PQV).
This system has proved to be very successful, but did not provide the means to analyze QT or PQ variability, as in the systems referred to above.
However, the Berger et al. method suffered from the same drawbacks as other QTV systems as described above.
Although Malik et al's TWR parameter may help to supplement other pre-existing measures of TWM, such as the so-called “complexity ratio” earlier introduced by Priori et al., the TWM parameters of Malik et al. are subject to certain critical limitations that adversely impact their clinical utility.
For example, the TWR parameter is hampered by its poor reproducibility, and, especially when signal averaging is not performed, TWR may often in fact represent more noise than signal.

Method used


Image

  • Multi-channel system for beat to beat QT interval variability
  • Multi-channel system for beat to beat QT interval variability
  • Multi-channel system for beat to beat QT interval variability

Examples


Embodiment Construction

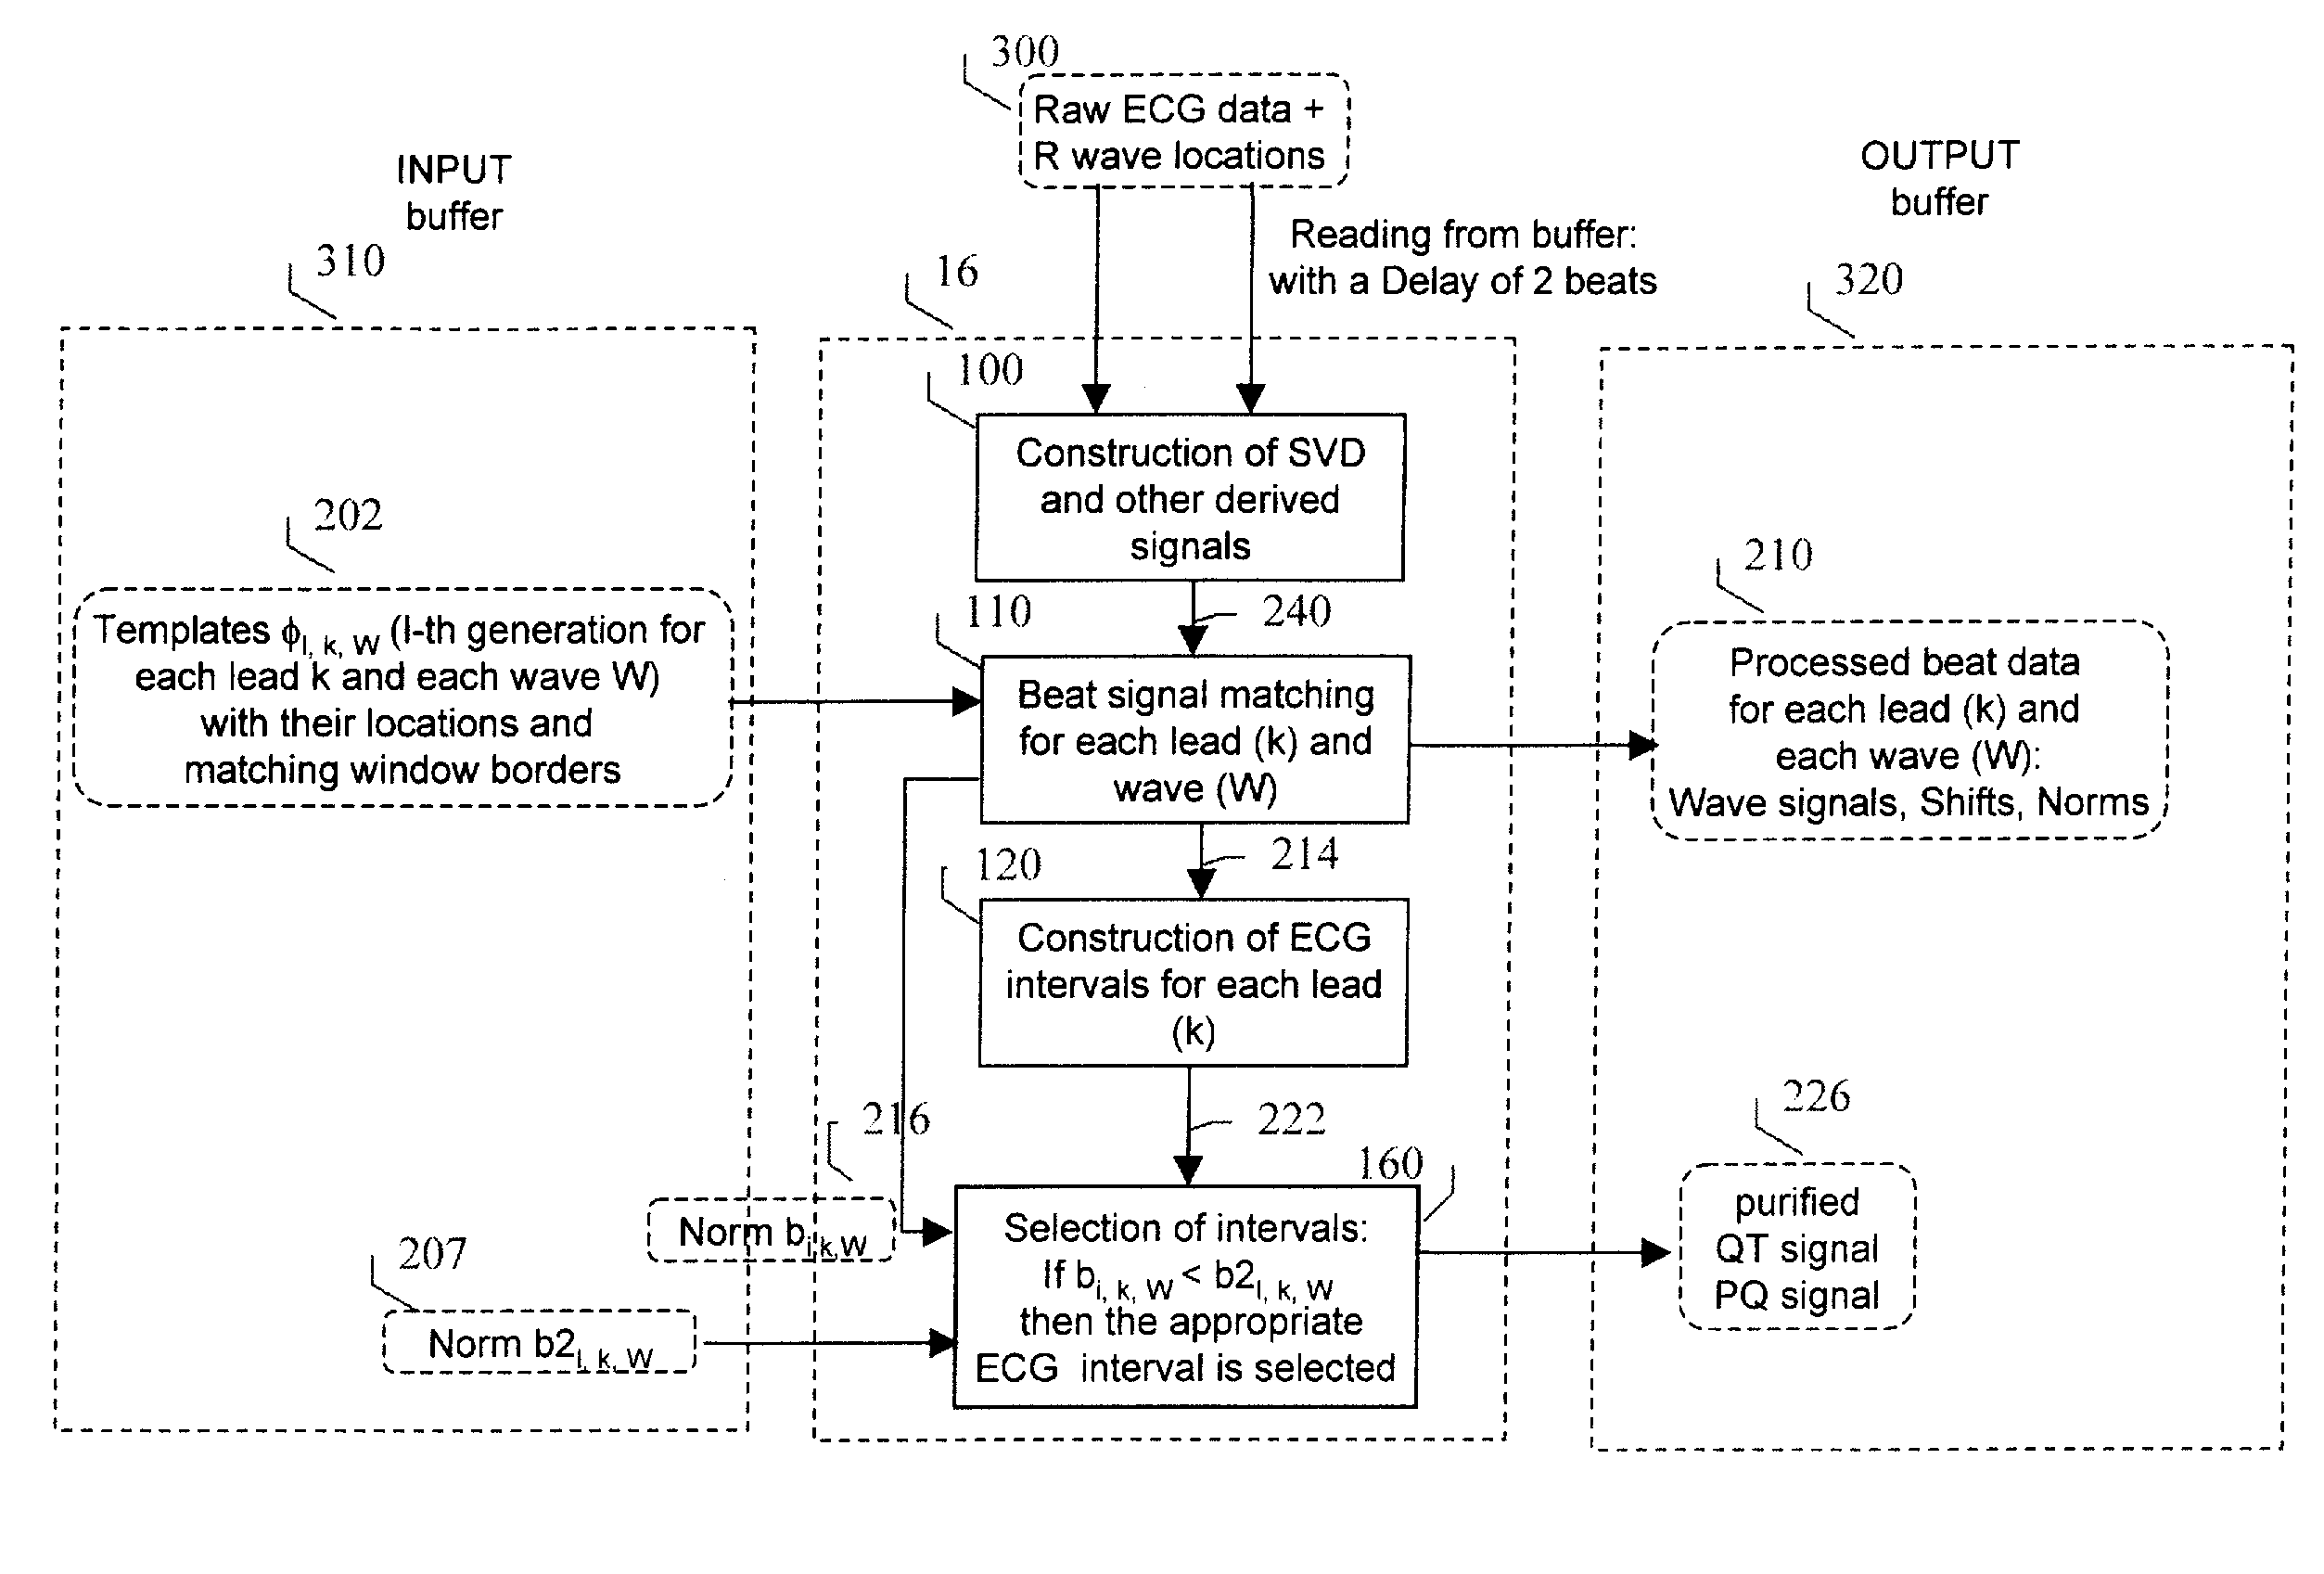
[0027]The present invention uses a software program to analyze multilead ECG signals of a conventional ECG in real-time or stored for subsequent analysis. One advantage of the system of this invention resides in the fact that it analyzes a plurality of received ECG signals simultaneously and automatically without the need for an operator to select and define trigger points on or near the QRS, T, or P waves. The system automatically calculates various parameters from the received ECG waveforms related to the electrical depolarization and especially repolarization of the cardiac chambers that helps to differentiate diseased hearts from non-diseased hearts. The system also uses certain signal analysis techniques to reduce the effects of noise, jitter, and other deliterious effects which presently plague known systems.

[0028]To accomplish these goals, the system measures and analyzes the voltage-time data for any three or more channels of data that contribute to the conventional 12-lead ...


PUM


Abstract

A PC-based ECG software program that in real time, acquires, analyzes and displays QTV and PQ interval variability (PQV) in each of the independent channels that constitute the 12-lead conventional and / or Frank X, Y, Z lead ECG. The system also analyzes and displays the QTV and PQV from QT and PQ interval signals that are derived from multiple channels and from singular value decomposition such that the effect of noise and other artifacts on the QTV and PQV results are substantially reduced compared to existing single-channel methods. Moreover, this invention also provides certain new parameters of T-wave (and QRS and P-wave) morphology, that in initial studies have improved clinical diagnostic utility and / or reproducibility and reliability compared to known existing parameters of T-wave morphology. Finally, it also provides a method for determining the beat-to-beat variability these T, QRS and P-wave morphologic parameters.

Description

[0001]This application claims the benefit of U.S. Provisional Patent Application Ser. No. 60 / 767,030 filed Feb. 27, 2006.FIELD OF THE INVENTION[0002]The present invention relates generally to the field of electrocardiography, and more particularly to a processing system and method to analyze and display electrocardiographic signals to indicate: 1) the variability of the QT and PQ intervals from one beat to the next; and 2) the decomposed morphology of the T, P and QRS waves and the variability of this morphology from one beat to the next.BACKGROUND OF THE INVENTION[0003]The measurement of beat-to-beat QT interval variability (QTV) shows clinical promise for identifying several types of cardiac pathology, including coronary artery disease, acute myocardial ischemia and infarction, left ventricular hypertrophy, and various types of cardiomyopathy. Importantly, in patients referred for electrophysiologic studies and in animals who receive drugs that prolong the QT interval, increased r...

Claims


Application Information

Patent Timeline
Patent Type & Authority Patents(United States)
IPC IPC(8): A61B5/04
CPCA61B5/04525A61B5/0468A61B5/0472A61B5/0478Y10S128/92A61B5/35A61B5/364A61B5/366A61B5/291
Inventor STARC, VITO
Owner CARDIOSOFT
Why Eureka
Try Eureka