Method for automated distributed diagnostics for networks

a distributed diagnostic and network technology, applied in the field of system diagnostics, can solve the problems of limiting the size of the problems that can be solved, failure in many different ways, and the rate of complexity growth, so as to minimize overlap, minimize the presence of cross-domain symptoms, and the effect of high probability

Inactive Publication Date: 2012-10-02
TELCORDIA TECHNOLOGIES INC
View PDF7 Cites 2 Cited by
  • Summary
  • Abstract
  • Description
  • Claims
  • Application Information

AI Technical Summary

Benefits of technology

[0017]Next, the relation graph is partitioned into several ‘computational domains’, with roughly equal numbers of nodes in each domain, while minimizing the number of relational links that bridge separate domains (which correspond to ‘cross-domain’ symptoms). Each domain includes only a subset of the objects (which, upon failure, are termed faults) and the symptoms they produce upon failure. Graph partitioning is a well-studied problem of graph theory, for which are various fast algorithms even for graphs with thousands of nodes. See, for example, B. Hendrickson, R. Leland, “A Multilevel Algorithm for Partitioning Graphs”, Supercomputing 95, Proceedings of the IEEE / ACM SC95 Conference, 1995. In partitioning the relational graph, each relational link (which corresponds to one or more symptoms) is assigned a weight equal to the sum, taken over the symptoms represented by the relational link, of the reciprocal of the number of distinct object-pairs that produce each such symptom. This choice of weights is intended as an aid to achieving the objective of minimizing the number of cross-domain symptoms in the partition. The size of each domain (the number of objects assigned to it) is chosen to be the largest value for which computations for the local diagnosis in each domain can be carried out in a reasonable length of time by a centralized algorithm, i.e., one which works with knowledge of the portion of the fault propagation model pertaining to the faults and symptoms in the domain. The number of domains into which the problem needs to be partitioned thus depends on the largest problem size that can be handled in a single domain.
[0018]One could either obtain a fixed partitioning of the relation graph of the original bipartite model, comprising all the potential faults and their symptoms, or adapting the partitioning to the particular instance of the graph that comprises only the actually observed symptoms and all the faults that constitute their potential causes in each realized scenario. In the latter case, the relation graph that is sought to be partitioned into loosely-coupled domains corresponds to the actual observed symptoms in each scenario of the occurrence of faults and symptoms. Owing to the randomness in occurrences of faults, one expects, on the whole, that such an adaptive partitioning of the realized graph, matching the partitioning to the observed symptoms, offers a higher probability of being able to find a partition that minimizes the presence of cross-domain symptoms. Thus, an innovative element of our approach is to create virtual ‘computational domains’ for each realization of the fault propagation model, grouping faults into these domains solely for the sake of computational efficiency, with no necessary connection to the geographical location of the elements that, upon failure, become faults. Thus, our approach to distributed computation is based on the idea of arranging for a suitable domain-partition that minimizes the overlap between domains, which increases the likelihood of finding a provably optimal global solution by the mere selection of a combination of optimal local solutions of the individual domains.
[0020]First, each individual domain determines all its optimum local solutions, ignoring all of its cross-domain symptoms. If all faults have the same probability of occurrence, an optimal solution is a minimal set of faults that ‘covers’ (explains) all the observed local symptoms. This is a standard ‘set covering’ problem that can be solved by commercial integer programming solvers. This procedure is easily adapted to the case where faults have different probabilities of occurrence.

Problems solved by technology

It is a complex inter-connection of many elements, and hence, can fail in many different ways.
The failure of a single element, like a transmission link, a router, a server, or a database could affect many network-functions and thus give rise to a multitude of “alarms”, all correlated to the same failure.
Thus, in a complex system, many different symptoms could arise from the failure of a single element and many different element-failures can give rise to the same symptom.
This rate of growth in complexity limits the size of the problems that can be solved by means of direct, centralized computation.

Method used


Image

  • Method for automated distributed diagnostics for networks
  • Method for automated distributed diagnostics for networks
  • Method for automated distributed diagnostics for networks

Examples


Embodiment Construction

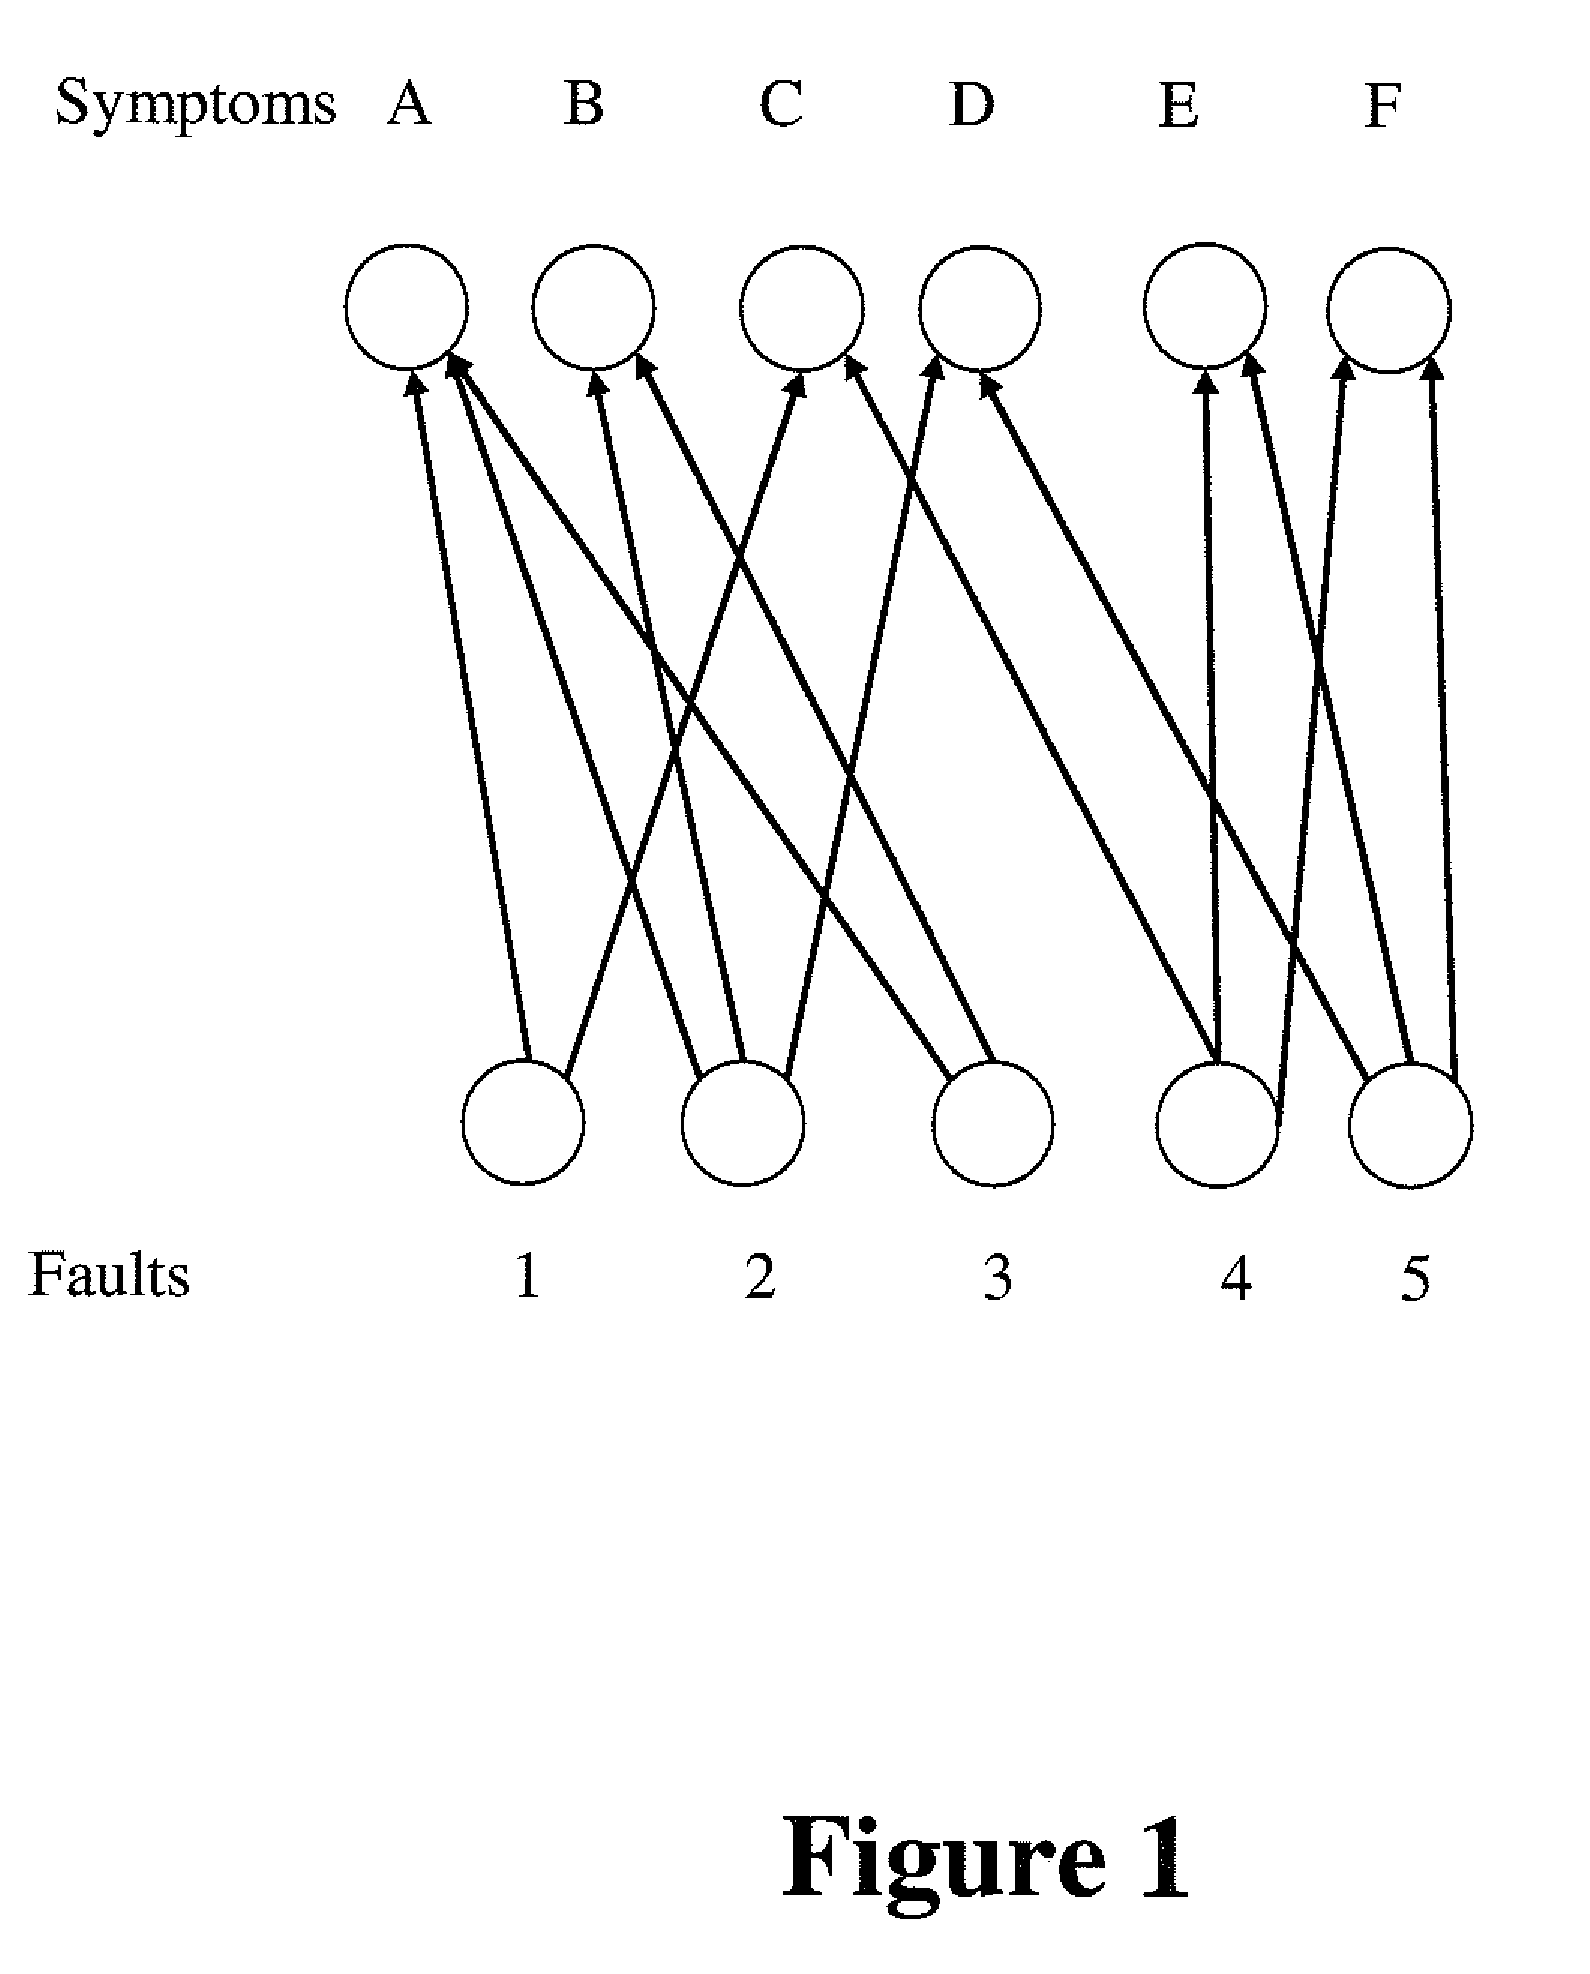
[0030]Referring now to the figures and to FIG. 1 in particular, there is shown the diagnostic problem represented by a bipartite graph. Nodes numbered 1, 2, 3, 4, and 5 represent five objects, each of which might fail (then becoming a fault) and nodes labeled A, B, C, D, E, and F which are six possible symptoms produced by the various faults. The directed links in the bipartite graph display the causal relation between objects and symptoms. For example, if Object 1 fails, symptoms A and C are activated. Symptom D could be activated by the failure of either Object 2 or Object 5, or both.

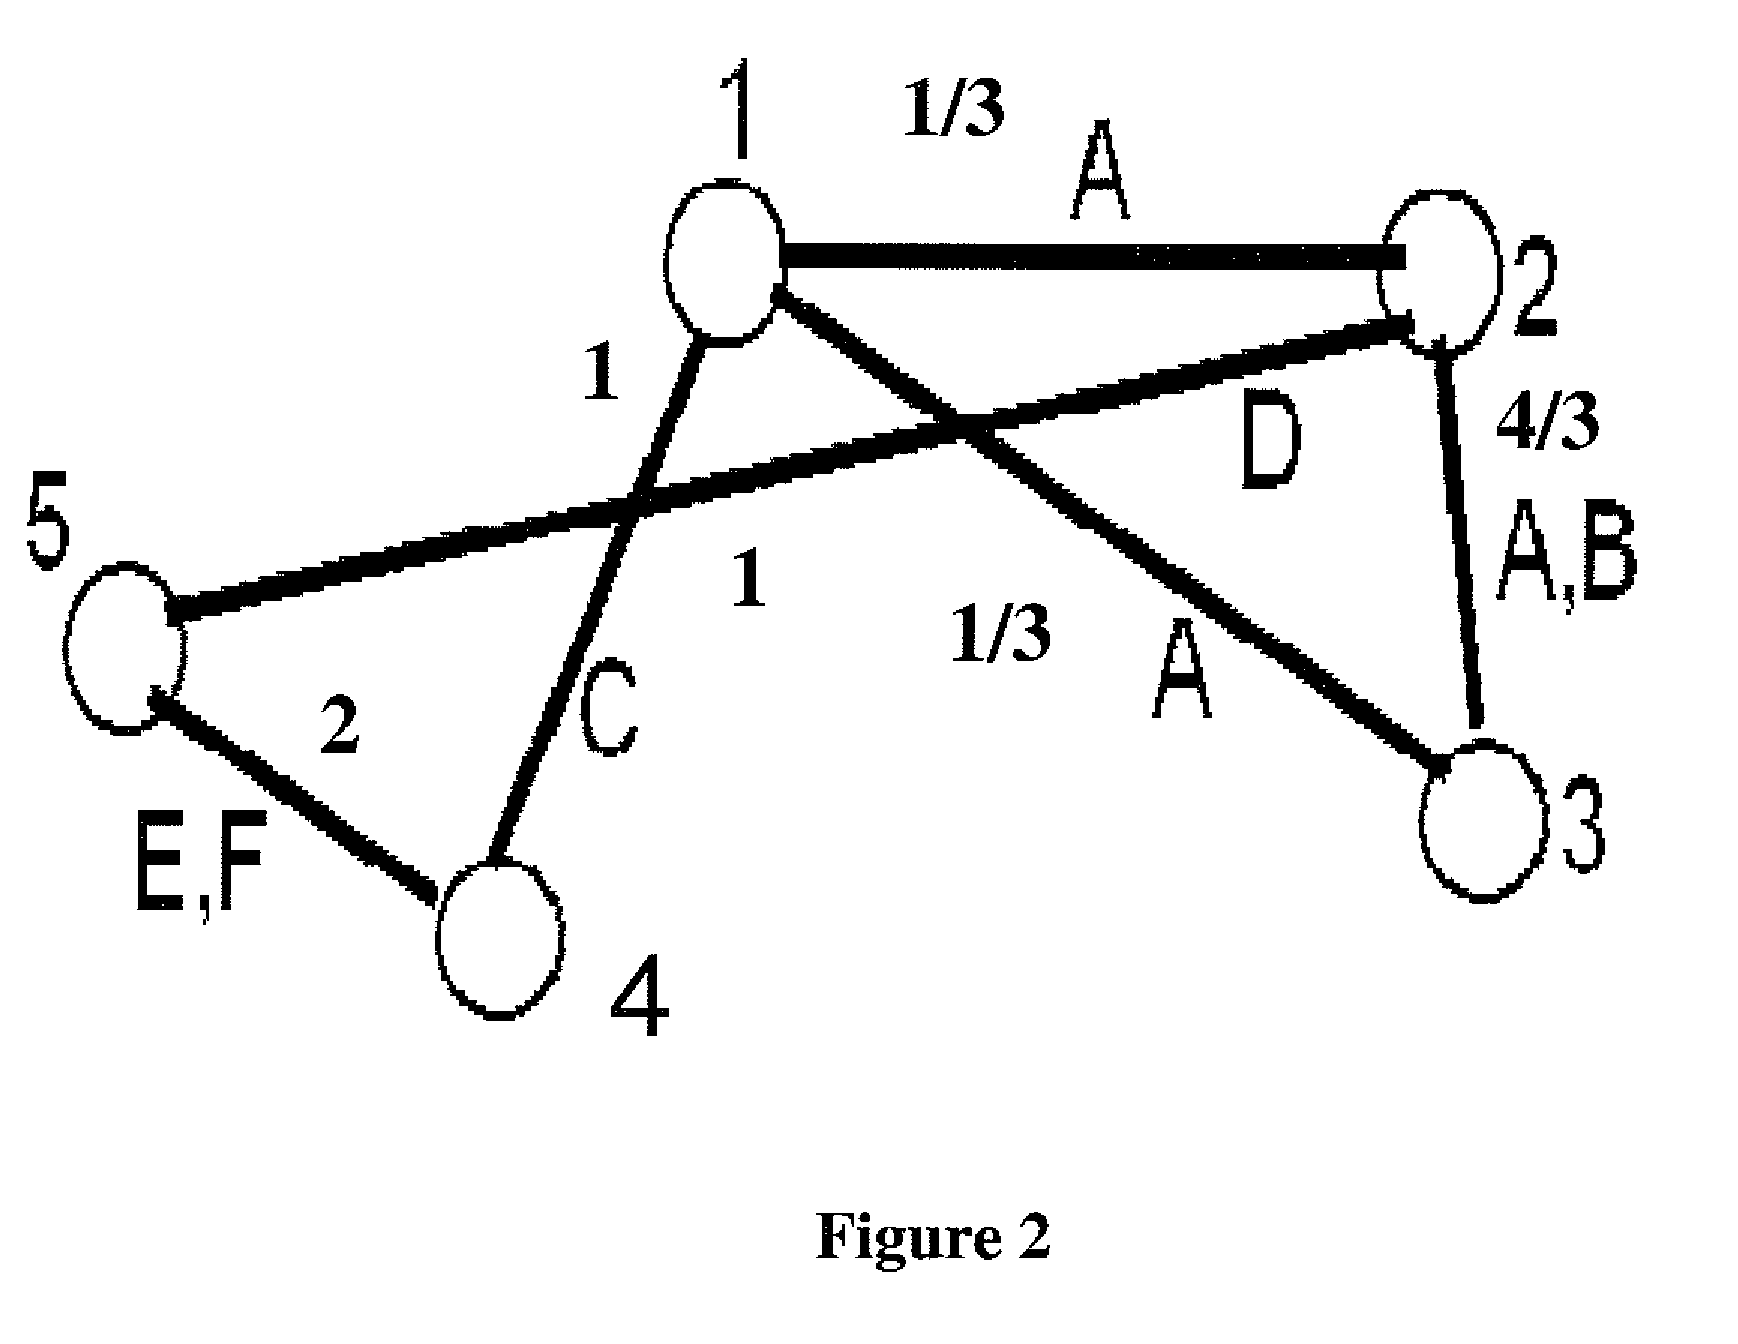
[0031]Referring to FIG. 2, there is shown the transformation of a bipartite graph of FIG. 1 into its associated relation graph. The objects 1, 2, 3, 4, 5 appear as nodes in the relation graph. FIG. 1 shows, for example, that faults 1 and 2 both cause symptom A; hence, the corresponding nodes in the relation graph of FIG. 2 are connected by a ‘relational link’. Similarly, since symptom A in FIG. 1 is a...


PUM


Abstract

A method for distributed computations for fault-diagnosis in a system whose fault propagation model has deterministic couplings between faults and symptoms includes creating a ‘relation graph’ in which the nodes correspond to the potential faults, with two nodes connected by a ‘relational link’ if their corresponding faults have an observed symptom in common. Each relational link is assigned a weight equal to the sum, taken over the symptoms represented by the relational link, of the reciprocal of the number of distinct fault-pairs that produce each such symptom. The relation graph is then partitioned into several domains, while minimizing the number of cross-domain relational links, which correspond to cross-domain symptoms. In each domain, all the optimal local solutions to the domain's sub-problem are first determined, and then a combination is selected of the local solutions, one from each domain, that explains the maximum number of cross-domain symptoms, where the optimal solution is supplemented, if necessary, with additional faults to explain any remaining unexplained cross-domain symptoms, determining also a bound on the deviation from optimality of the global solution.

Description

CROSS-REFERENCE TO RELATED APPLICATIONS[0001]This application claims the benefit of U.S. Provisional Application No. 61 / 062,718, filed on Jan. 29, 2008, which is incorporated by reference herein in its entirety.FIELD OF THE INVENTION[0002]The present invention relates to the diagnosis of faults in systems by means of inferences drawn from the symptoms produced by those faults. Specifically, the invention relates to distributed computations for fault-diagnosis carried out by partitioning the fault-to-symptom causality model of the system into computational domains and by coordinating the diagnoses obtained from the individual domains to produce a global diagnosis for the whole system.BACKGROUND OF THE INVENTION[0003]Modern societies depend on the smooth and error-free operation of large and complex technological systems, such as telecommunication networks and power plants. When failures affect the operation of such large systems, it is important to be able to diagnose the ‘root cause...

Claims


Application Information

Patent Timeline
Patent Type & Authority Patents(United States)
IPC IPC(8): G06F17/00G06N5/02
CPCG06F11/079H04L41/065H04L41/0677G05B23/0248G06F11/0706Y04S40/166Y04S40/00
Inventor KRISHNAN, KOMANDUR R.LUSS, HANANSHALLCROSS, DAVID F.NEIDHARDT, ARNOLD L.
Owner TELCORDIA TECHNOLOGIES INC
Why Eureka
Try Eureka