System and method of evaluating crop management

a crop management and system technology, applied in the field of system and method of crop management, can solve the problems of few computer-based tools to help, crop management decisions can become quite complex for a grower or agronomist, and the algorithms employed in certain known software are not utilized as predictive tools for growers, so as to achieve simple and reliable evaluation and improve yield

Active Publication Date: 2012-12-18
BLUE LEAF I P INC
View PDF10 Cites 7 Cited by
  • Summary
  • Abstract
  • Description
  • Claims
  • Application Information

AI Technical Summary

Benefits of technology

[0008]The present invention provides a method of and a system used for a predictive evaluation tool in making crop stand quality management decisions. The method and system of the invention provide a simple and reliable evaluation tool that can be utilized by growers or sales people with very little or no agronomic science background. The system also provides a tool to predictive a difference in yield and profit associated with implementing different plant stand management strategies. In addition, the method and system of the invention can be configured to be utilized with management strategies to improve yield associated with growing a wide variety of crops (e.g., soybean, beets, etc.) or agricultural animals (e.g., sheep, pigs, chickens, etc.).
[0010]In a preferred embodiment, the mathematical model is expressed as the following representation:Net Effective Plant Pop.=[(TPi−Σ(nsi*si+nmi*mi)) / TPi]*(Benchmark Plant Pop.)wherein (i) represents an identifier of the sampling sub-area, (TPi) represents a total number of plants in the sampling sub-area, (nsi) represents number of plants in sampling within a predetermined spacing of the nearest neighboring plant that differs from a benchmark spacing, (si) represents a predicted deduction factor in yield potential dependent on spacing, (nmi) represents number of plants in the sampling sub-area within a predetermined maturity below a benchmark maturity, and (mi) represents a predicted deduction factor in yield potential dependent on maturity. The method further includes the steps of calculating a predicted yield of the plant population equal to the net effective plant population multiplied by a benchmark yield per individual plant, and displaying the predicted yield to the user. The method further includes the steps of calculating a predicted yield loss equal to a difference between the predicted yield of the plant population and a benchmark yield for the plant population. The benchmark yield is equal to the benchmark plant population multiplied by the benchmark yield per individual plant. The predicted yield loss is displayed to the user. The method further includes receiving a crop market price data per yield of the plant, and calculating a cost of the yield loss equal to the crop market price data multiplied by the predicted yield loss, and displaying the cost of the yield loss to the user.

Problems solved by technology

These crop management decisions can become quite complex for a grower or agronomist to make.
Unfortunately, there are few computer-based tools to help growers make these critical decisions.
However, the algorithms employed in these certain known software are not utilized as a predictive tool for growers to make crop management decisions.
However, these certain known software tools are not are not capable of assisting growers as a predictive evaluation tool in making crop stand quality management decisions (e.g., soil bed preparation, planting spacing, planting date).

Method used


Image

  • System and method of evaluating crop management
  • System and method of evaluating crop management
  • System and method of evaluating crop management

Examples


Embodiment Construction

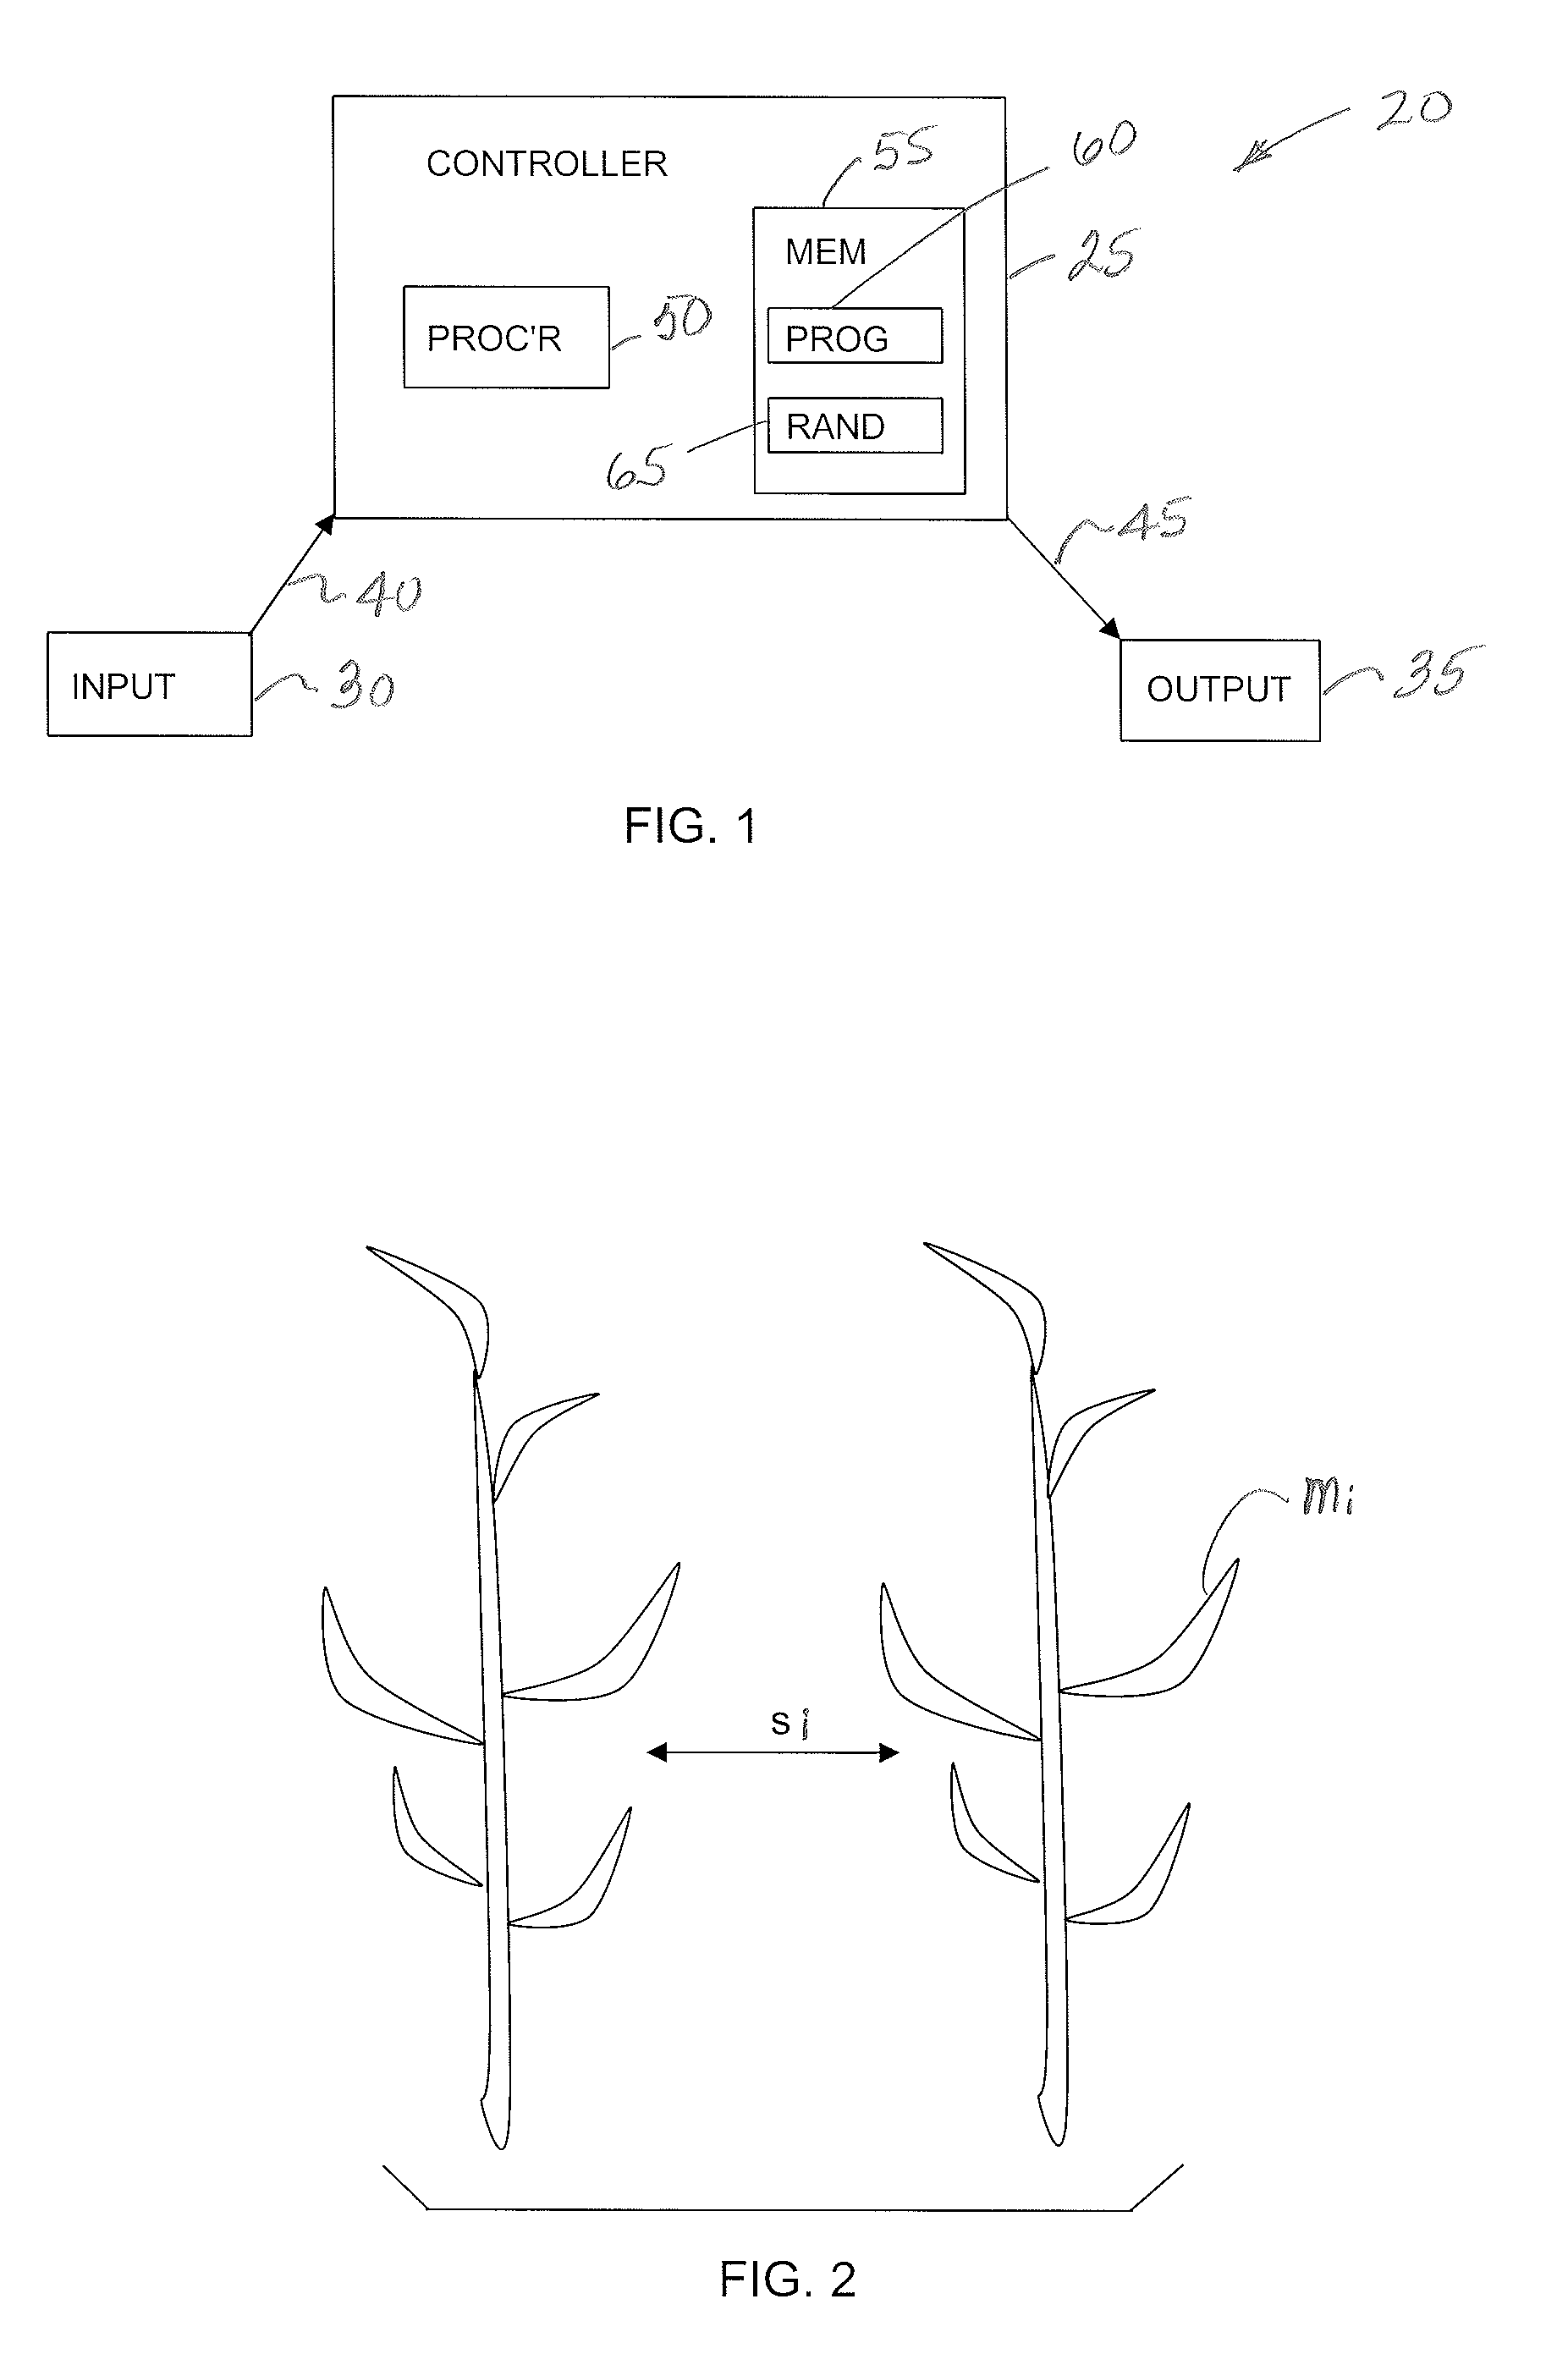
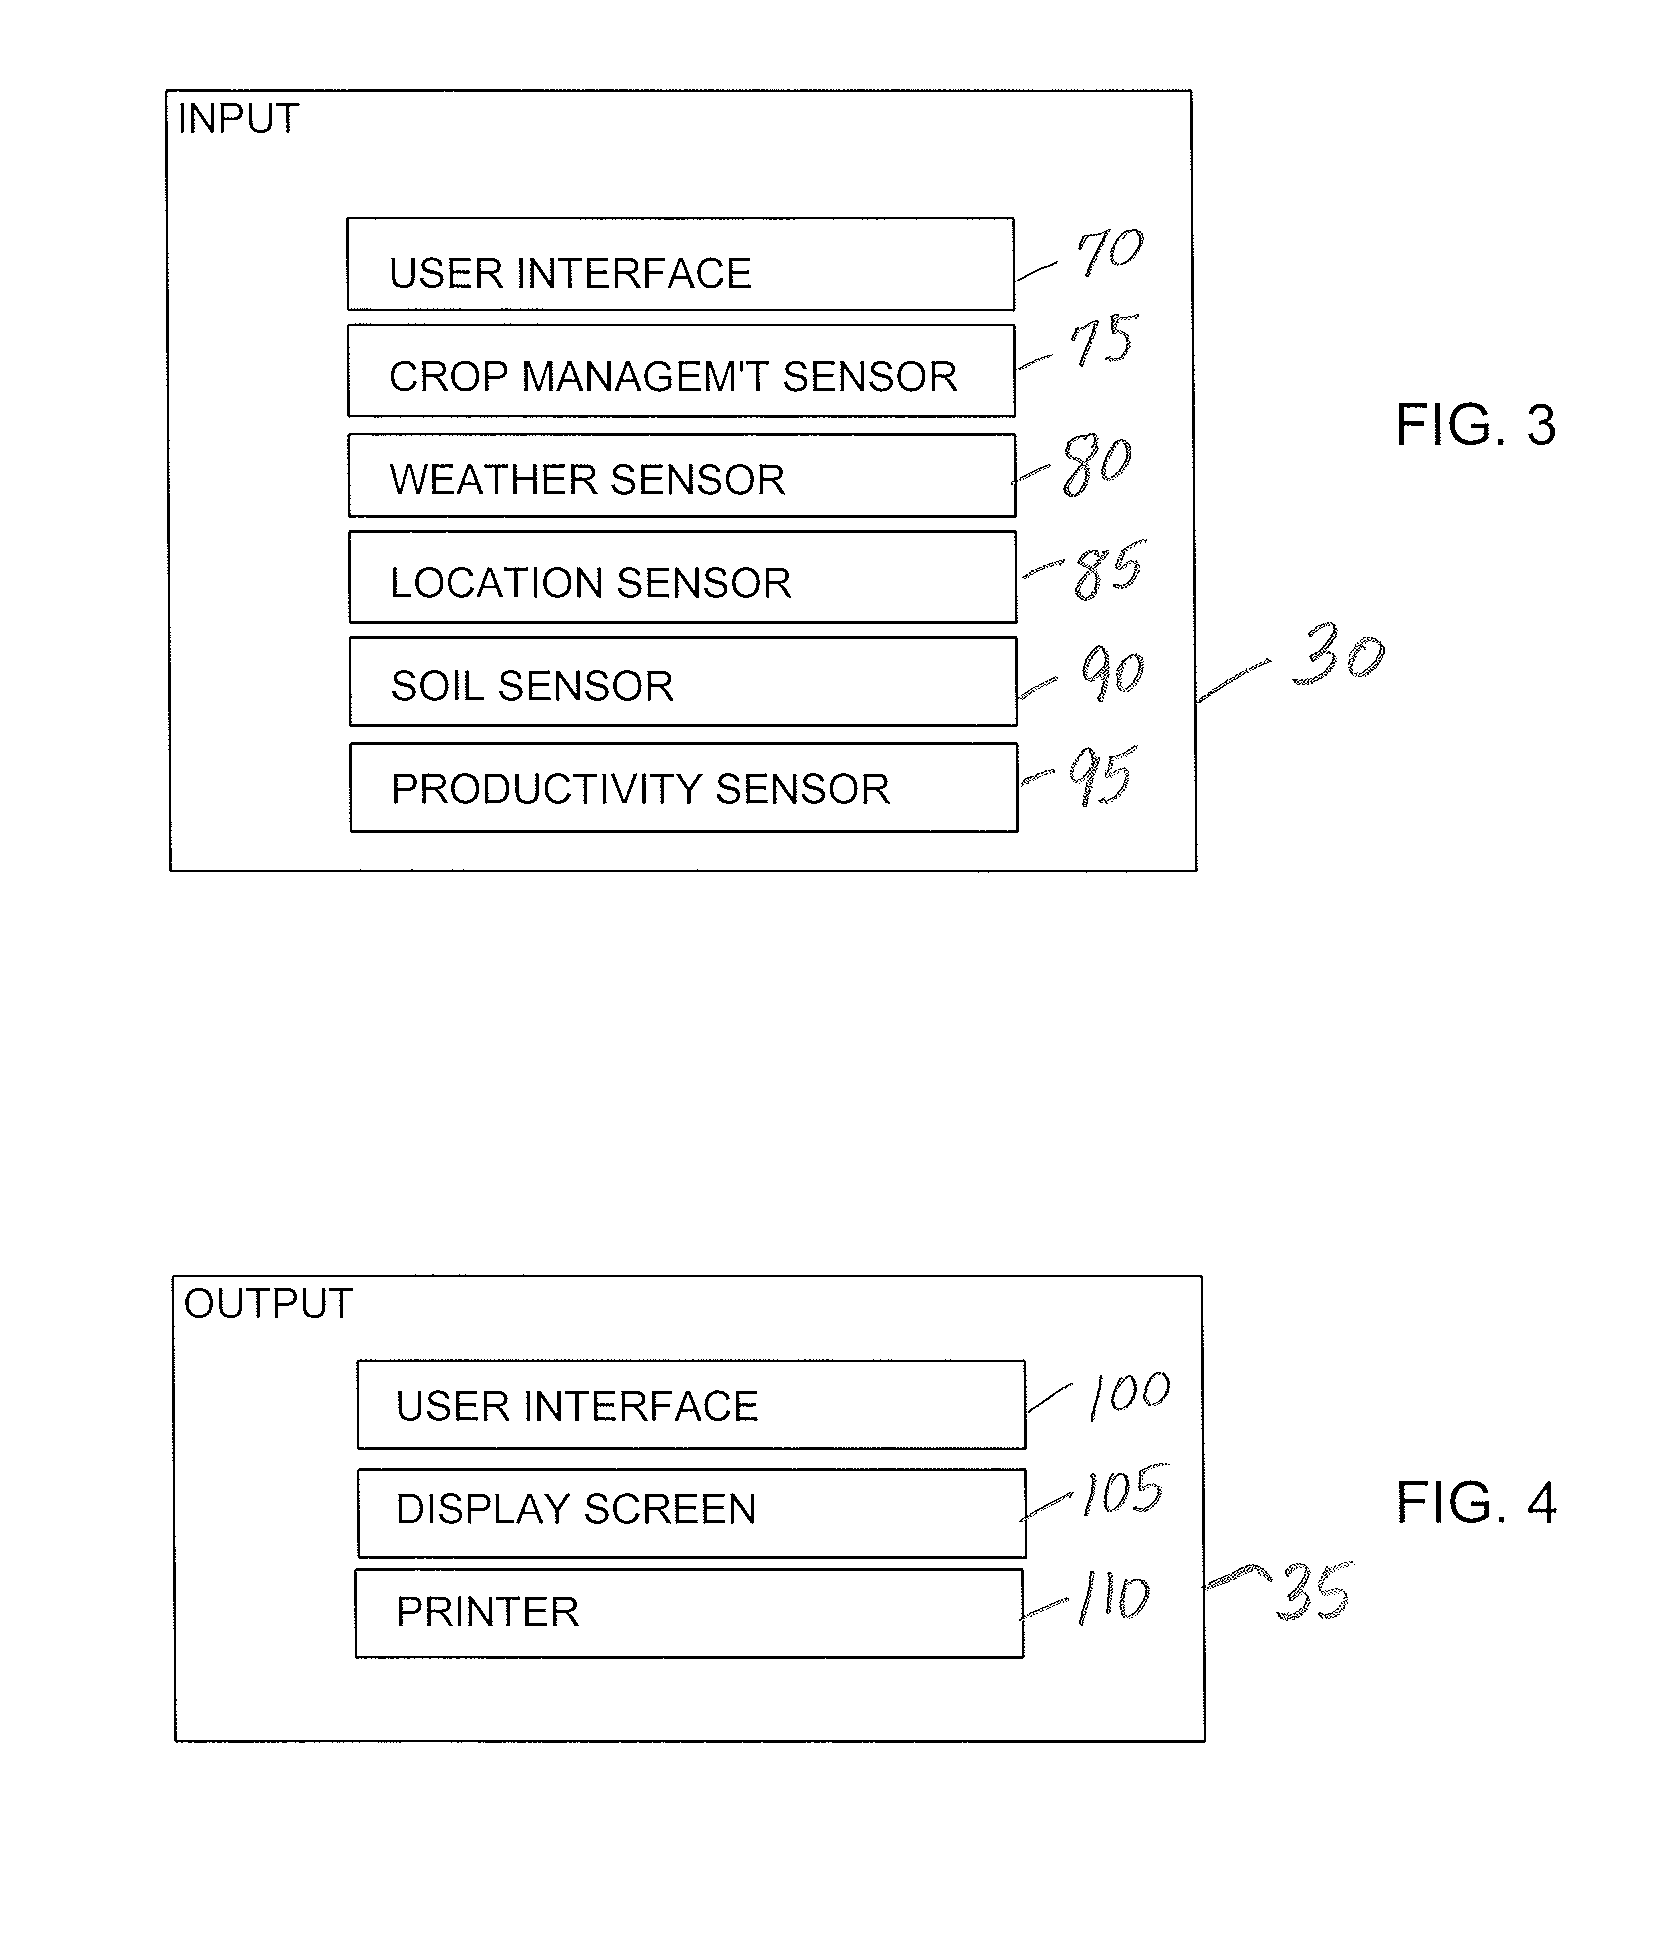
[0021]FIG. 1 illustrates a preferred embodiment of a crop management system 20 in accordance with the present invention. The crop management system 20 generally includes a controller 25 in communication with one or more inputs or input devices 30 capable of providing input data to the controller 25. The controller 25 is also in communication with one or more outputs or output devices 35 operable to provide a predictive tool to the user. Each input device 30 and output device 35 are configured to communicate with the controller via various types of communication links 40 and 45, respectively, including an internet connection, a wireless connection, a wire-connection, or other know medium of communication.

[0022]Still referring to FIG. 1, the controller 25 generally includes a processor 50 and a memory 55 configured to store a software program or program code instructions to be executed by the processor 50. The controller 25 is configured to output data to the output device 35 for disp...


PUM

PropertyMeasurementUnit
miaaaaaaaaaa
transmissionaaaaaaaaaa
weightaaaaaaaaaa

Abstract

A method of and system for evaluating performance of a plant population in an area of interest is provided. The method includes the steps of receiving input data from a user, the input data representative of at least one management parameter in the group consisting of: a total plant population in a selected sampling sub-area, a spacing of an individual plant relative to a nearest adjacent plant in the sampling sub-area, and a maturity of the individual plant relative to the nearest adjacent plant in the sampling sub-area. The system analyzes the input data in accordance with a mathematical model having an objective function for predicting a performance of a plant stand represented by a net effective plant population reduced from a benchmark plant population by deduction factors related to at least one of the management parameters.

Description

RELATED APPLICATIONS[0001]Not applicable.BACKGROUND OF THE INVENTION[0002]1. Field of the Invention[0003]The invention relates to a system for and method of evaluating crop performance, and more specifically, relates to a system operable to evaluate performance on an individual plant basis.[0004]2. Discussion of Related Art[0005]Growers are continually pursuing strategies that will improve the yield and profit of their planted crops. In addition to assessing uncontrollable factors such as weather and markets, cropping strategies must also consider and understand controllable factors, such as field operations. The field operations can include the type of tillage, the spacing between plants, and the planting date of the crop. Careful planning and management decisions are critical for profitable growers. These crop management decisions can become quite complex for a grower or agronomist to make.[0006]Unfortunately, there are few computer-based tools to help growers make these critical ...

Claims


Application Information

Patent Timeline
Patent Type & Authority Patents(United States)
IPC IPC(8): G01N33/48G06G7/48
CPCA01B79/005G06Q10/06G06Q50/02
Inventor PRUETT, MICHAEL A.PRELLER, WILLIAM E.SIMPSON, DALE A.
Owner BLUE LEAF I P INC
Why Eureka
Try Eureka