
Analyzing spectral data for the selection of a calibration model

a calibration model and spectral data technology, applied in the direction of material analysis through optical means, computation using non-denominational number representations, instruments, etc., can solve the problems of time-consuming optimisation and calibration, difficult visual interpretation, and the need to calibrate the nir system, so as to achieve convenient and convenient use.

Inactive Publication Date: 2013-07-23
UNIV LIEGE +1
View PDF1 Cites 6 Cited by
  • Summary
  • Abstract
  • Description
  • Claims
  • Application Information

AI Technical Summary

Benefits of technology

[0011]It is an advantage of the present invention that it provides a convenient and easy to use possibility for selecting a calibration model from a plurality of possible calibration models. The present invention provides apparatus and methods for selecting a calibration model only based on calibration data using statistical resampling methods (e.g. cross-validation, bootstrapping).
[0012]Each calibration model correlates confirmed measured values of a physical or chemical parameter, such as granulometry, polymorphism, moisture content, ingredient content with observed spectra, such as infrared (IR), near infrared (NIR), Raman spectra, obtained during calibration experiments. Data pretreatment and regression methods provide the calibration model that will be used in future routine use with any new spectrum corresponding to an unknown amount of physical or chemical parameter to determine. In this context, the invention will provide a method to analyze spectral data and to select the best calibration model from a plurality of given calibration models.
[0013]To fulfill this objective, resampling methods such as cross-validation or bootstrapping can be used. The first method (cross-validation) involves a partition of the calibration data, with or without pretreatment(s), into complementary subsets. Regression is made on one subset (calibration set) while the results are tested on the other subset (monitor set or test set). Iteratively, different partitions can be used to globally assess the predictive quality of the regression models as long with the data pretreatments. The second method (bootstrapping), involving resampling with replacement of calibration data, with or without pretreatment, can be used as well to assess the quality of the models for prediction along with data pretreatment.
[0014]This object is solved by the subject matter of independent claim 1. Preferred embodiments are defined in the sub claims.
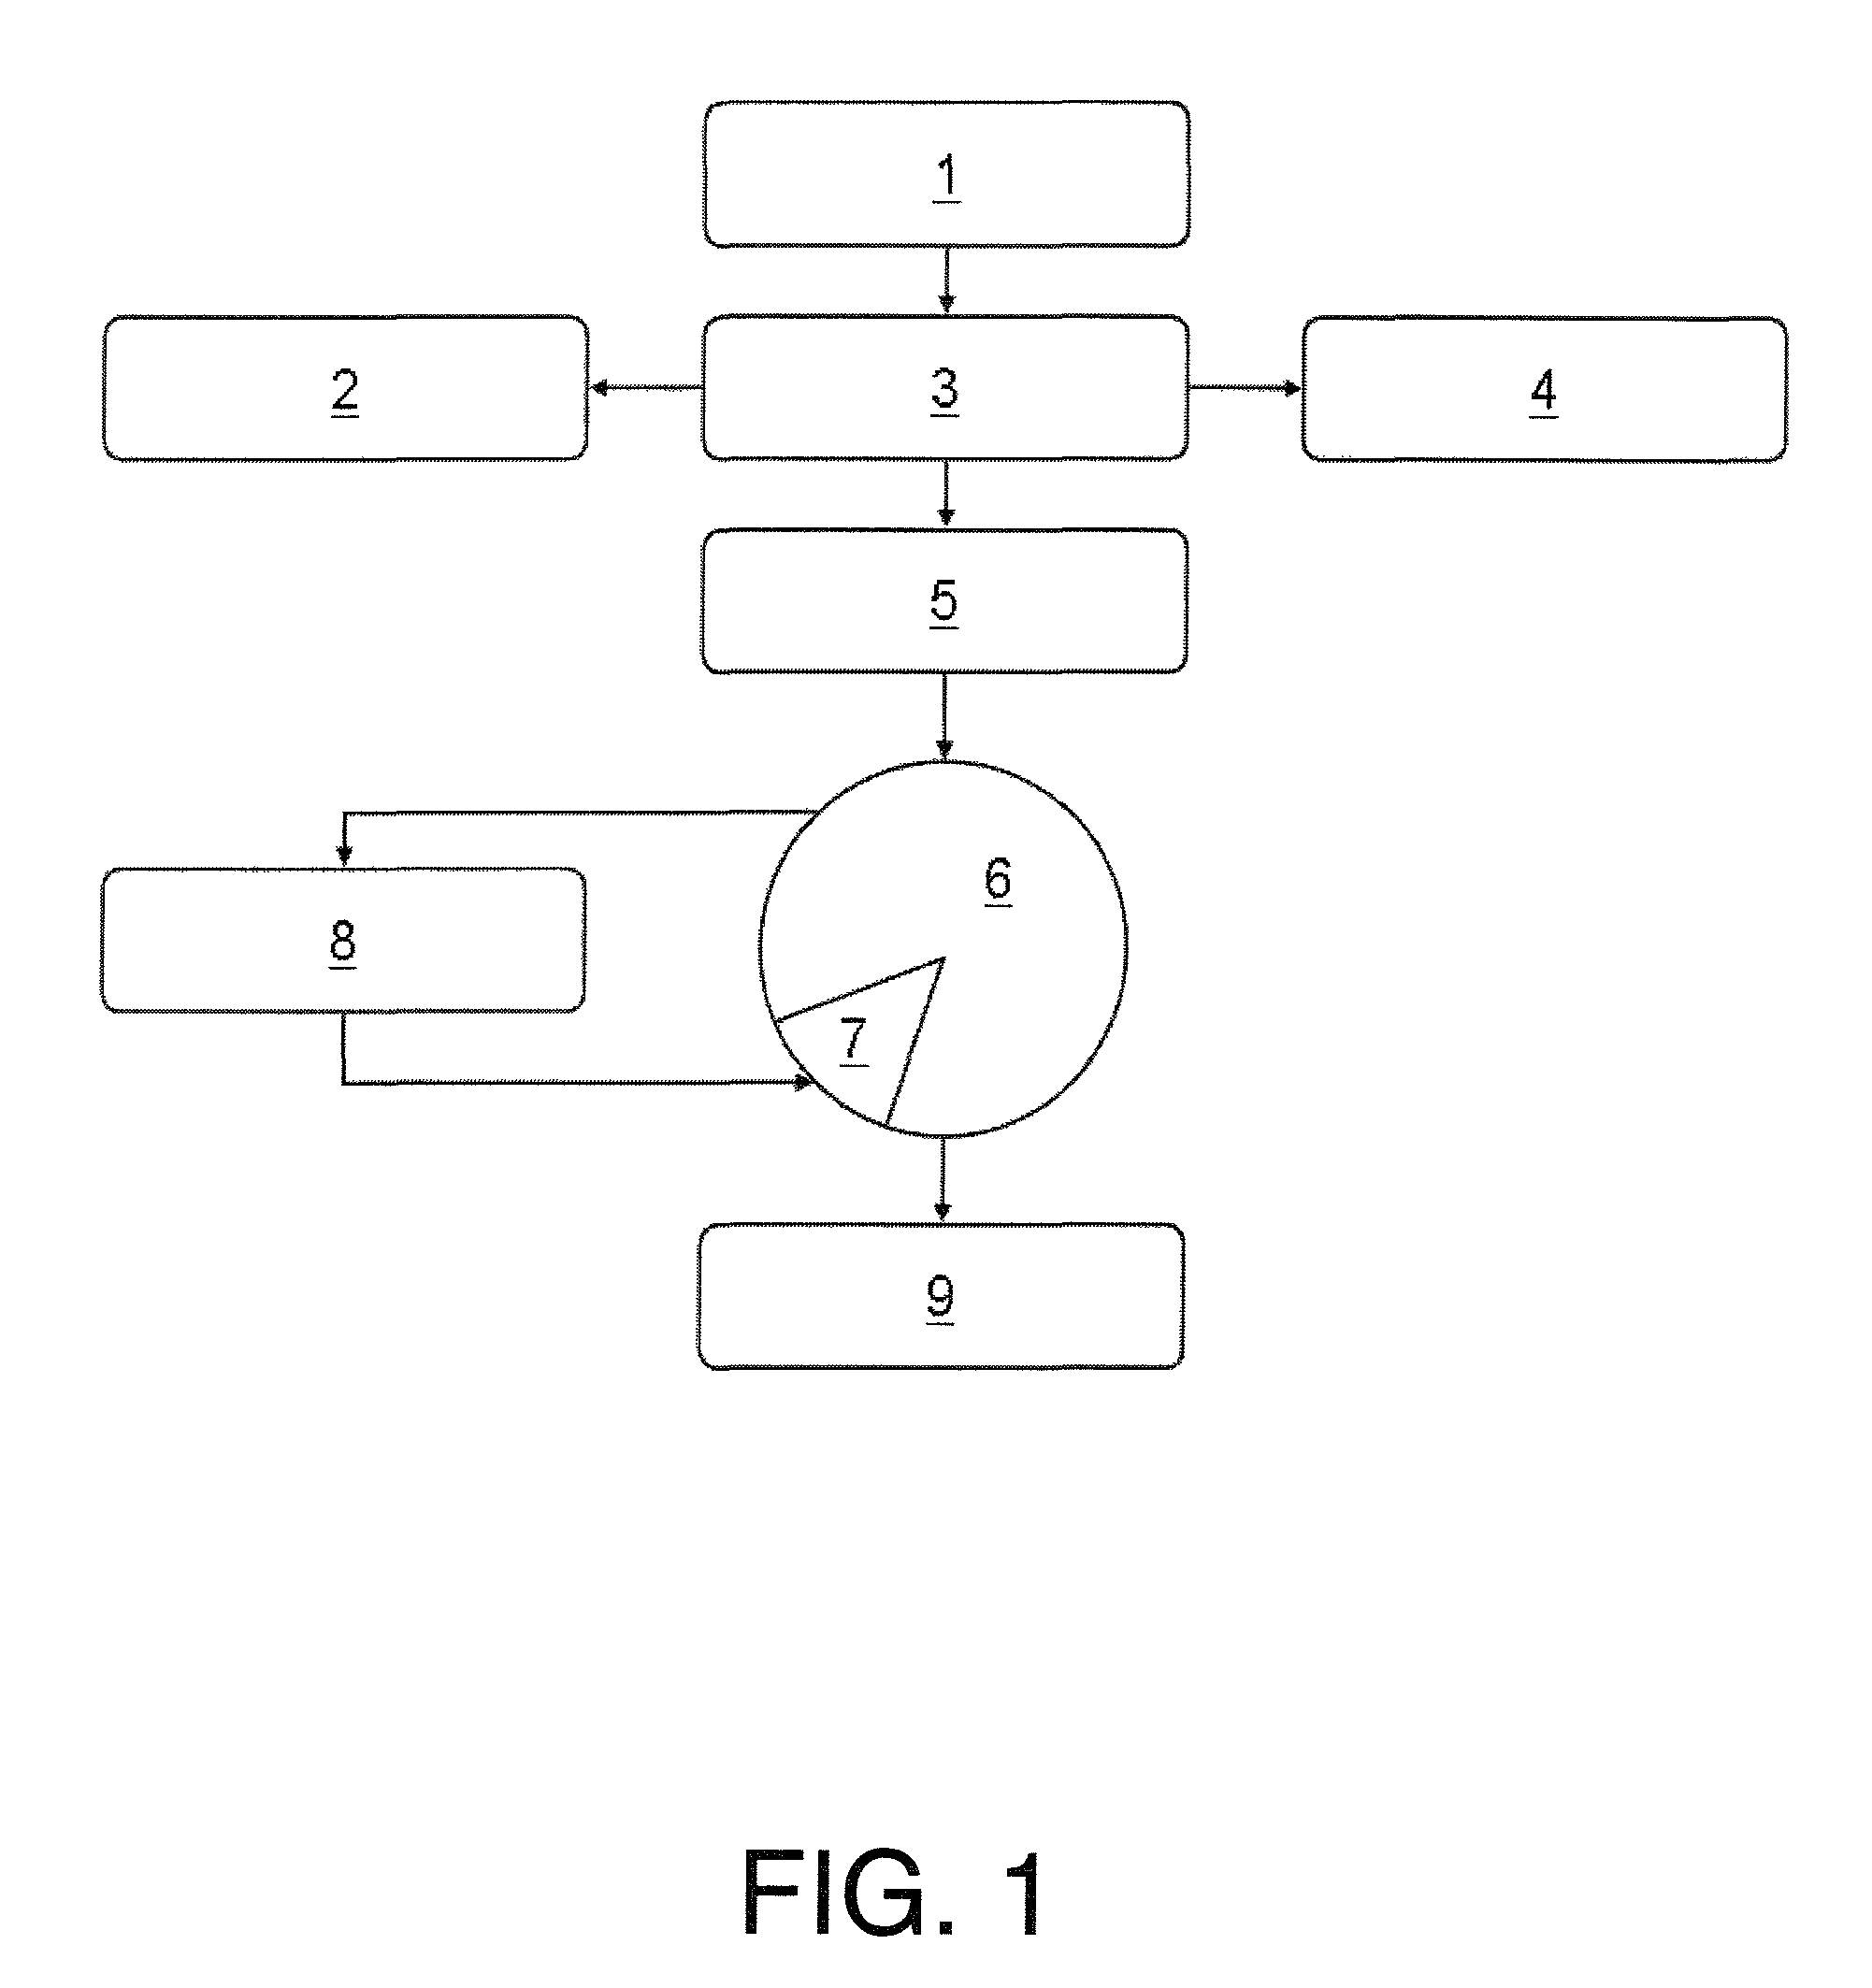
[0015]This object is achieved by a method of analyzing spectral data for the selection of a calibration model, relating spectra of a substance to a physical or chemical parameter of the substance, over a predetermined range of the physical or chemical parameter, preferably the predetermined range of the physical or chemical parameter comprises at least three levels, comprising the steps:
[0016]a) capturing spectral data of the substance with respective values of the physical or chemical parameter over the predetermined range,

Problems solved by technology

However, each technique has its drawbacks:
In general, it is a problem that the NIR system must be calibrated.
Optimisation and calibration are time-consuming tasks because the development of the predictive model has to take into account the use of a suitable reference method (e.g. chromatography, titration) to assign quantitative values of the chemical or physical parameter of interest for the spectral data.
Moreover, due to the great quantity of physical and chemical information included in the NIR spectra, a visual interpretation is difficult.
In the pharmaceutical field, conformity analyses realized between batch production and batch release can be time consuming if all of them are performed after the manufacturing process.

Method used

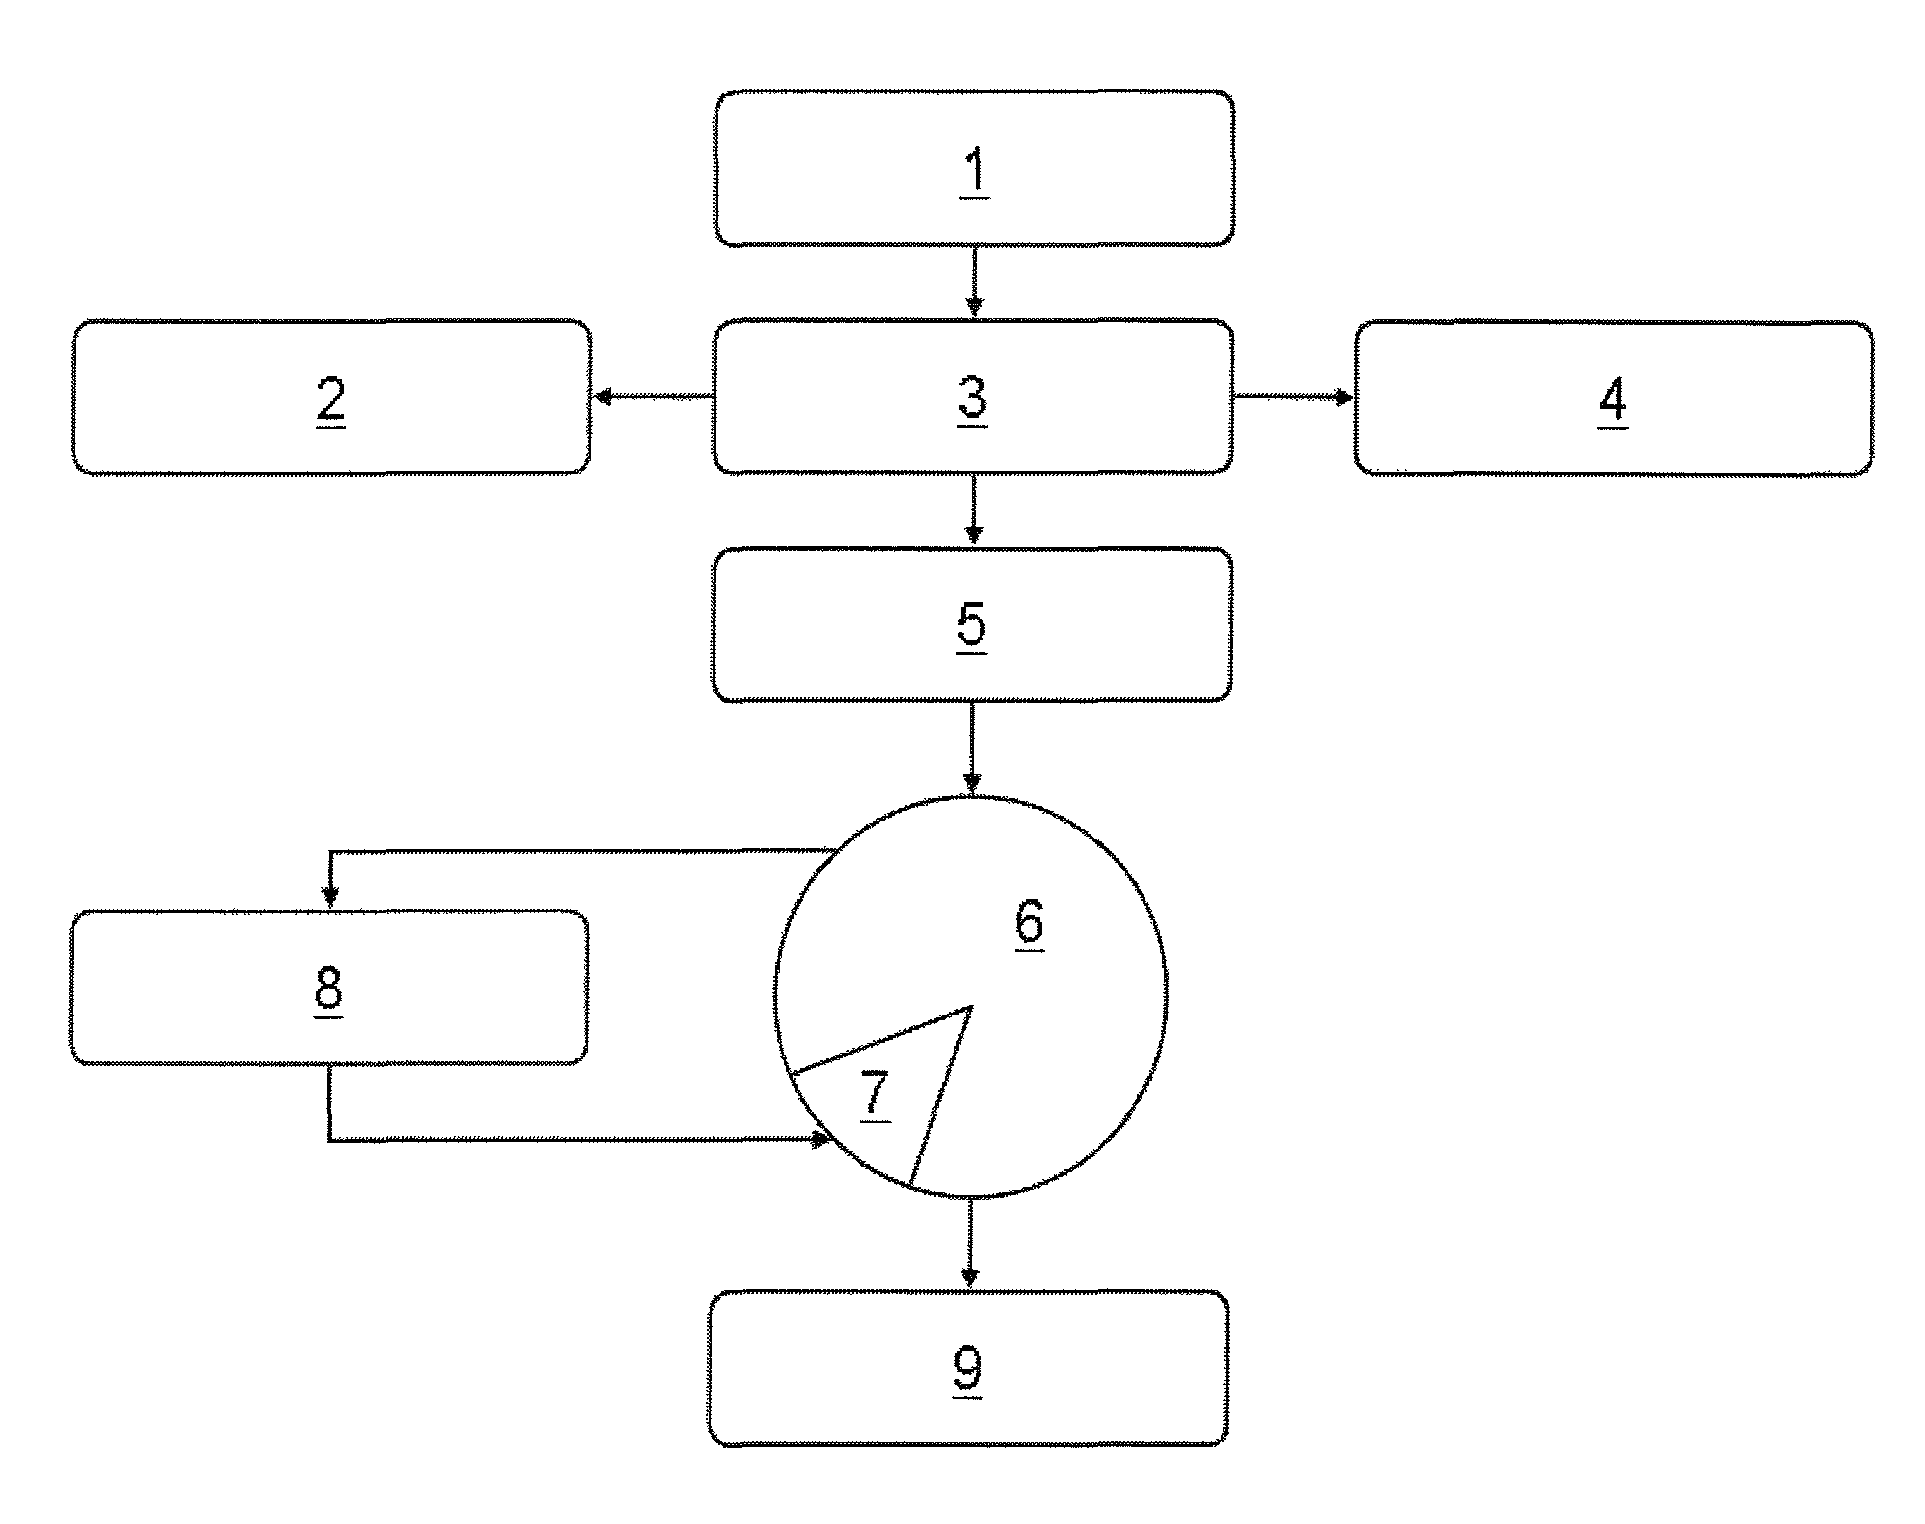

Image

  • Analyzing spectral data for the selection of a calibration model
  • Analyzing spectral data for the selection of a calibration model
  • Analyzing spectral data for the selection of a calibration model

Examples


Embodiment Construction

[0044]Embodiments of the present invention will be described in detail with respect to certain drawings but the invention is not limited thereto. For illustrative purposes, most of the drawings are schematic, therefore, the size of the elements are not drawn to scale. Where the term “comprising” is used in the present description and claims, it does not exclude other elements or steps. Where an indefinite or definite article is used when referring to a singular noun e.g. “a” or “an”, “the”, this includes a plural of that noun unless something else is specifically stated.

[0045]The term “comprising”, used in the claims, should not be interpreted as being restricted to the means listed thereafter; it does not exclude other elements or steps. Thus, the scope of the expression “a device comprising means A and B” should not be limited to devices consisting only of components A and B. It means that with respect to the present invention, the only relevant components of the device are A and ...


PUM


Abstract

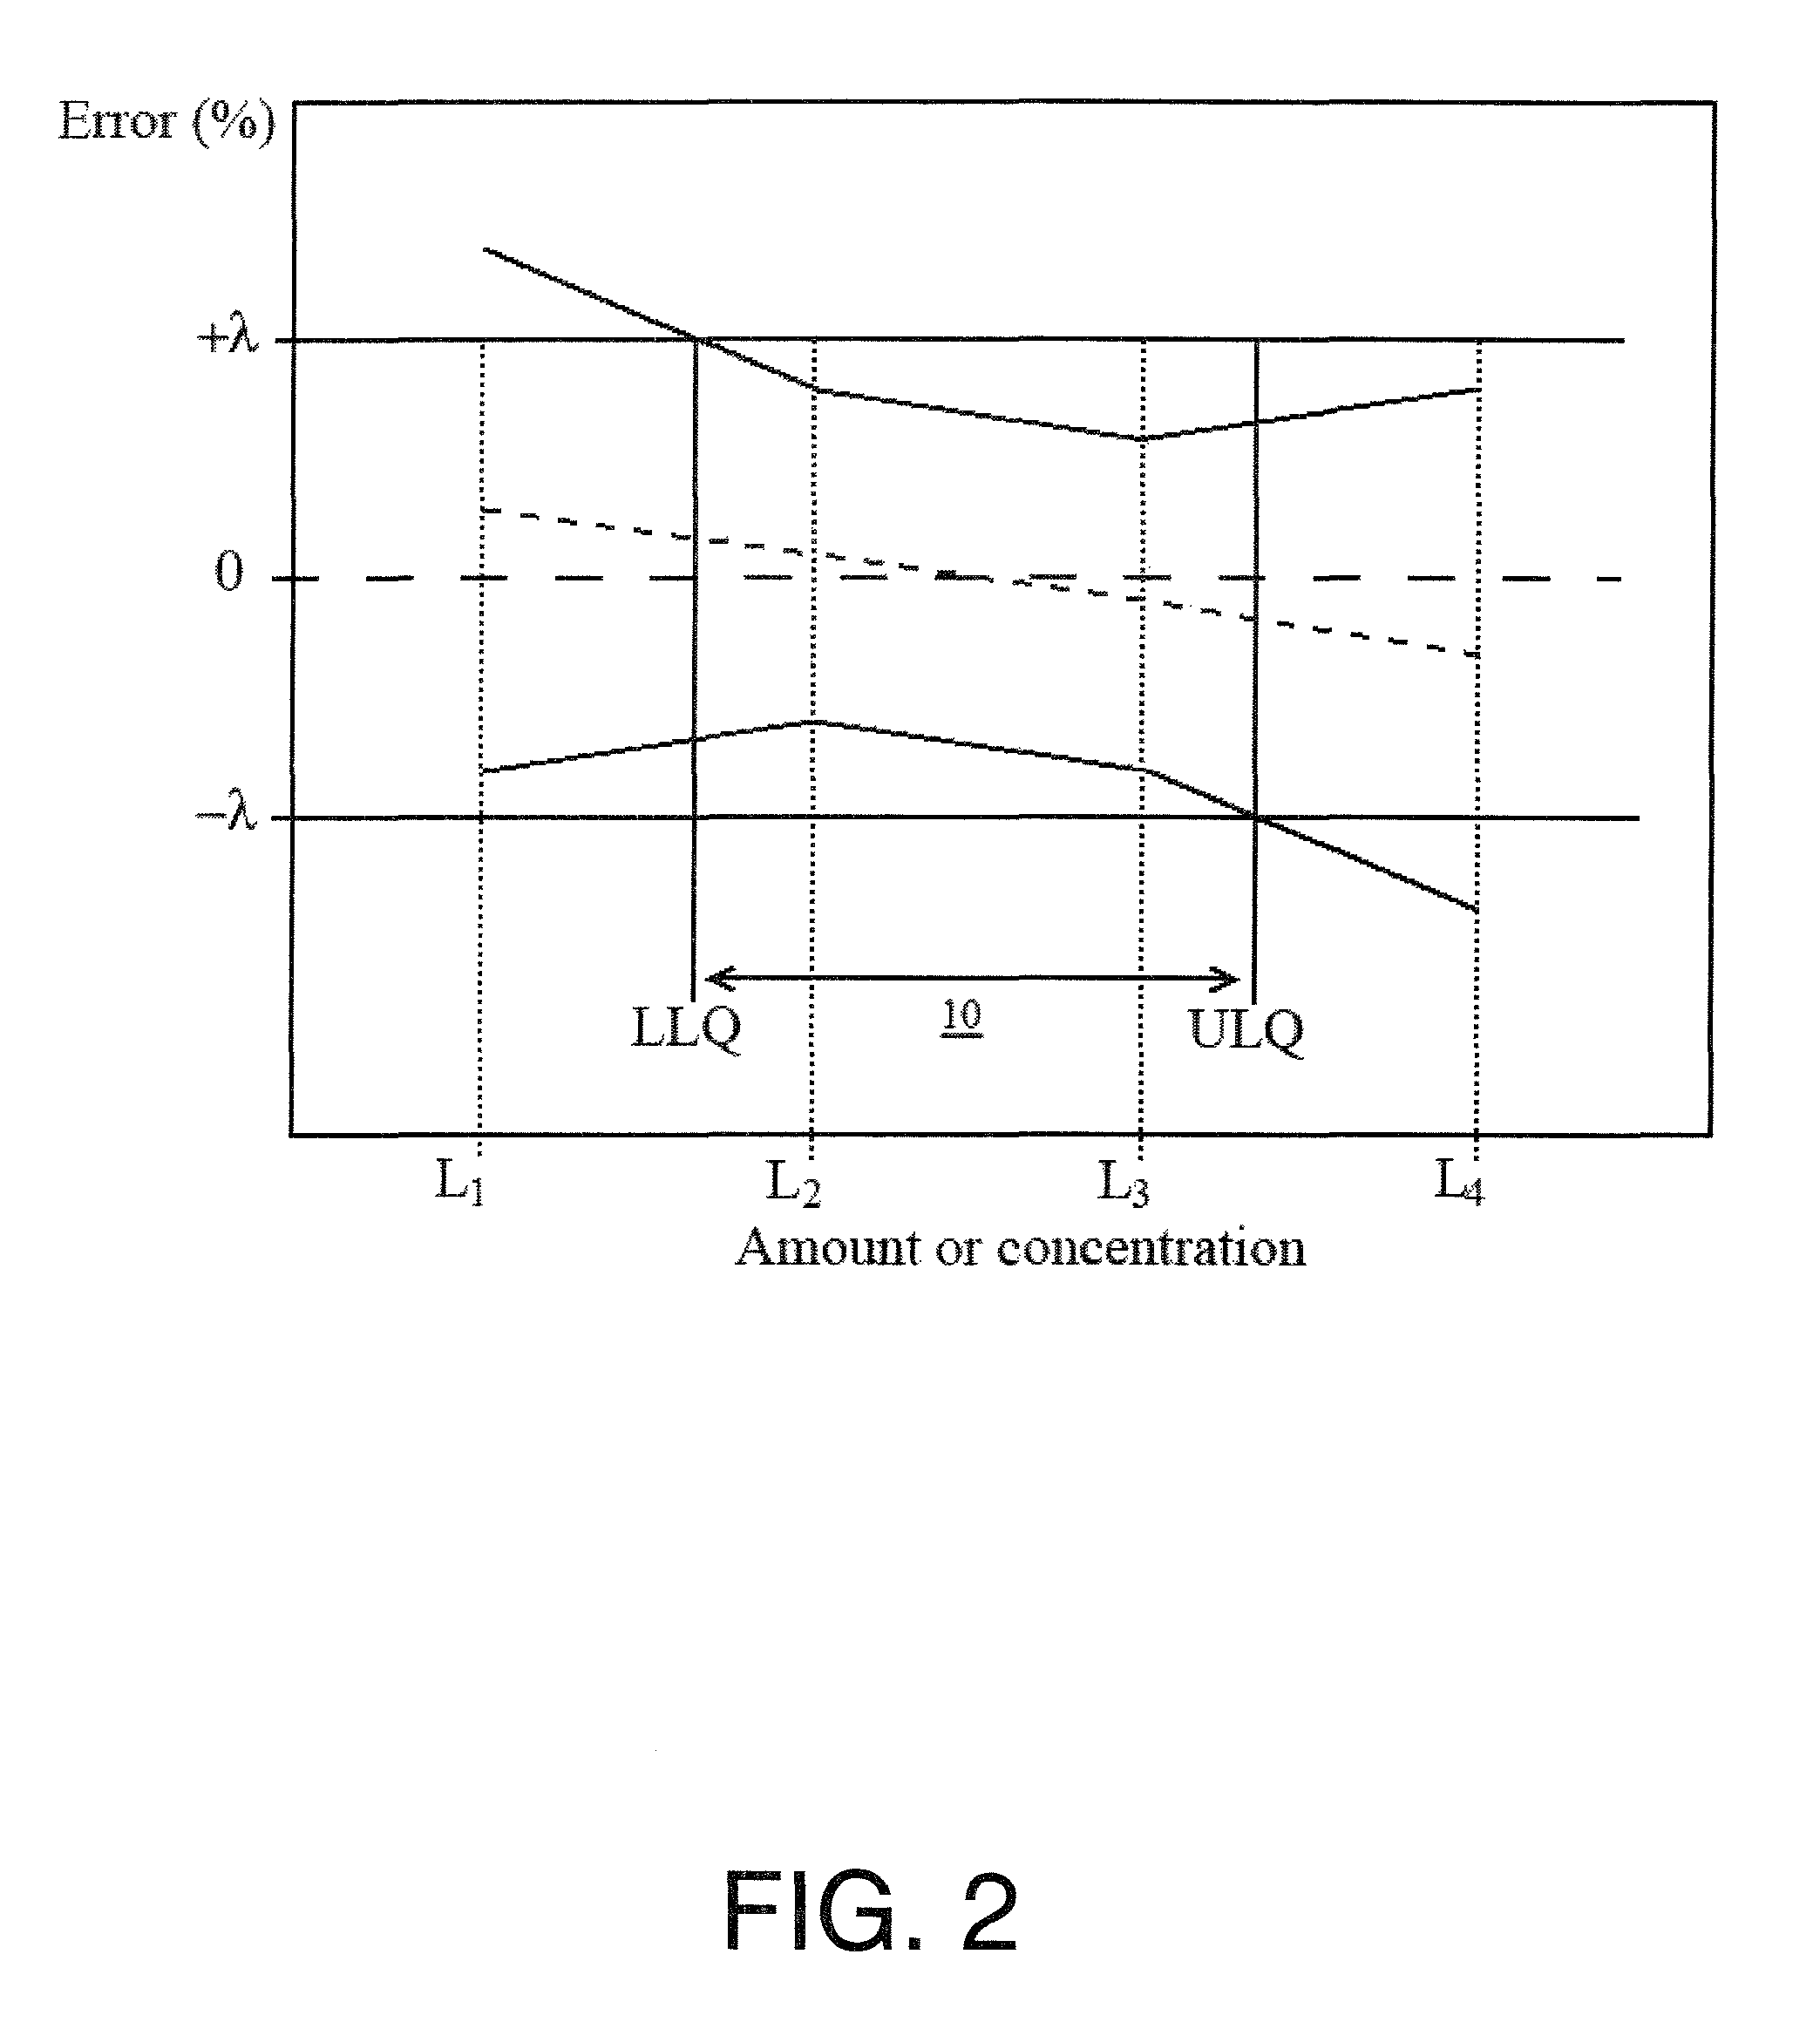
The invention relates to a method of analyzing spectral data for the selection of a calibration model, relating spectra of a substance to a physical or chemical parameter of the substance, over a predetermined range of the physical or chemical parameter, comprising the steps: a) capturing spectral data of the substance with respective values of the physical or chemical parameter over the predetermined range, b) creating a plurality of calibration models using the captured spectral data in dependence upon the values of the physical or chemical parameter based on the calibration data using statistical resampling methods, c) calculating tolerance intervals of the results at each reference level for each calibration model, and d) displaying the tolerance intervals at each reference level over the predetermined range for each calibration model. In this way, a possibility for analyzing spectra data is provided which is useful in spectroscopic applications for automated calibration model selection and makes analytical interpretation and evaluation easier and more accurate.

Description

[0001]This is a national stage of PCT / EP09 / 055,504 filed May 6, 2009 and published in English, which has a priority of European no. 08157099.6 filed May 28, 2008, hereby incorporated by reference.FIELD OF THE INVENTION[0002]The present invention relates to the field of analyzing spectral data for the selection of a calibration model, relating spectra of a substance to a physical or chemical parameter of the substance over a predetermined range of the physical or chemical parameter. In particular, the present invention relates to apparatus, methods and software for analyzing spectral data for the selection of a calibration model, and / or relating spectra of a substance to a physical or chemical parameter of the substance over a predetermined range of the physical or chemical parameter.BACKGROUND OF THE INVENTION[0003]It is generally known that one type of spectroscopy can be defined as a study of electromagnetic wave interactions with material. When electromagnetic radiation such as l...

Claims


Application Information

Patent Timeline
Patent Type & Authority Patents(United States)
IPC IPC(8): G06F17/10
CPCG01N21/274G01N21/359G01N21/3554G01N2201/129
Inventor HUBERT, PHILIPPEZIEMONS, ERICMOONEN, FRANCOIS
Owner UNIV LIEGE
Learn More