Q tomography method

a tomography and wave-equation technology, applied in the field of seismic data processing and q tomography, can solve the problems of inability to meet the requirements of 3d cases, inability to meet the requirements of minimum approximations and maximum flexibility, and significant errors

Active Publication Date: 2013-10-08
EXXONMOBIL UPSTREAM RES CO
View PDF25 Cites 6 Cited by
  • Summary
  • Abstract
  • Description
  • Claims
  • Application Information

AI Technical Summary

Benefits of technology

[0017]In one embodiment, the invention is a ray-based, centroid frequency shift Q tomography method for reconstructing subsurface depth models for 1 / Q from seismic data measured by receivers in a survey using a seismic source, comprising selecting a mathematical function to approximate the seismic source's amplitude spectrum in order to calculate the spectrum's centroid frequency shift due to earth attenuation, and relating said centroid frequency shift to attenuation as represented by the reciprocal of quality factor Q, and solving for Q or 1 / Q by iterative, linear optimization, wherein the optimization has box constraints to keep estimated Q values within position-dependent ranges specified by upper boundaries and lower boundaries. The constrained optimization may be solved by a multi-index active-set method that allows updates of the active set by multiple grid indices at a time, wherein a grid index denotes subsurface location. The selected mathematical function may be a frequency-weighted exponential function of frequency. Use of this function to approximate the seismic source's amplitude spectrum will be advantageous whether or not box constraints are used in the optimization.
[0018]The reconstructed subsurface Q model produced by the present inventive method may be advantageously used, among other things, in seismic imaging to compensate for the amplitude dimming, frequency loss, and phase distortion effect caused by the viscoacoustic overburden, such as a gas reservoir. By including the more accurate Q model provided by the present invention in seismic imaging procedure, the quality of the geological structure image can be improved significantly. In addition, the reconstructed Q model will be beneficial in reservoir characterization applications because Q is very sensitive to some rock and fluid properties such as fluid saturation and porosity. In such applications, the invention becomes a method for hydrocarbon exploration, development or production.

Problems solved by technology

Wave-equation-based tomography is physically more accurate but computationally expensive and not practical for 3D cases.
One major problem with Q tomography is how to establish the link between Q models and seismic data with minimum approximations and with maximum flexibility.
However, the conventional centroid frequency shift method can use only Gaussian, boxcar, or a triangular function to fit the source amplitude spectrum, which introduces significant error because, in most cases, the source spectrum cannot be approximated by these functions.
As a result, these Q tomography algorithms take a large amount of computation time or yield many artifacts and unrealistic Q models (e.g., negative Q values or extremely low Q values), especially when the seismic data are contaminated by noise.
In practical applications, this method is relatively unreliable due to wavelet overlapping, uncertainty in linear fitting, and many other factors.
In this approach, the log-amplitude scalars describing the frequency independent amplitude variation are included in the unknowns, which substantially increases the number of unknowns and reduces the efficiency of the algorithm.
Furthermore, in 2D / 3D Q tomography using surface seismic reflection data, the log-amplitude scalars are not only a function of position, but also a function of ray, which severely complicates the procedure.
Unfortunately, this method is impractical in exploration geophysics because the wavelets are inevitably contaminated by noise, scattering effect, overlapping, etc.
This method is attractive but, in practice, there are difficulties in accurately measuring peak frequency variation.
Moreover, because only the information at an individual frequency is used, the uncertainty of Q estimation can be large.
The limitation of this method is that the source amplitude spectrum has to be a Gaussian, boxcar, or triangular function.
If this asymmetric amplitude spectrum is approximated by a Gaussian function, significant errors will be introduced in the reconstruction of Q models.
However, seismic data are never clean; in handling real field data, these unconstrained optimization algorithms always result in some negative Q values or extremely small positive Q values, which are physically unreal.
To achieve this goal, the resulting optimization system is solved with a Gauss-Newton approach, which can be very expensive.
Another disadvantage of this method is that, during optimization, when the Q values are very large, the gradient-based optimization algorithm will be stagnant or converge very slowly, i.e., the Q values will stay there and no longer change.
In the worst case, if the y values in the starting model are infinite, then the gradient of the cost function is 0 and the optimization algorithm does not perform searching.
This method works effectively for Q estimation using VSP data but may fail in 2D Q tomography using surface reflection seismic data.
The active-set method they use is conventional, and it is inefficient because the algorithm updates the active set, one constraint at a time (Bierlaire et al., 1991).
When the number of box constraints is huge, the convergence rate of the algorithm can be very slow.

Method used


Image

  • Q tomography method
  • Q tomography method
  • Q tomography method

Examples


examples

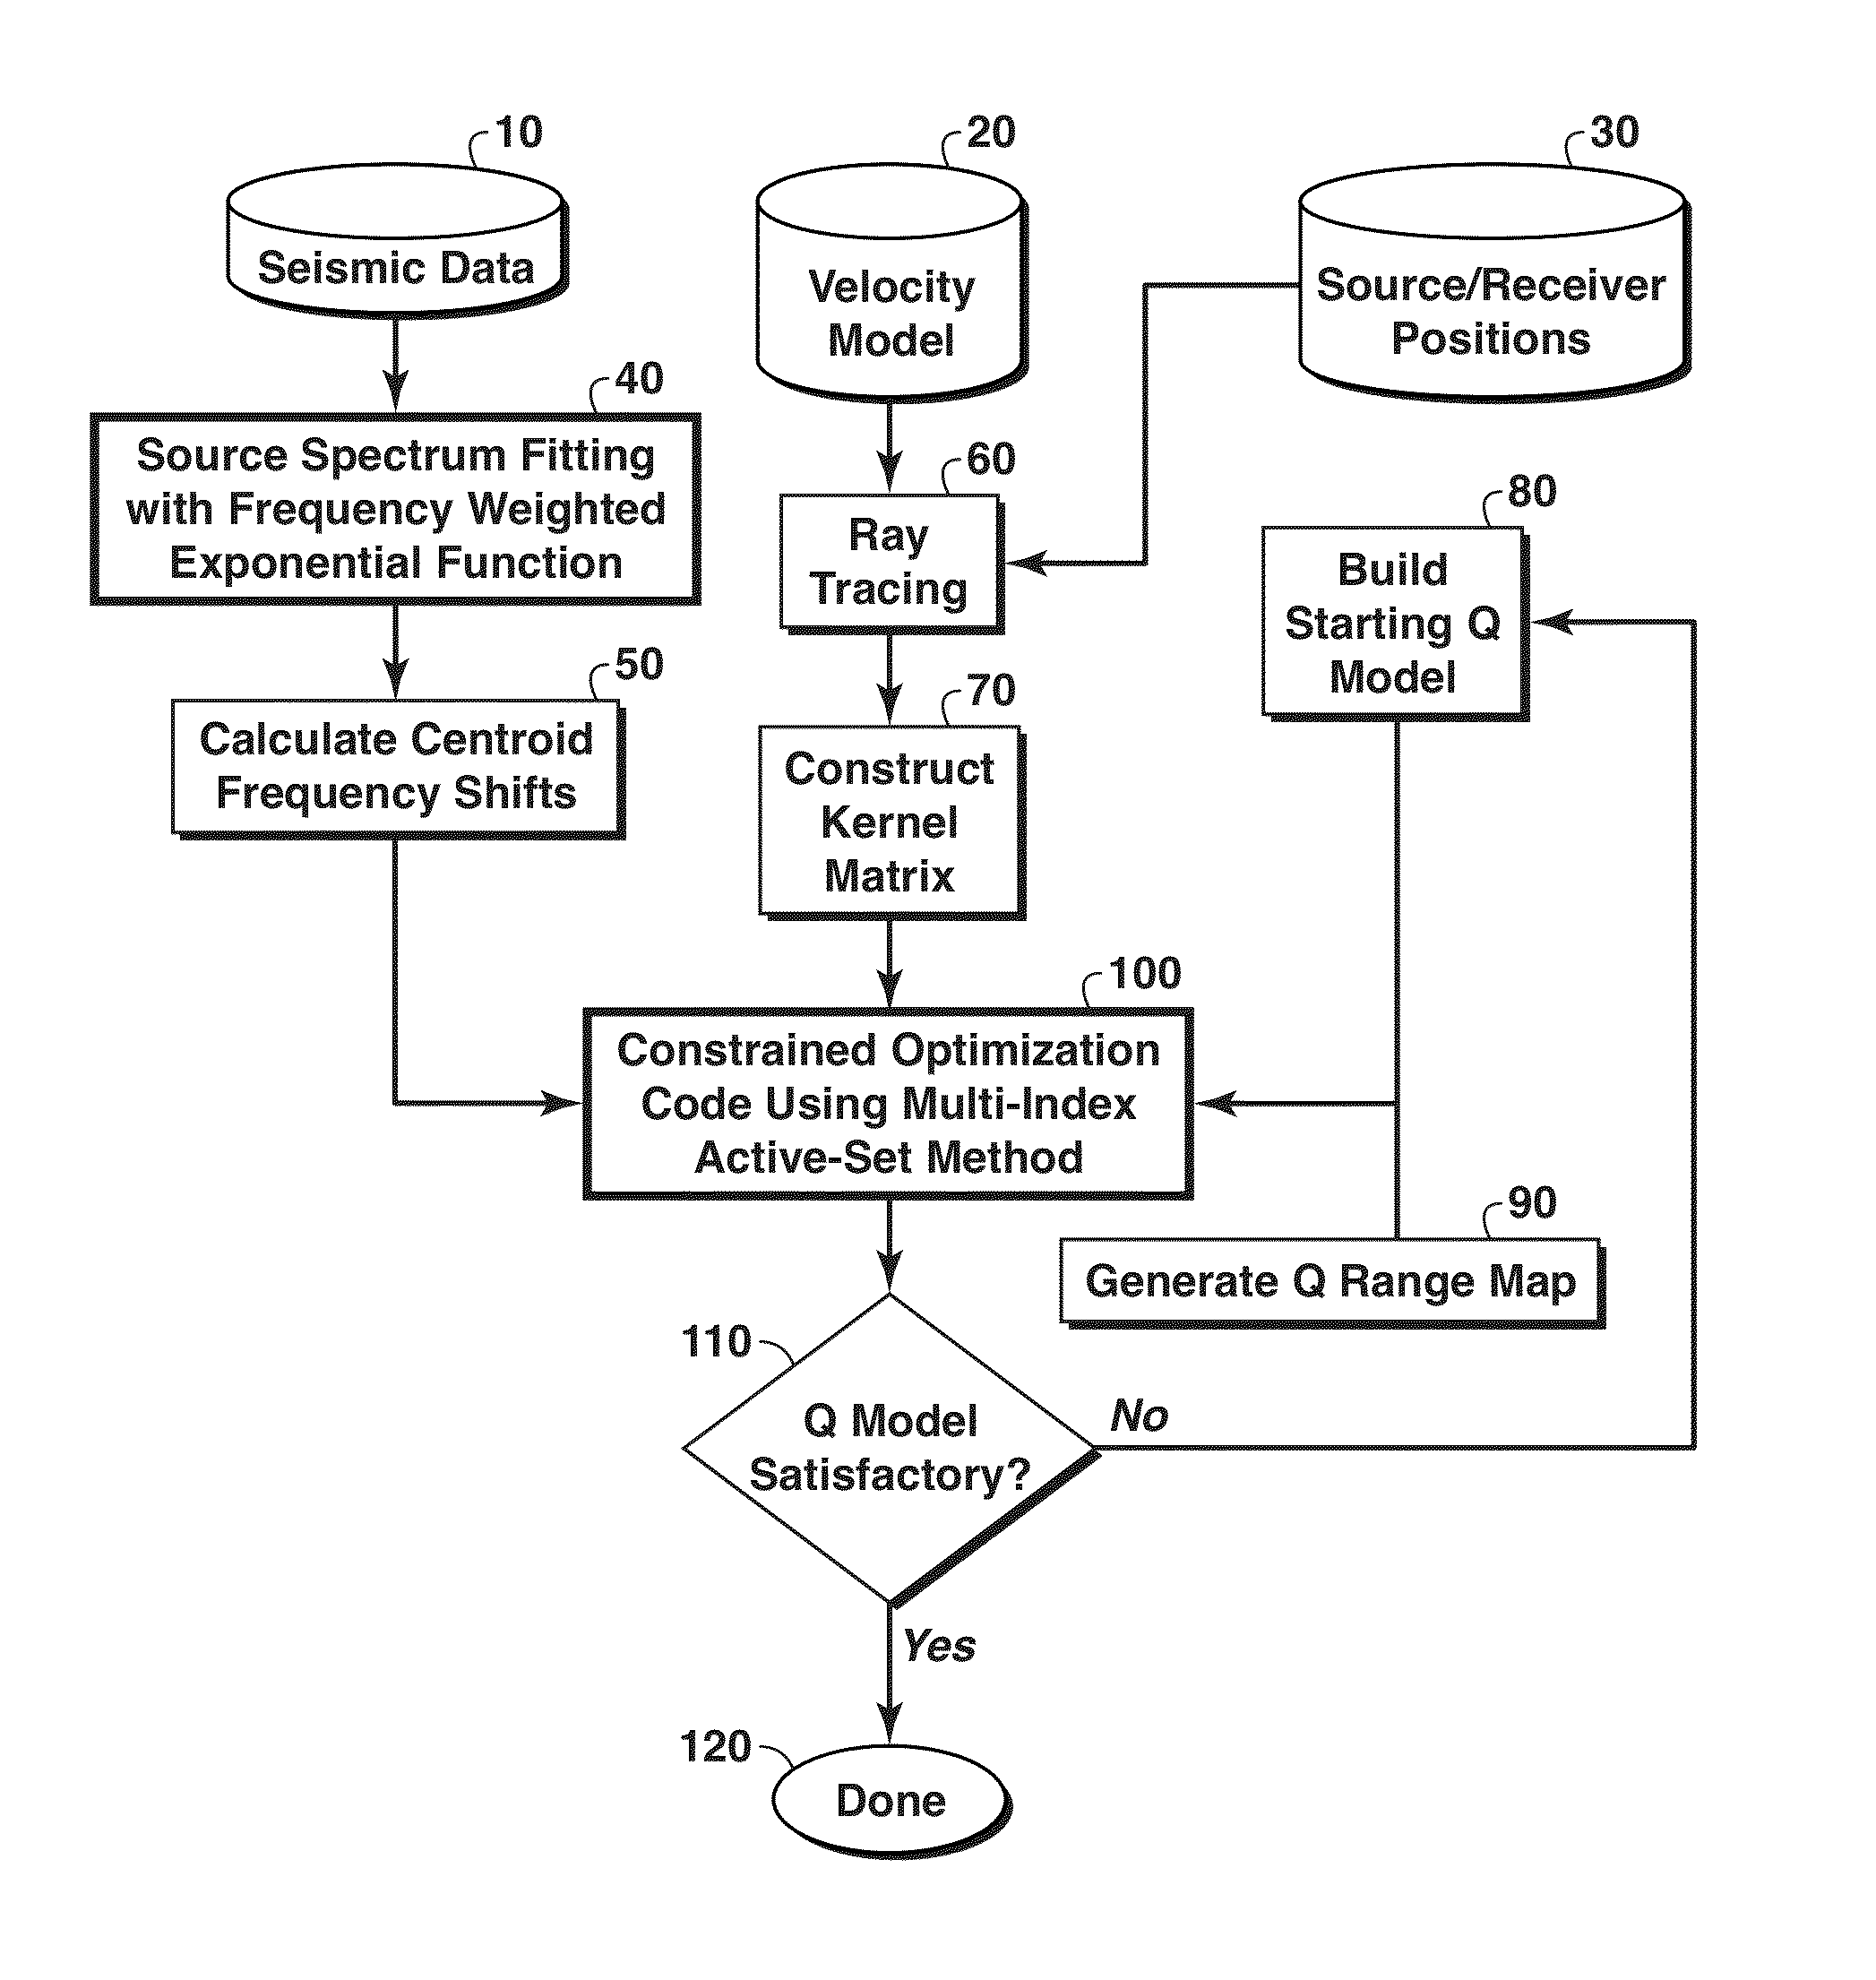
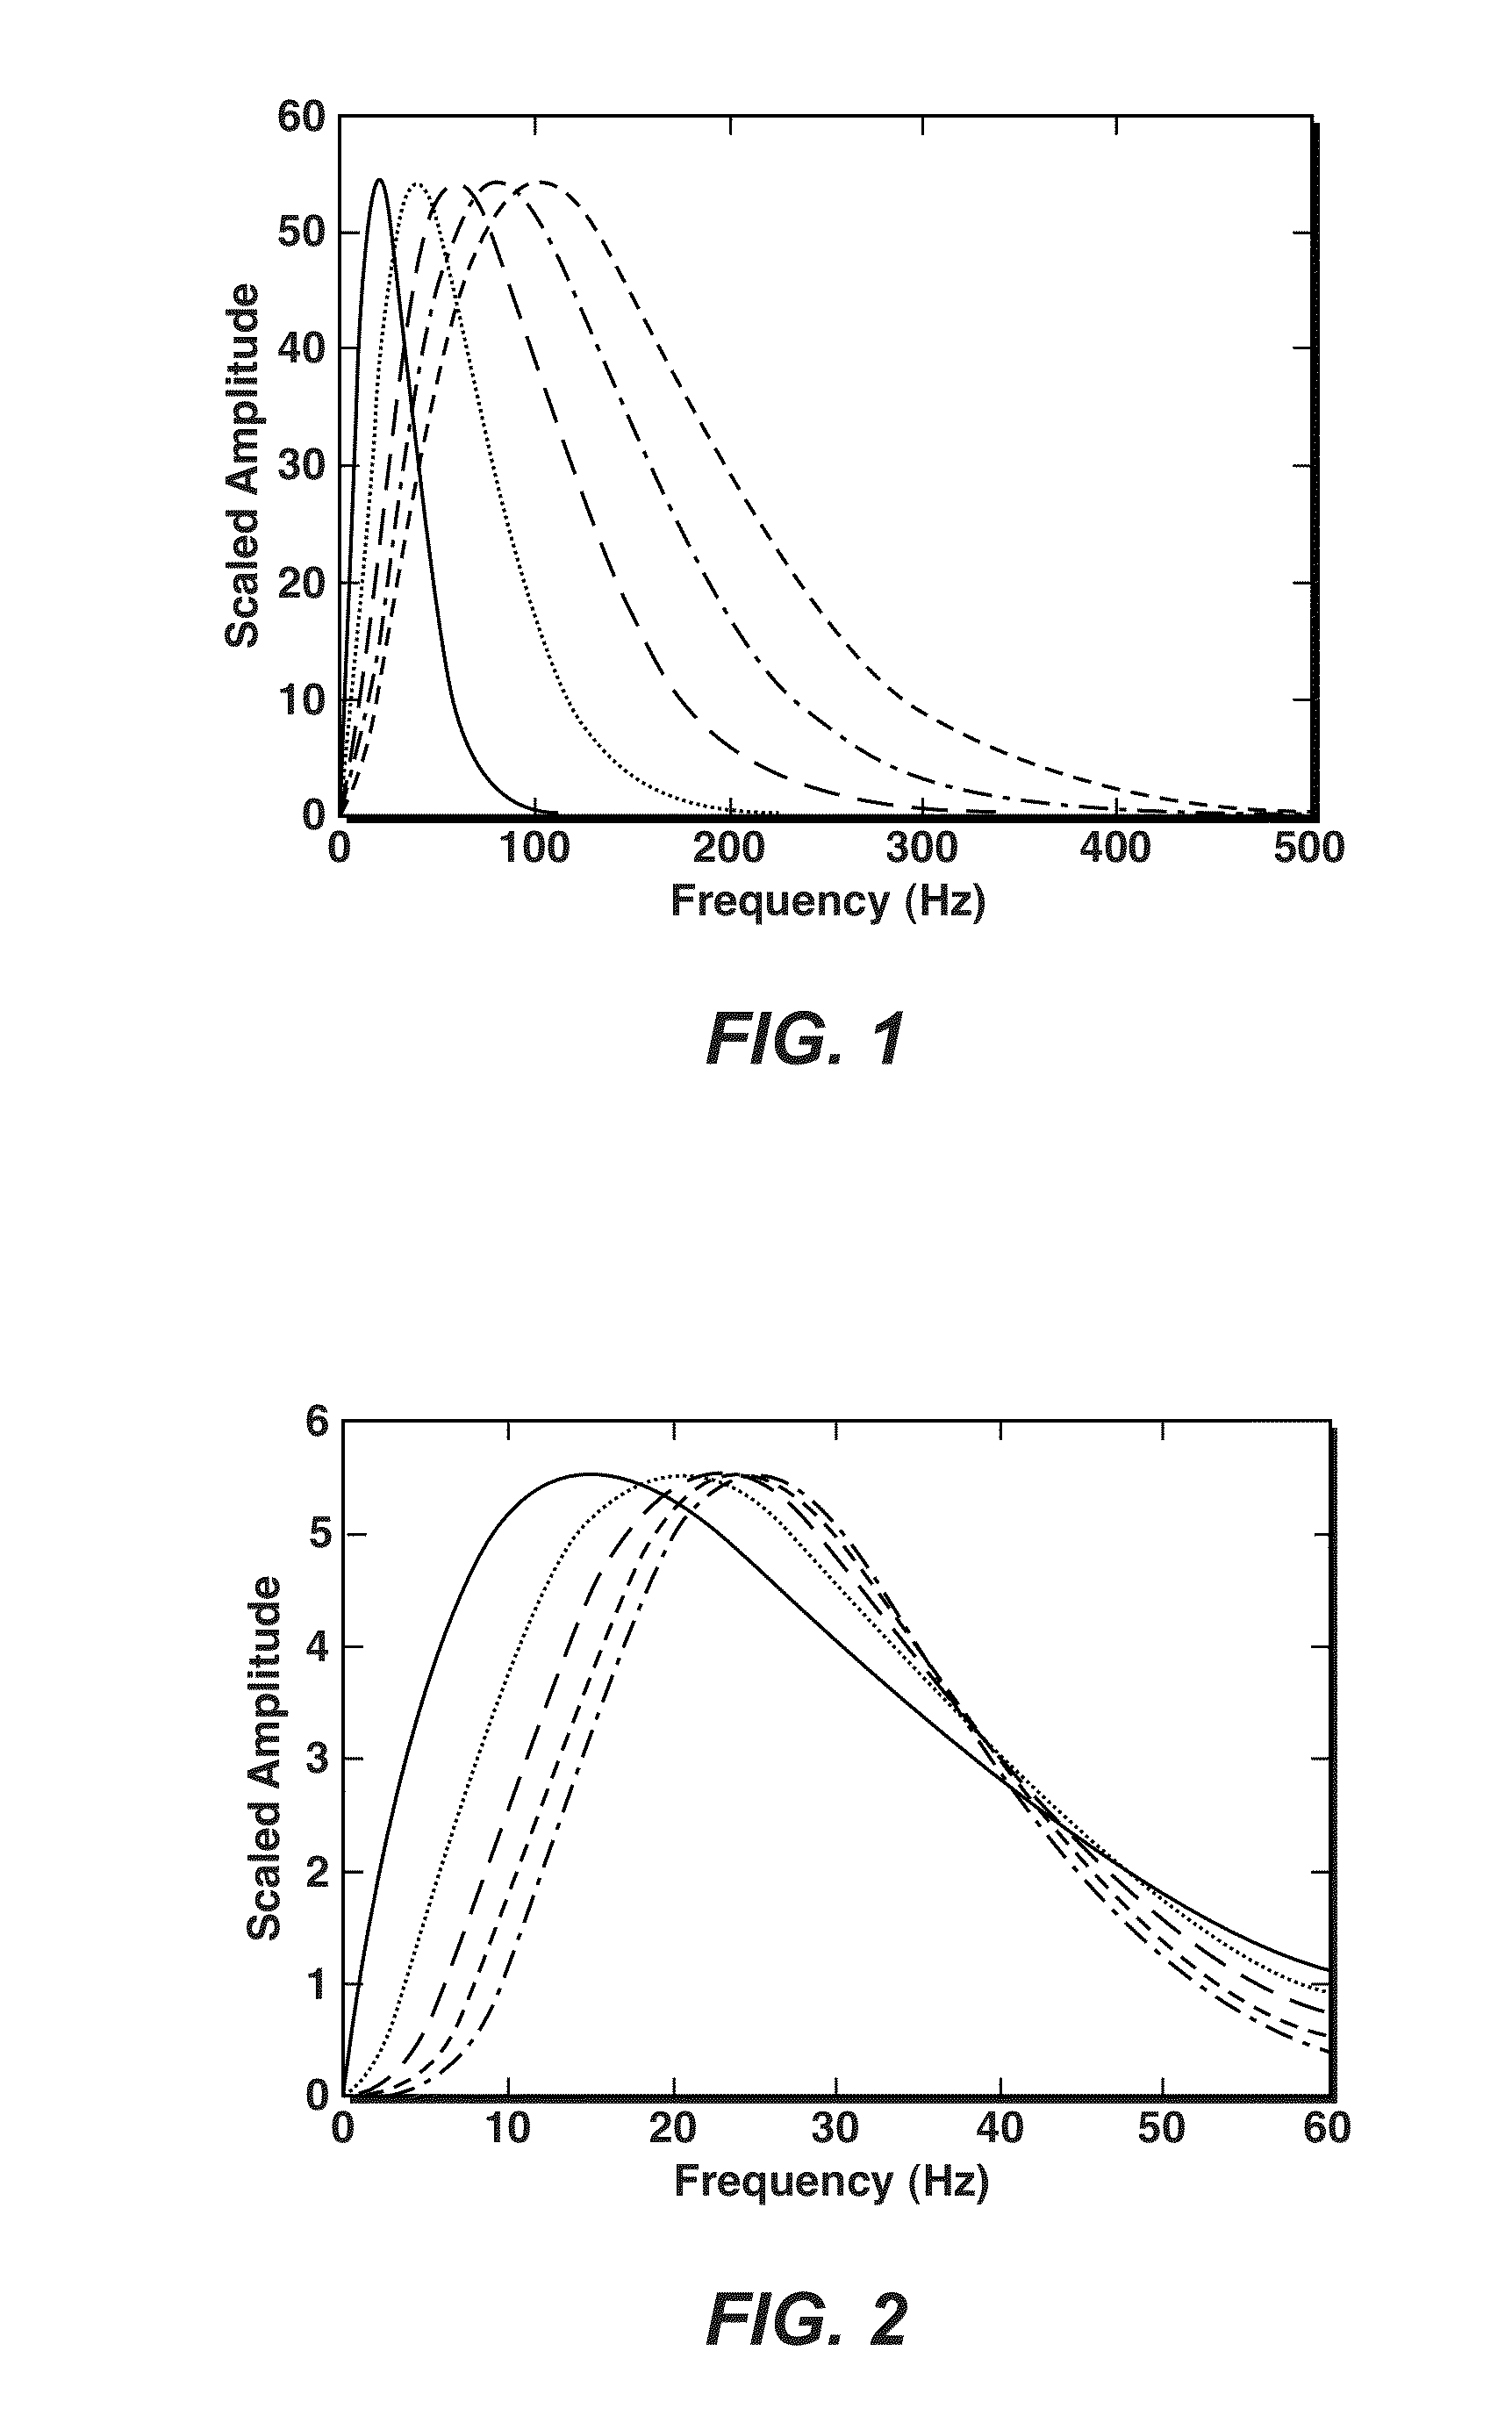
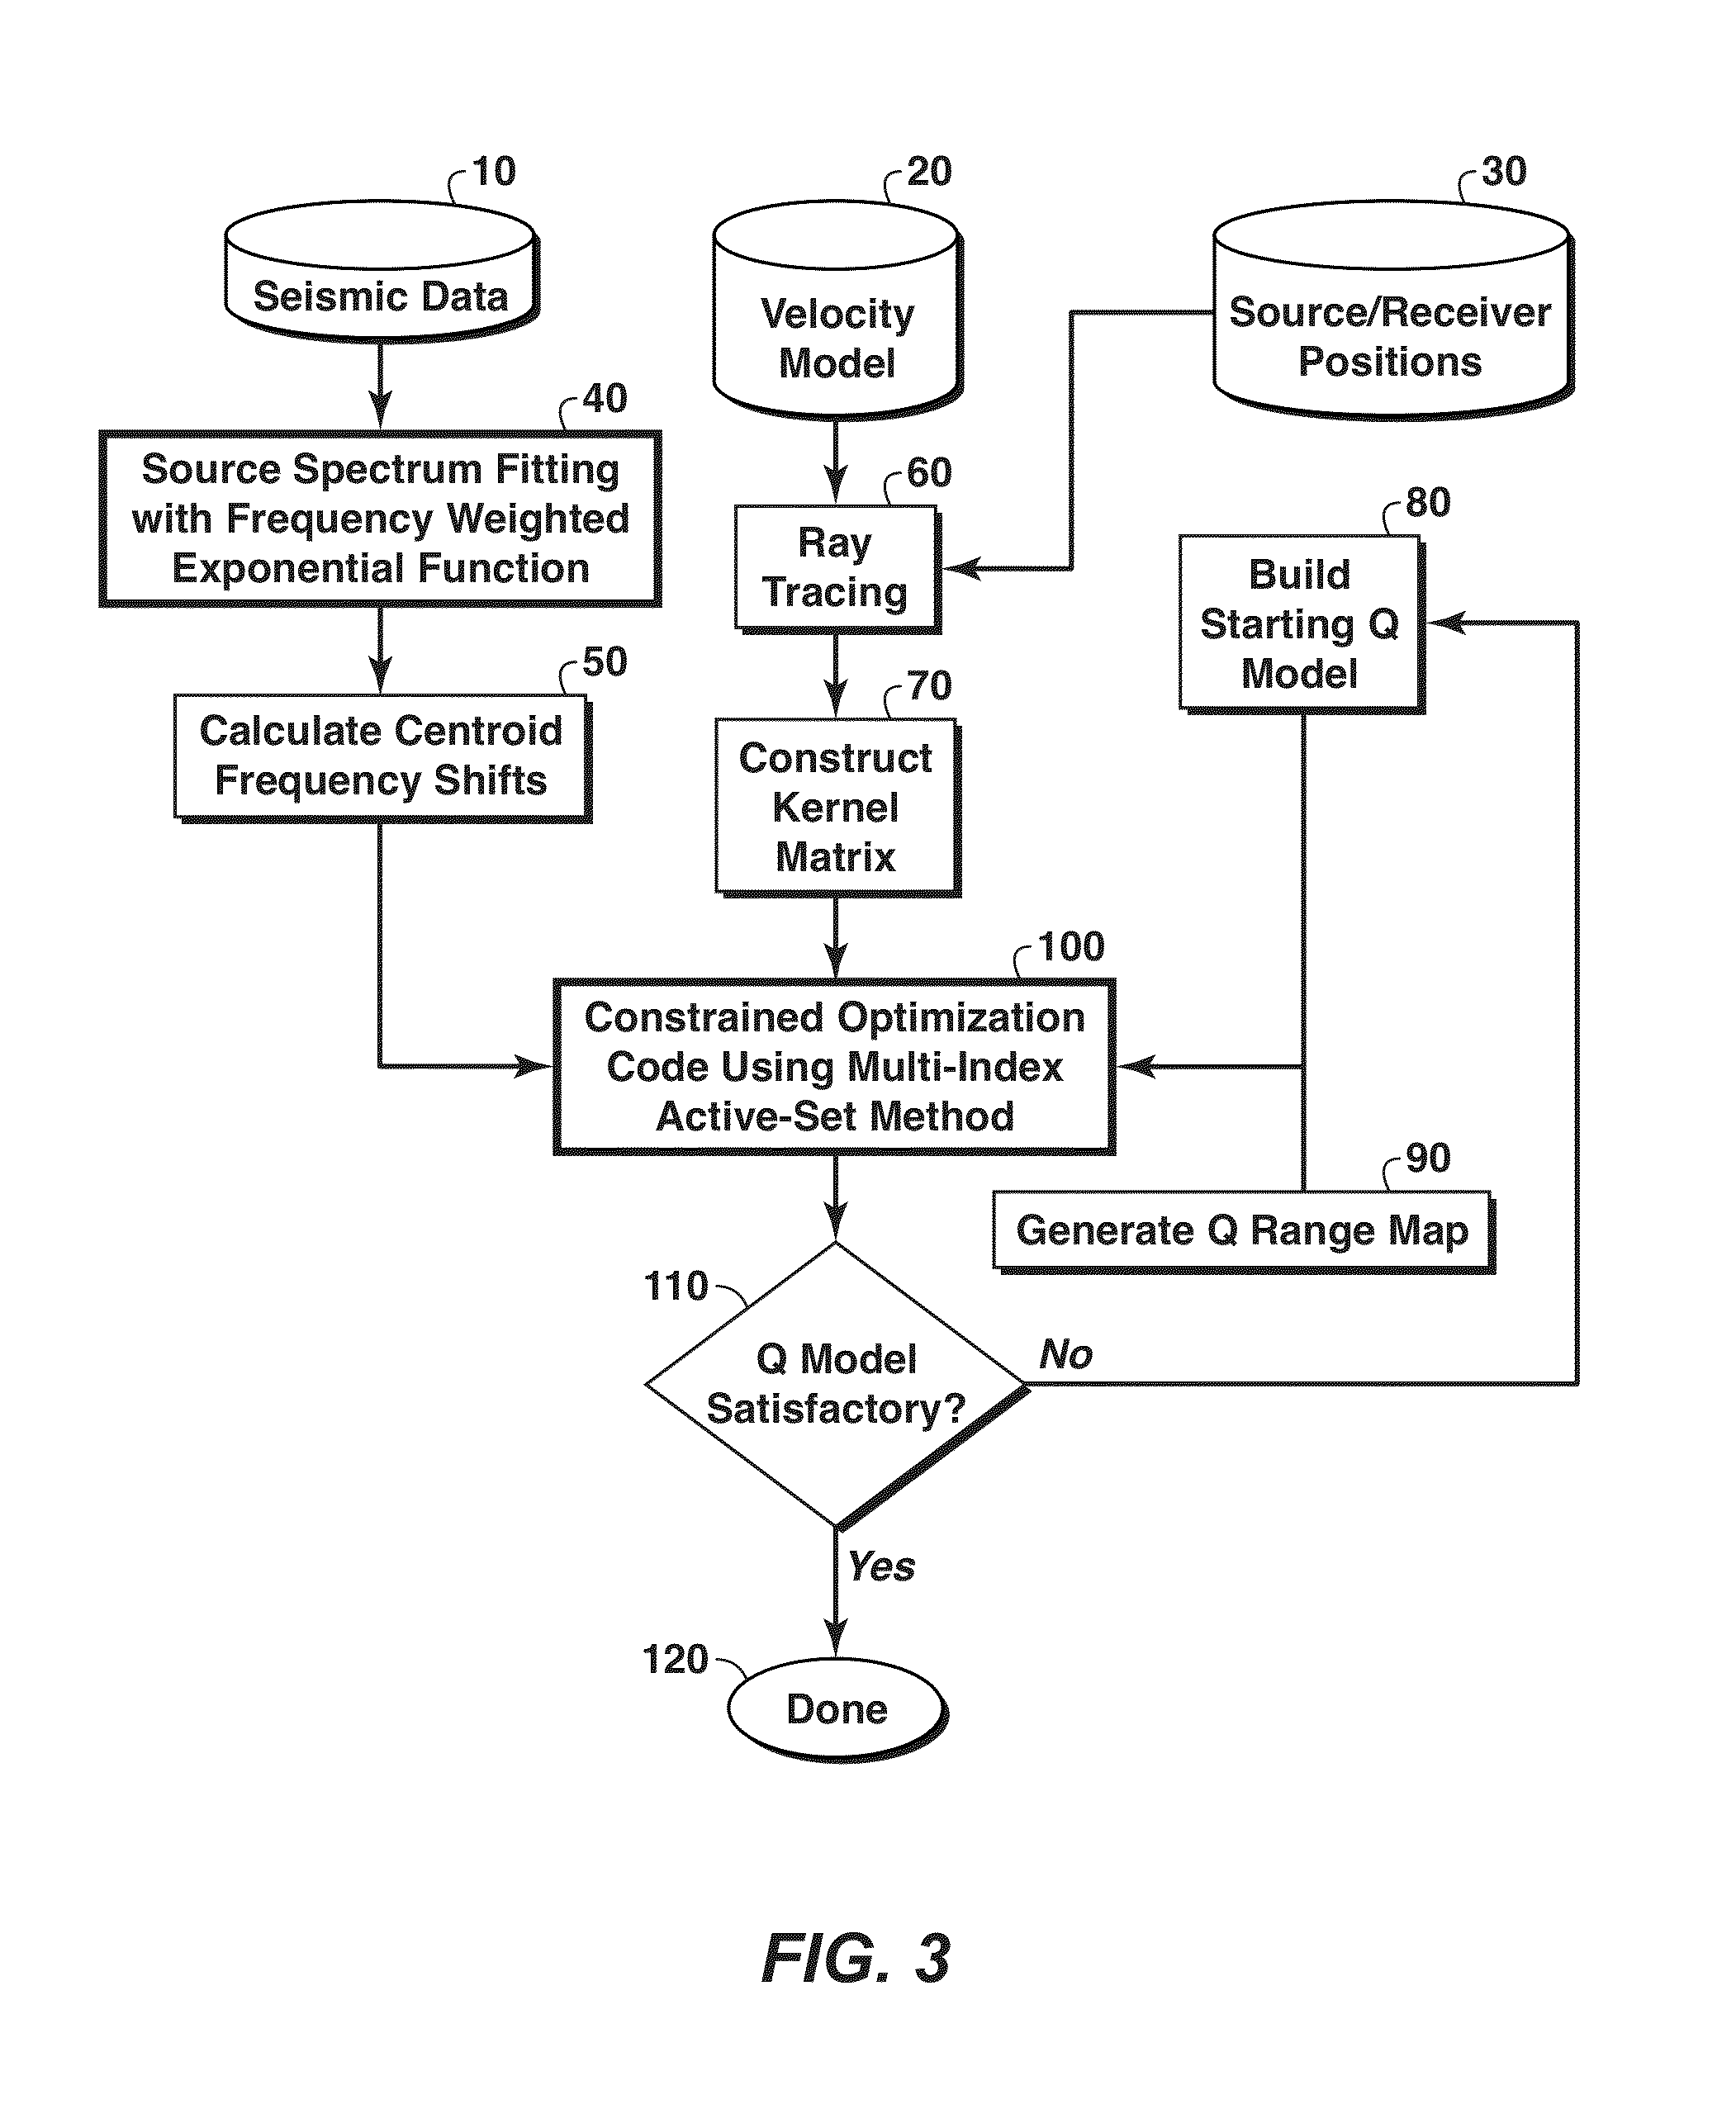
[0077]In this section, a synthetic example of Q tomography is presented. The performance of the Q tomography algorithm of the present invention is compared with that of the conventional centroid frequency shift Q tomography algorithms using the Gaussian function with or without the box constraints. FIG. 4 shows the source amplitude spectrum, which is asymmetric. The centroid frequency of the source amplitude spectrum can be calculated numerically as 55.7 Hz and the peak frequency is 33 Hz. With the Gaussian function source amplitude spectrum fitting, the peak frequency of the Gaussian function is 55.7 Hz and the variance is 1246 Hz2. With the frequency weighted exponential function fitting, the parameters n and f0 in equation (3) are 1.45 and 22.7 Hz respectively. FIG. 5A is the velocity model and the raypaths obtained by running the ray tracing code, while FIG. 5B is the true 1 / Q model. In this synthetic data testing, 50 sources are used. For each source, there are 90 receivers. Th...


PUM


Abstract

Method for reconstructing subsurface Q models (110) from seismic data (10) by performing ray-based (60), centroid frequency shift (50) Q tomography. The seismic source waveform's amplitude spectrum is approximated by a frequency-weighted exponential function of frequency (40), having two parameters to adjust to fit the frequency shift data, thereby providing a better fit to various asymmetric source amplitude spectra. Box constraints may be used in the optimization routine, and a multi-index active-set method used in velocity tomography is a preferred technique for implementing the box constraints (100).

Description

CROSS-REFERENCE TO RELATED APPLICATION[0001]This application claims the benefit of U.S. Provisional Patent Application 61 / 331,694, filed May 5, 2010, entitled Q TOMOGRAPHY METHOD, the entirety of which is incorporated by reference herein.FIELD OF THE INVENTION[0002]The invention relates generally to the field of geophysical prospecting and, more particularly, to seismic data processing. Specifically, the invention relates to the technical field of Q tomography.BACKGROUND OF THE INVENTION[0003]The seismic attenuation effect needs to be taken into account for characterization of rock properties and proper amplitude-variations-with-offset (AVO) analysis. In migration, seismic attenuation information is needed to compensate for the absorption effect to enhance migration image quality. Therefore, estimation of seismic attenuation is essential for reservoir detection and monitoring.[0004]Seismic attenuation can be quantitatively described by the quality factor Q. A simple assumption is th...

Claims


Application Information

Patent Timeline
Patent Type & Authority Patents(United States)
IPC IPC(8): G01V1/28G01V1/30
CPCG01V1/30G01V1/282G01V2210/671G01V1/306G01V1/301
Inventor HU, WENYI
Owner EXXONMOBIL UPSTREAM RES CO
Why Eureka
Try Eureka