Method of calculating a phosphorus-protein ratio
a phosphorus-protein ratio and ratio technology, applied in the field of calculating a phosphorus-protein ratio, can solve the problems of increasing the difficulty of dialysis treatment, increasing the burden of daily pills, and insufficient elimination of excess phosphorus by dialysis treatments
- Summary
- Abstract
- Description
- Claims
- Application Information
AI Technical Summary
Benefits of technology
Problems solved by technology
Method used
Image
Examples
example 1
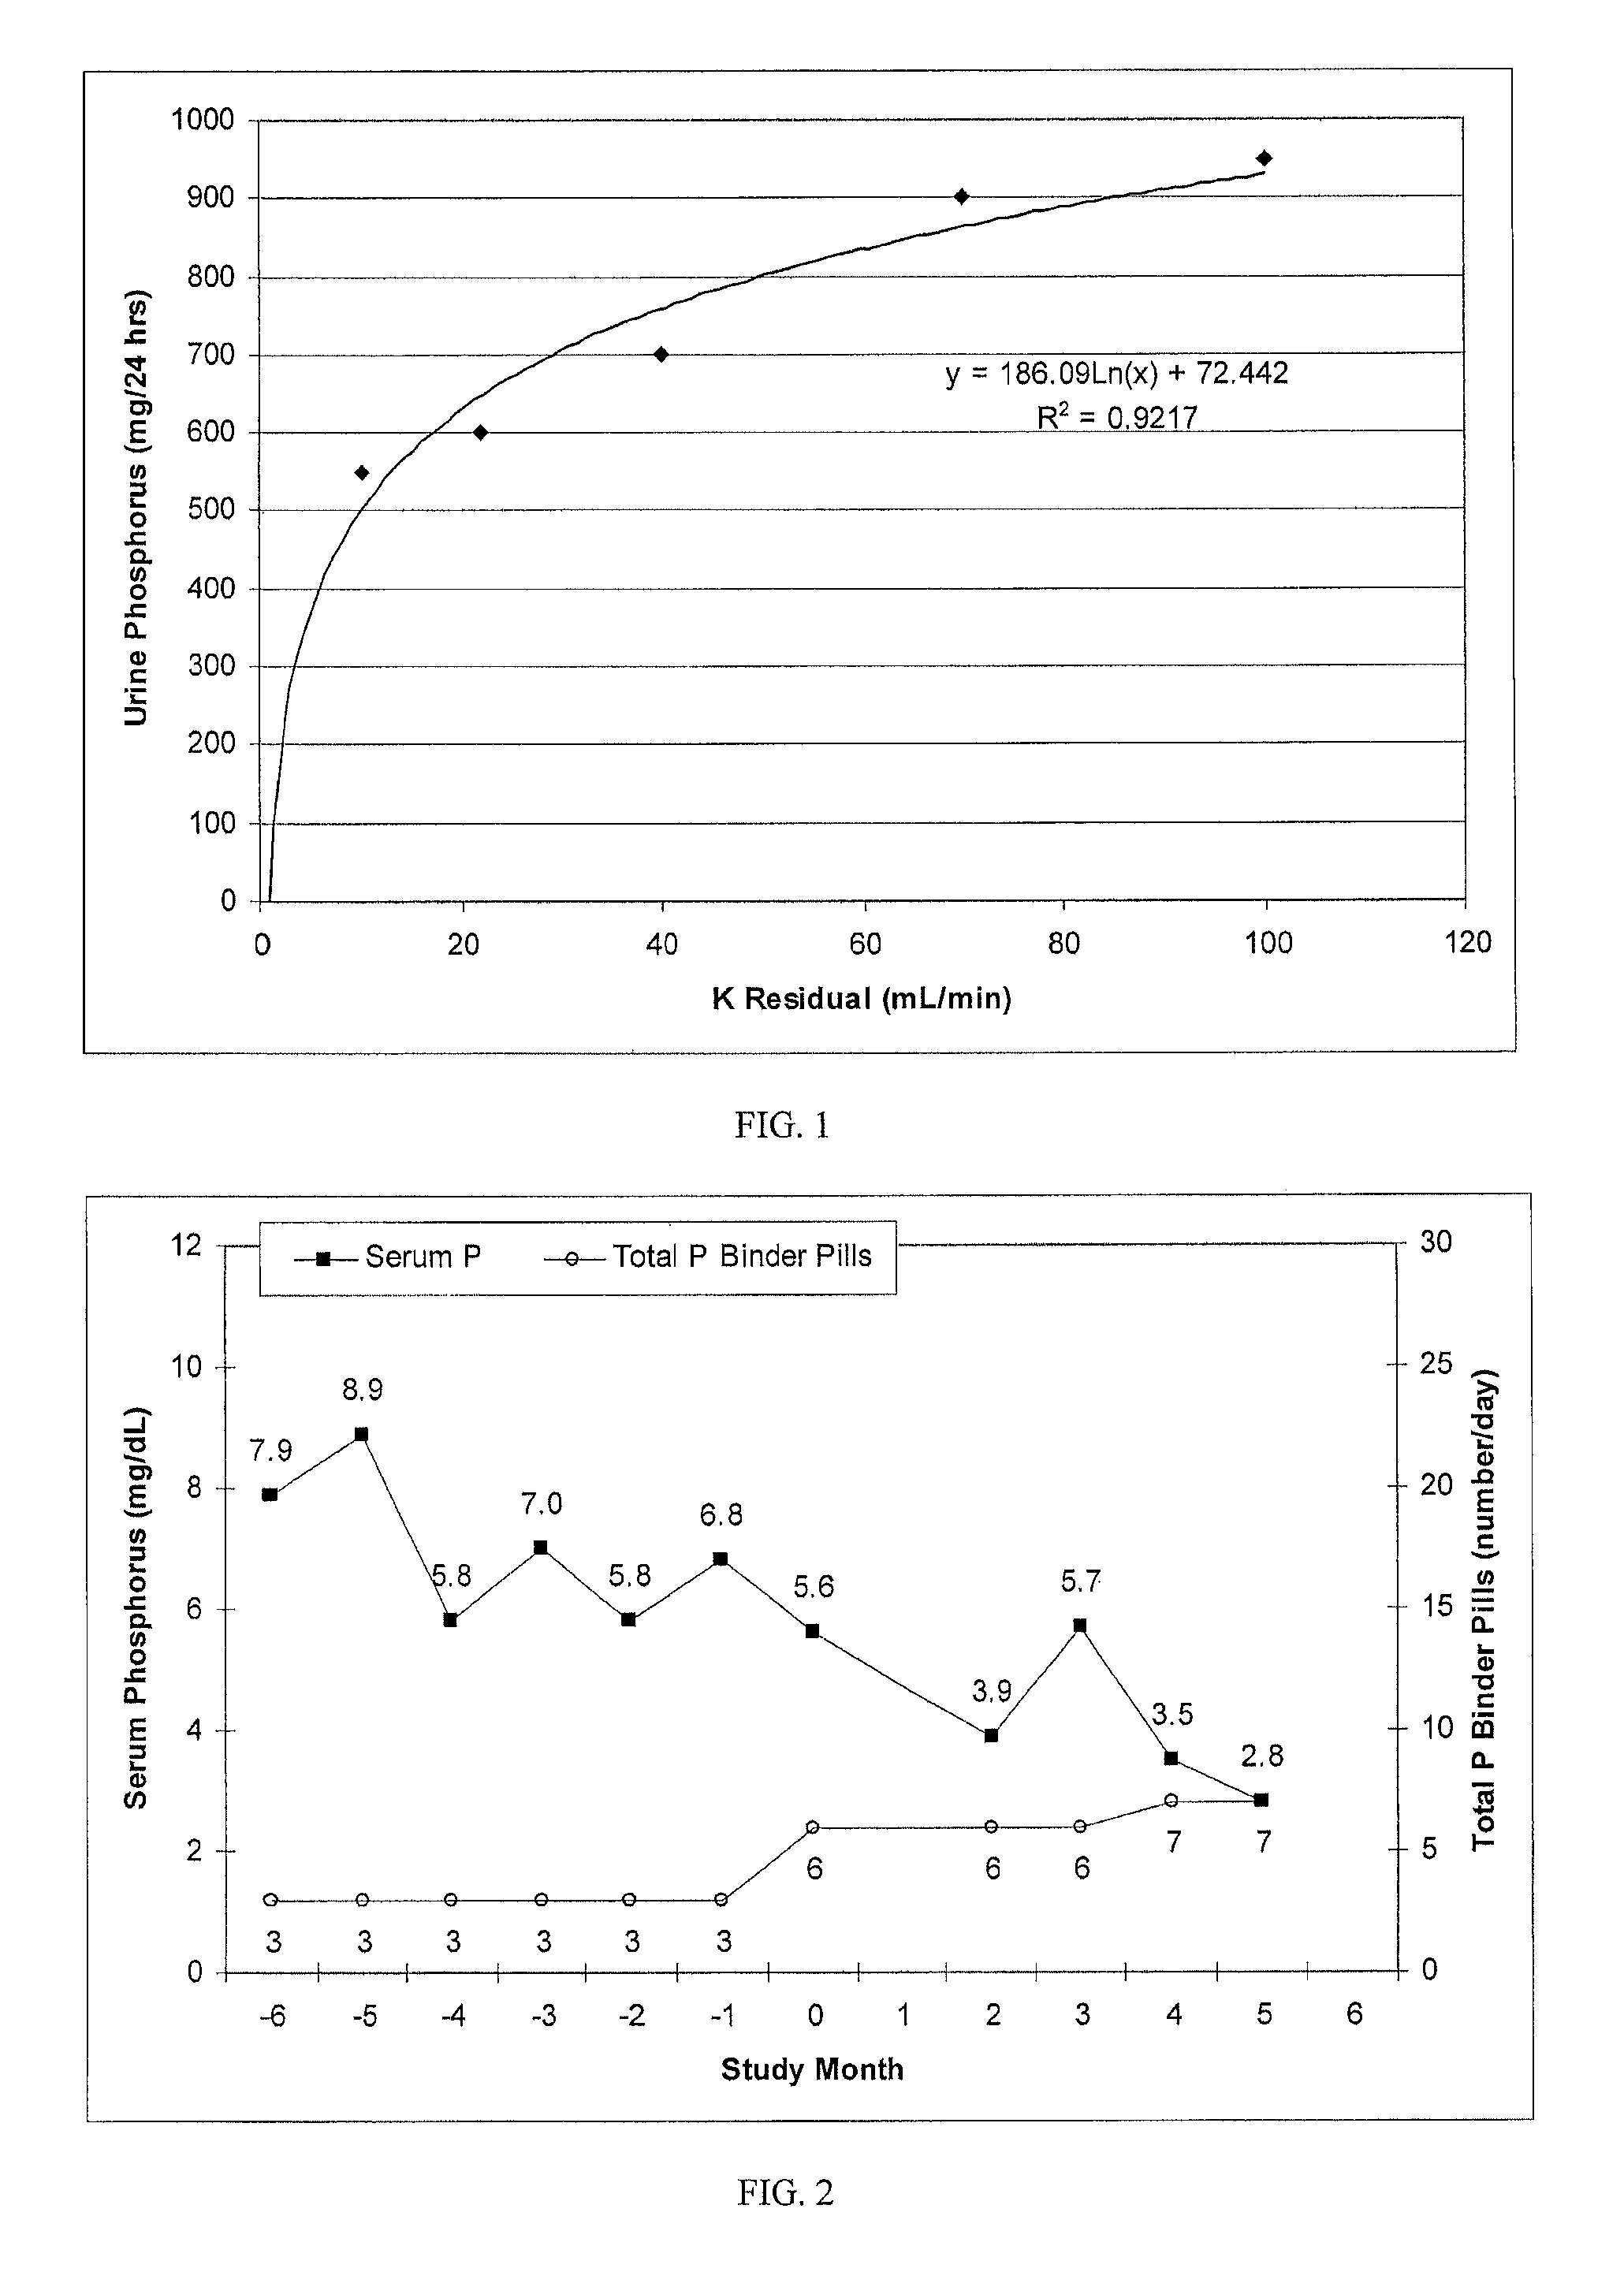
[0039]Patient 1 was a 53 year old diabetic, African-American male with a dialysis vintage of 19 months. Prior to use of the PPR, the 6-month, 3-month, and 1-month average serum P was 7.0, 6.5, and 6.8 mg / dL, respectively. All of these values are outside the recommended guidelines of 3.5-5.5 mg / dL. In the 6 months prior to the study, Patient 1 was prescribed 3 (800 mg) RENAGEL®, sevelamer hydrochloride, tablets per day. Once per month for 6 months (study months 0-5), input values were collected for the PPR and recommended binder prescription and dialysate calcium concentrations were calculated. As illustrated in FIG. 2, during the study period, Patient 1's binder prescription was increased to 6 and then 7 PhosLo® pills per day in order to bring serum P level down to the recommended guidelines. For the 6 month study period, average serum P was 4.0 mg / dL. Serum P fell within recommended guidelines for the study period. The average PPR for Patient 1 during the study period was 6.7. Clin...
example 2
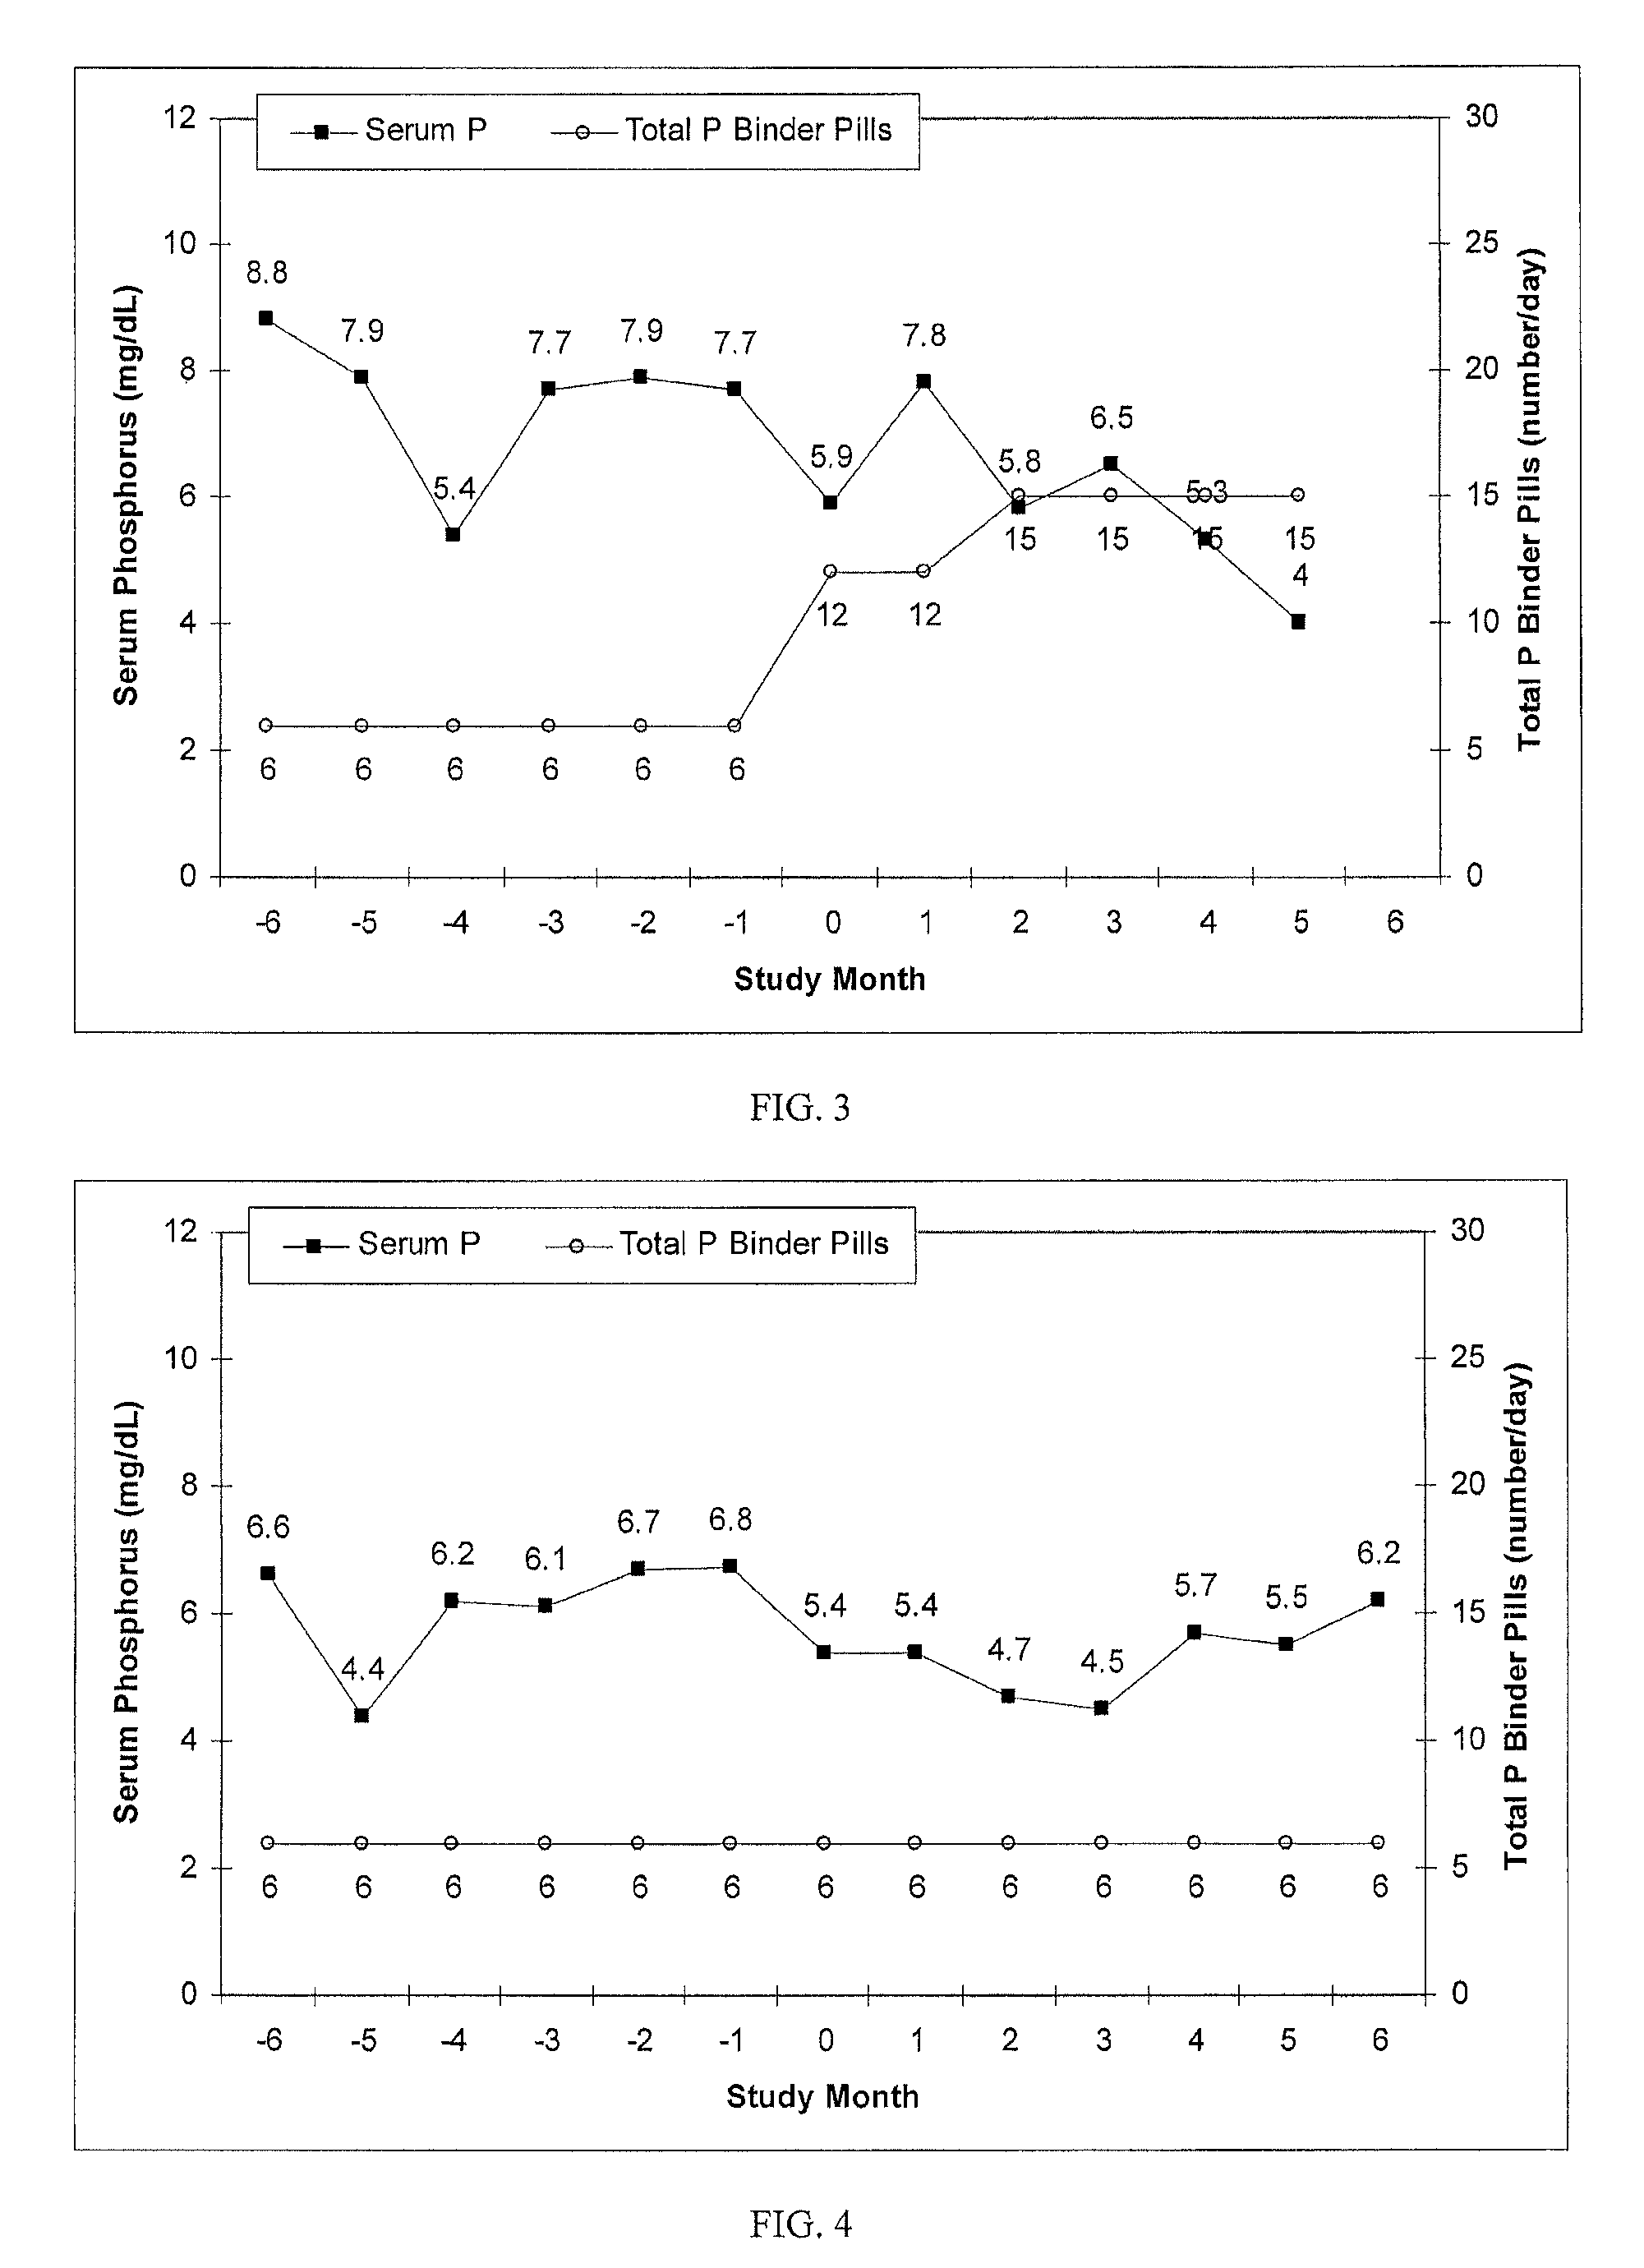
[0040]Patient 2 was a 61 year old African-American male with a dialysis vintage of 41 months. Prior to use of the PPR, the 6-month, 3-month, and 1-month average serum P was 7.6, 7.8, and 7.7 mg / dL, respectively. All of these values are outside the recommended guidelines of 3.5-5.5 mg / dL. In the 6 months prior to the study, Patient 2 was prescribed 6 PhosLo® tablets per day. Once per month for 6 months (study months 0-5), input values were collected for the PPR and recommended binder prescription was calculated. As illustrated in FIG. 3, during the study period, Patient 2's binder prescription was increased to 12 and then 15 PhosLo® pills per day in order to bring serum P level down to the recommended guidelines. For the 6 month study period, average serum P was 5.9 mg / dL. Average serum P fell by 22% although did not meet target guidelines. The average serum P for the last 3 months of the study was 5.3 mg / dL. Continued observation in the study would likely continue to result in serum...
example 3
[0041]Patient 3 was a 72 year old diabetic, white female with a dialysis vintage of 22 months. Prior to use of the PPR, the 6-month, 3-month, and 1-month average serum P was 6.2, 6.6, and 6.8 mg / dL, respectively. All of these values are outside the recommended guidelines of 3.5-5.5 mg / dL. In the 6 months prior to the study, Patient 3 was prescribed 6 PhosLo® tablets per day. Once per month for 7 months (study months 0-6), input values were collected for the PPR and recommended binder prescription was calculated. As illustrated in FIG. 4, during the study period, Patient 3's binder prescription was maintained at 6 PhosLo® pills per day. For the 6 month study period, average serum P was 5.3 mg / dL. As also illustrated in FIG. 4, serum P fell within recommended guidelines for the study period. The average PPR for Patient 3 during the study period was 11.8, which was within the recommended range. Although the number of P binder pills was not increased, serum P decreases may be attributed...
PUM
| Property | Measurement | Unit |
|---|---|---|
| concentration | aaaaa | aaaaa |
| concentration | aaaaa | aaaaa |
| time | aaaaa | aaaaa |
Abstract
Description
Claims
Application Information
 - R&D
- Intellectual Property
- Life Sciences
- Materials
- Tech Scout
- Unparalleled Data Quality
- Higher Quality Content
- 60% Fewer Hallucinations
Browse by: Latest US Patents, China's latest patents, Technical Efficacy Thesaurus, Application Domain, Technology Topic, Popular Technical Reports.
© 2025 PatSnap. All rights reserved.Legal|Privacy policy|Modern Slavery Act Transparency Statement|Sitemap|About US| Contact US: help@patsnap.com


