Ultrasonic diagnostic apparatus and ultrasonic image display method

a diagnostic apparatus and ultrasonic technology, applied in the field of ultrasonic diagnostic apparatus and ultrasonic image display method, can solve the problem of not paying attention to the acquisition of hardness properties

Active Publication Date: 2015-06-23
FUJIFILM HEALTHCARE CORP
View PDF20 Cites 7 Cited by
  • Summary
  • Abstract
  • Description
  • Claims
  • Application Information

AI Technical Summary

Benefits of technology

[0024]In accordance with the ultrasonic diagnostic apparatus and ultrasonic image display method of the above-mentioned present invention, it is possible to display as an image the spatial distribution of hardness of the tissues from which the influence of the compression quantity is eliminated.

Problems solved by technology

However, in the technique disclosed in Patent Document 1, while it enables the acquisition of hardness property of the tissues not correlated with pressure quantity in the only regions that are set as the region of interest, attention is not paid to the acquisition of hardness property of the tissues not correlated with pressure quantity in the regions that are not set as the region of interest.
Also, since 2-dimensional distribution information of the strain cannot be extracted sufficiently in the ratio between the regions of interest, room for improvement in the technique still remains.

Method used


Image

  • Ultrasonic diagnostic apparatus and ultrasonic image display method
  • Ultrasonic diagnostic apparatus and ultrasonic image display method
  • Ultrasonic diagnostic apparatus and ultrasonic image display method

Examples


embodiment 1

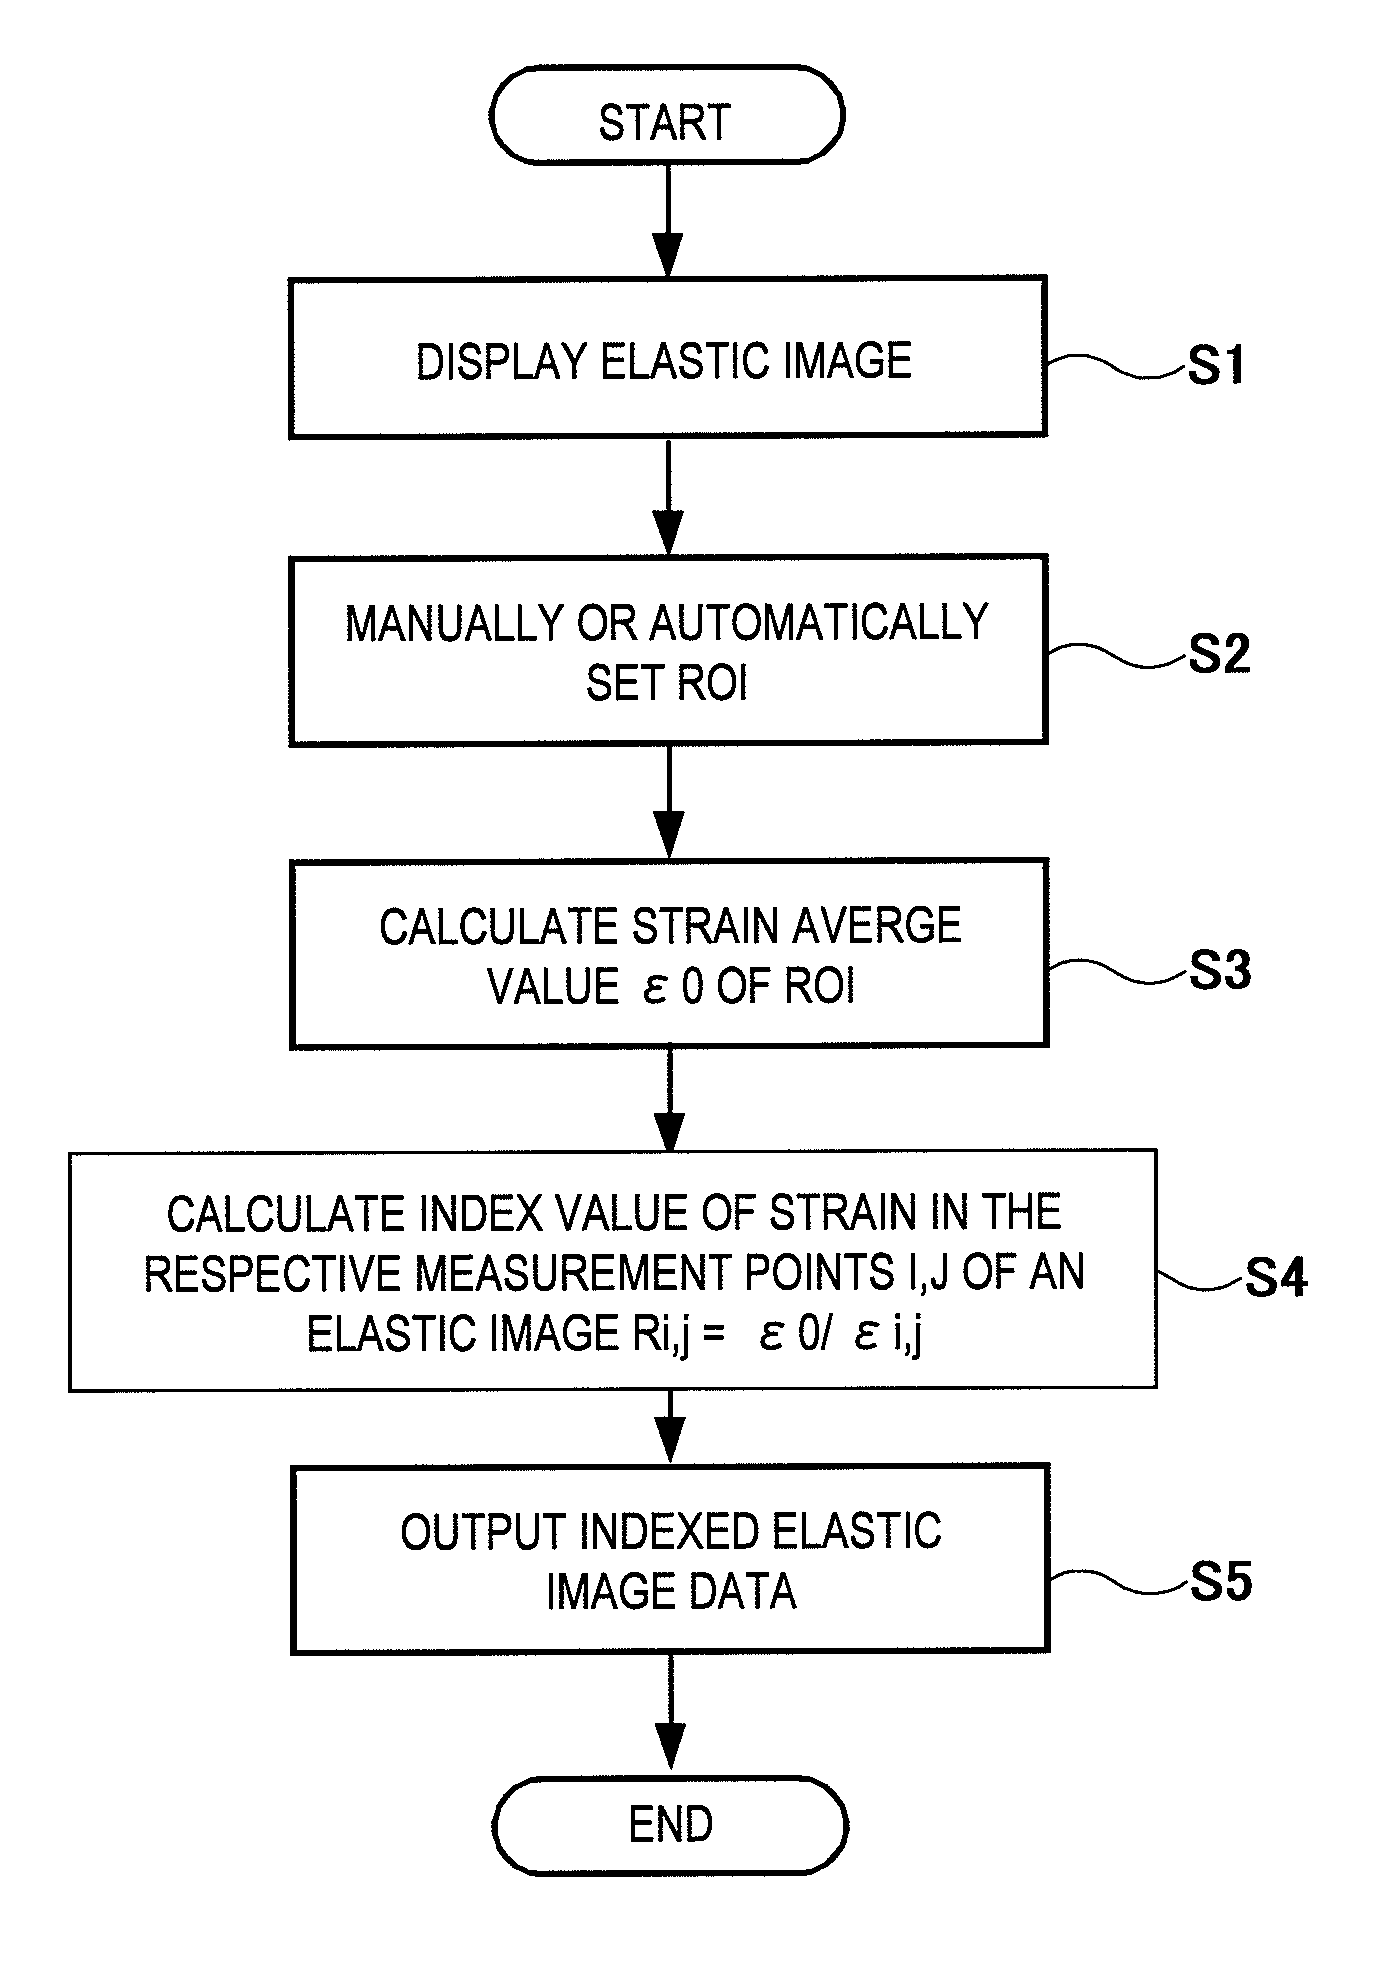
[0058]FIG. 2 is a flow chart of the procedure for generating an indexed elastic image of embodiment 1. The present embodiment is an example for setting reference region R0 to strain image 41 that is one of the elastic images as shown in FIG. 4, and generating indexed elastic image 51 shown in FIG. 5 based on the set reference region and displaying the image.

[0059]First, in step S1 of FIG. 2, a command is issued to strain / elasticity modulus calculating unit 13, and strain image 41 is displayed on image displayer 10. Next, coordinate data of reference region R0 being set manually or automatically using a device such as a mouse is loaded via control interface unit 17 (S2). Then the strain image frame data is loaded from strain / elasticity modulus calculating unit 13, and the average value of the strain in the region corresponding to reference region R0 is calculated as reference strain ε0 (S3). Next, index value Ri,j which is the correlation rate between strain εi,j in each strain measu...

embodiment 2

[0072]In embodiment 1, an example for setting reference region R0 being the reference region for indexing in the living body is described. However, the present invention is not limited to this, and when ultrasonic tomographic data is obtained using probe 2 having reference deformable member 33 which is an elastic member shown in FIG. 3(B), image 53 of reference deformable member 33 is displayed in the tissue region located in the nearest to probe 2 on the strain image as shown in FIG. 6. In the same manner as embodiment 1, indexed elastic image 52 can be generated and displayed by setting reference region R0 in this image region of reference deformable member 33.

[0073]In particular, it is possible to estimate an approximate elasticity module of the tissues in the respective measurement points by measuring elasticity module of reference deformable member 33 in advance. More specifically, by setting elasticity modulus of reference deformable member 33 as Eref(kPa), approximate elastic...

embodiment 3

[0077]While an example is described in embodiment 1 for setting reference region R0 by inputting from control interface 17, reference region R0 can be also set automatically as described below. For example, by detecting the softest region in an image such as an elastic image, and reference region R0 may be set thereto.

[0078]Also, for example, FIG. 7(A) shows B-mode tomographic image 54 of a mammary gland wherein fatty tissues that are positioned nearest to probe 2 appear thereon, which are also the softest tissues in the measurement region. Here, since it is possible to detect the boundary between fat 61 and mammary gland 62 also on B-mode image 54, the region from the vicinity of the body surface to the boundary of the mammary gland can be extracted and automatically set as reference region R0.

[0079]In this case, as shown in FIG. 7(B), indexed elastic image 55 having reference region R0 that is the whole tissue 1 of fatty tissue 61 can be obtained.

[0080]Also, for example, it is pos...


PUM


Abstract

An image showing the spatial distribution of the hardness of a tissue of an object to be examined from which the influence of the pressure amount is eliminated is displayed.From ultrasonic tomography data measured by pressing the tissue, a physical quantity relating to the distortion of the tissue at measurement points of the tissue is determined.An elasticity image of the tissue is created according to the physical quantity.The physical quantities at the measurement points are indexed by using the physical quantity in a reference region determined in the elasticity image as a reference, and an indexed elasticity image showing the distribution of the index value is created.

Description

TECHNICAL FIELD[0001]The present invention relates to an ultrasonic image display method and ultrasonic diagnostic apparatus, in particular to those capable of improving ability for discriminating tissues in diagnosis by providing users the images wherein the physical quantity correlated with strain of tissues of the living body with respect to the compression quantity applied to an object is indexed.BACKGROUND ART[0002]An ultrasonic diagnostic apparatus is for obtaining displacement of the respective areas of the living body by applying pressure to an object to be examined using manual or mechanical method and imaging information related to the hardness of the tissues based on the obtained displacement, whereby enabling proper discrimination of the diseased tissues such as cancer tumors.[0003]For example, a strain image is one of the hardness information of the tissues and is obtained by acquiring strain of the respective areas in the living body through performing spatial differen...

Claims


Application Information

Patent Timeline
Patent Type & Authority Patents(United States)
IPC IPC(8): A61B8/00A61B8/14G01S7/52A61B8/08
CPCA61B8/485A61B8/08A61B8/14G01S7/52071G01S7/52073G01S7/52074G01S7/52042
Inventor MATSUMURA, TAKESHIKAWANO, TOSHIHIKO
Owner FUJIFILM HEALTHCARE CORP
Why Eureka
Try Eureka