

Three dimensional vector cardiograph and method for detecting and monitoring ischemic events
a three-dimensional vector and cardiac muscle technology, applied in the field of three-dimensional vector cardiograph and method for detecting and monitoring ischemic events, can solve the problems of high system redundancy, difficult to determine the net vector effect of this 3-d wave and its relationship to the overall movement of the cardiac muscle, and other techniques such as two-dimensional (2-d) vector cardiograms have proved in the past to be quite expensive and cumbersome, so as to enhance diagnostic analysis, enhance analysis and heart monitoring techniques, and enhance recognition
- Summary
- Abstract
- Description
- Claims
- Application Information
AI Technical Summary
Benefits of technology
Problems solved by technology
Method used
Image

Examples
Embodiment Construction
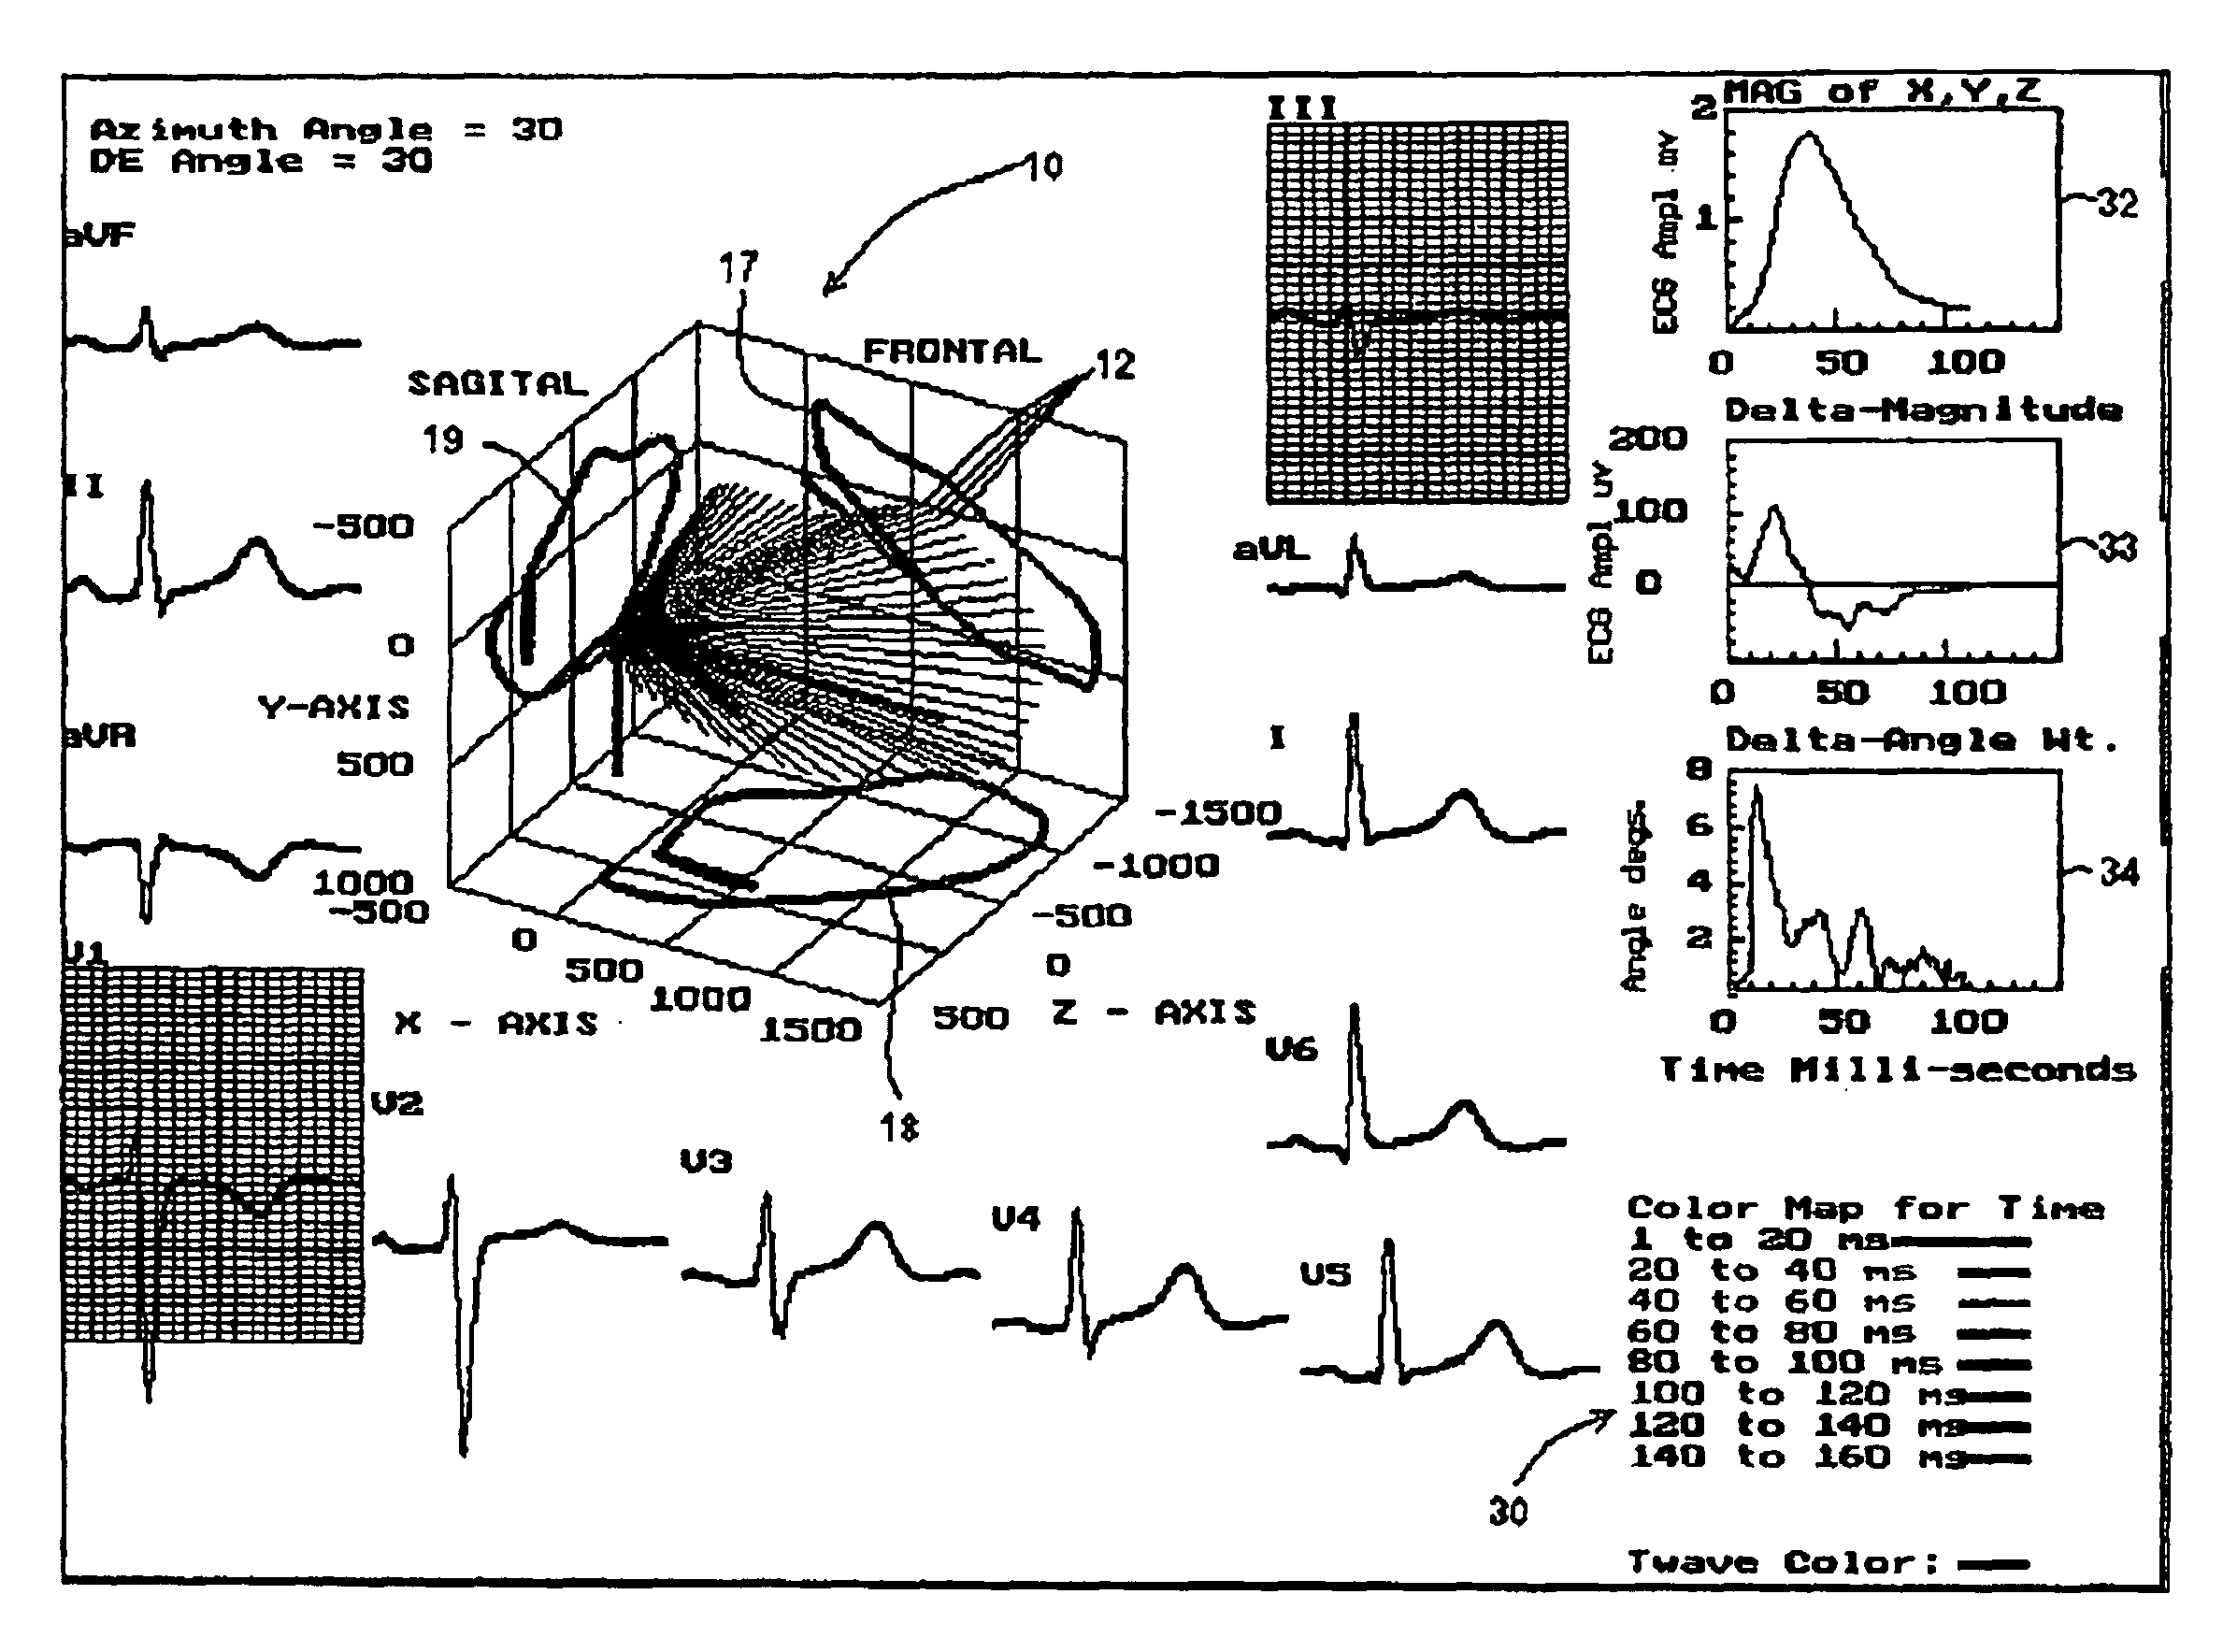
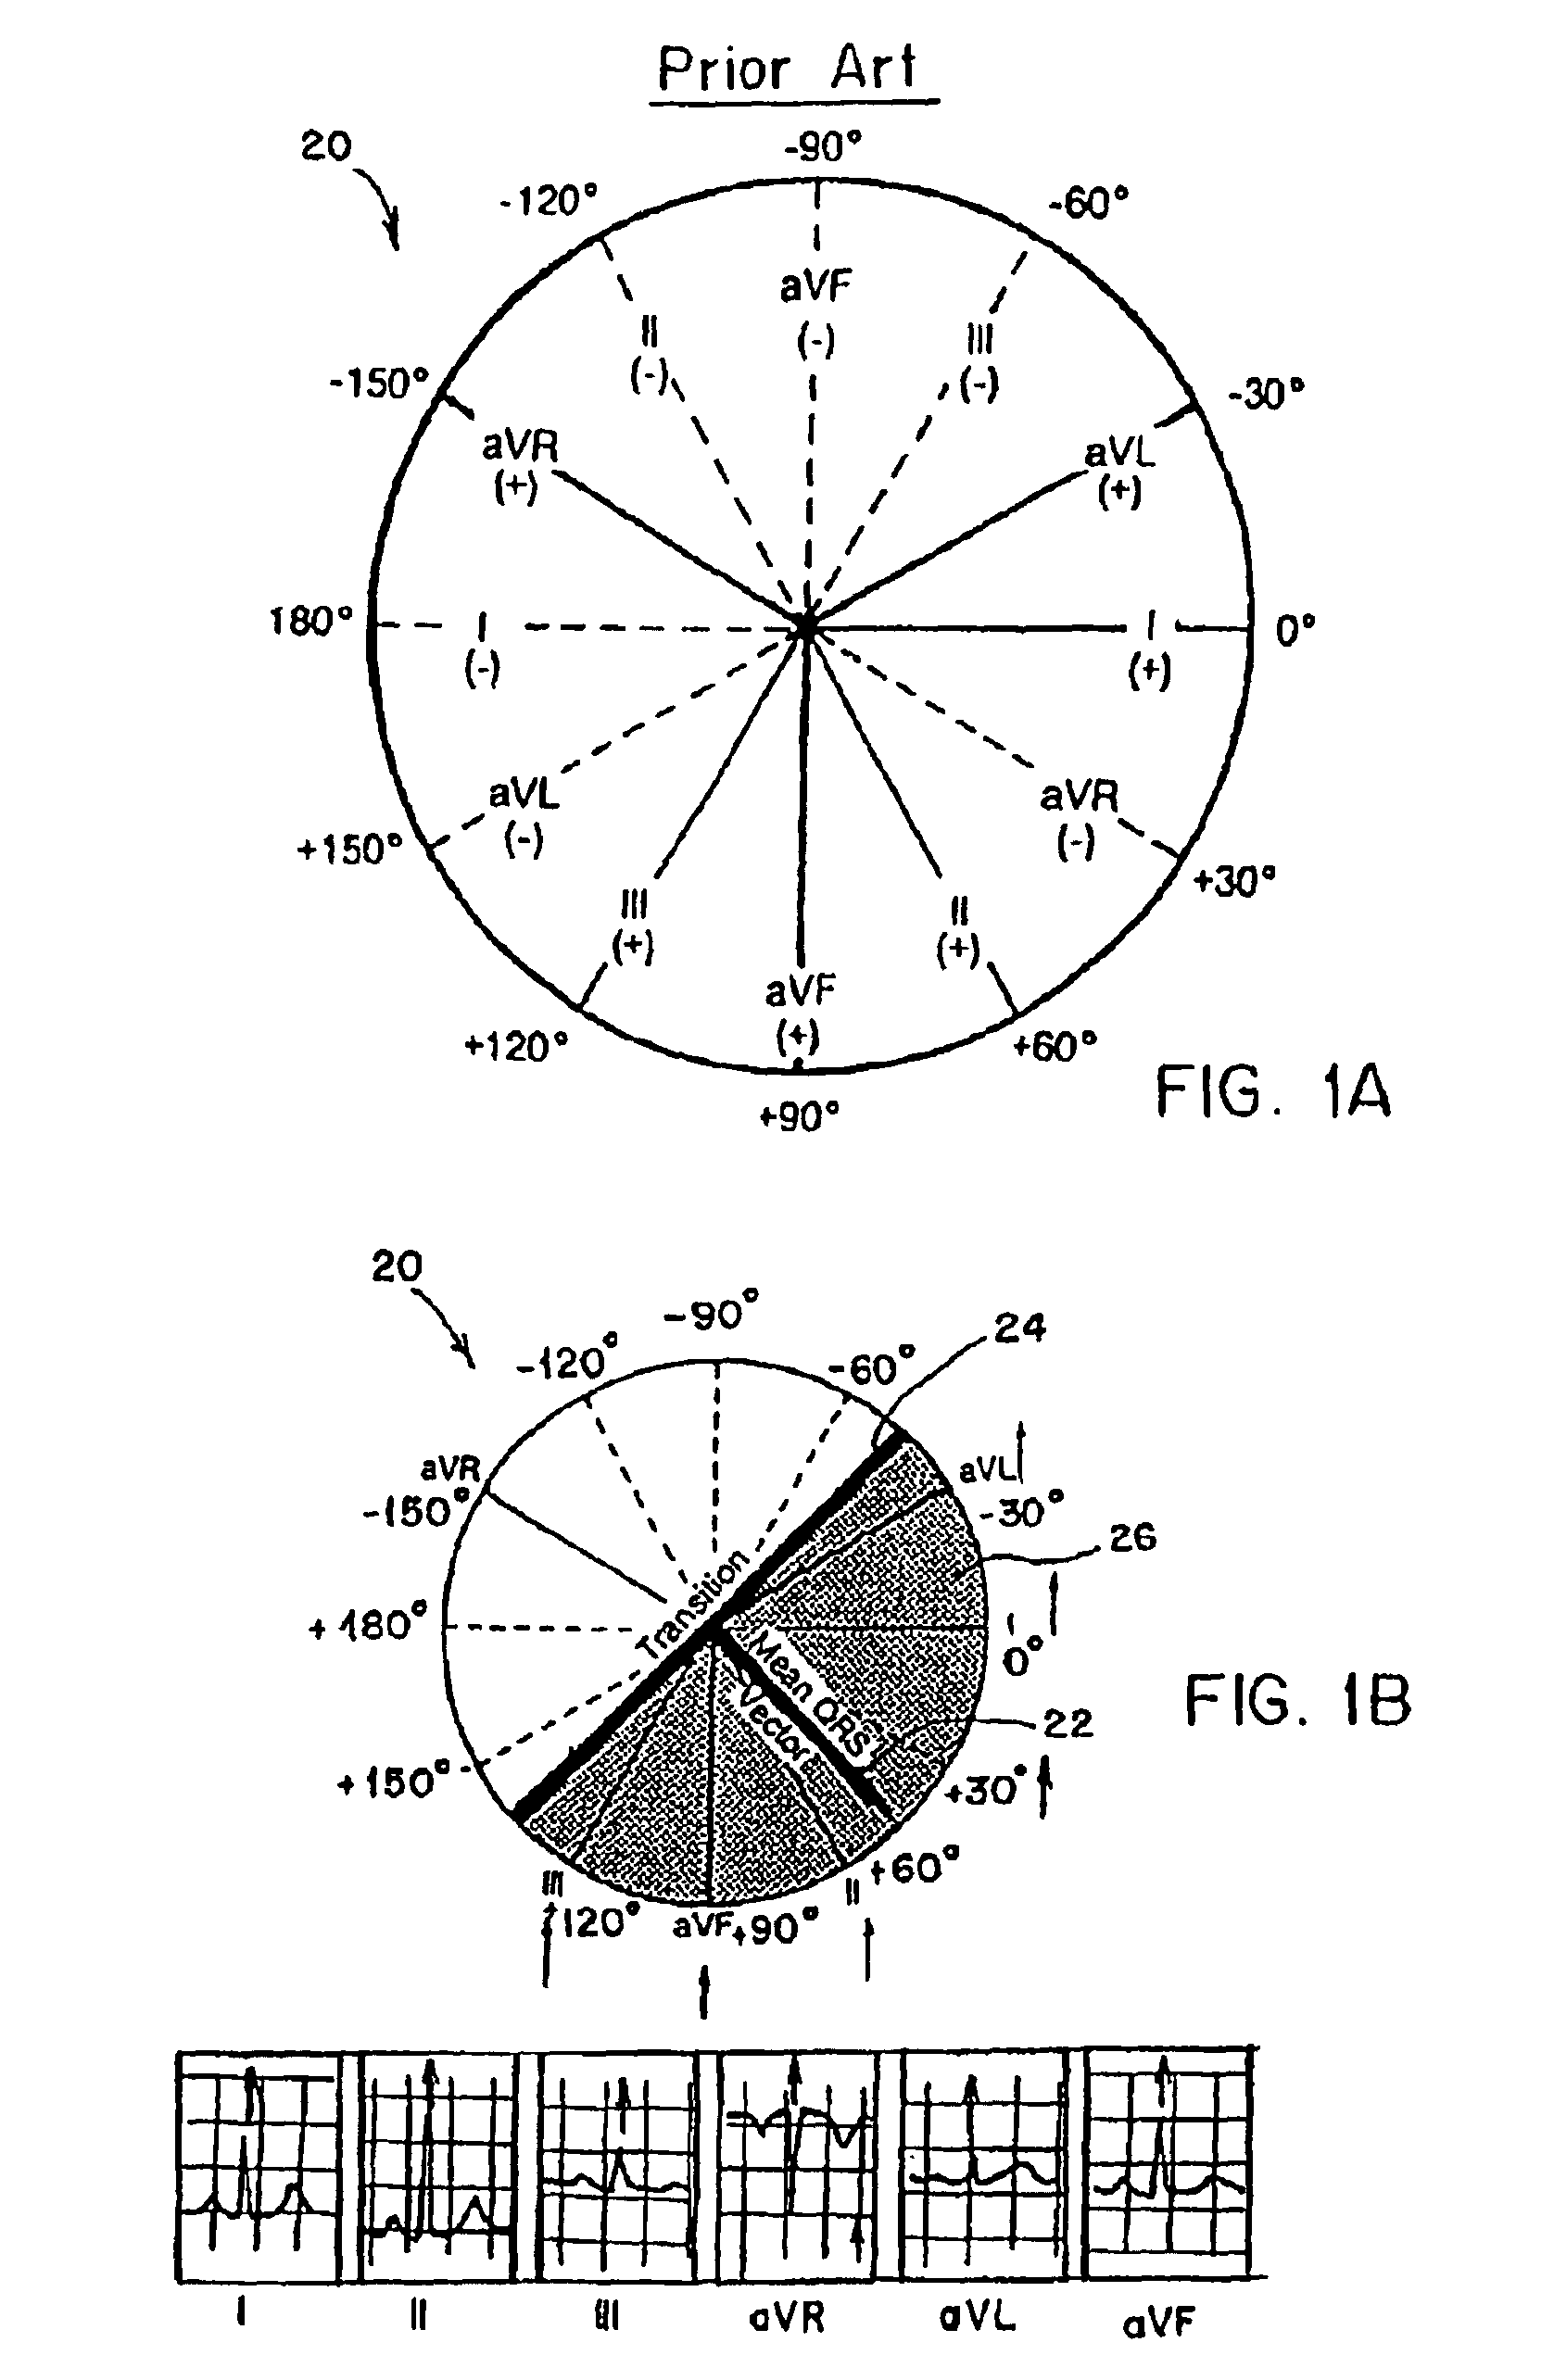
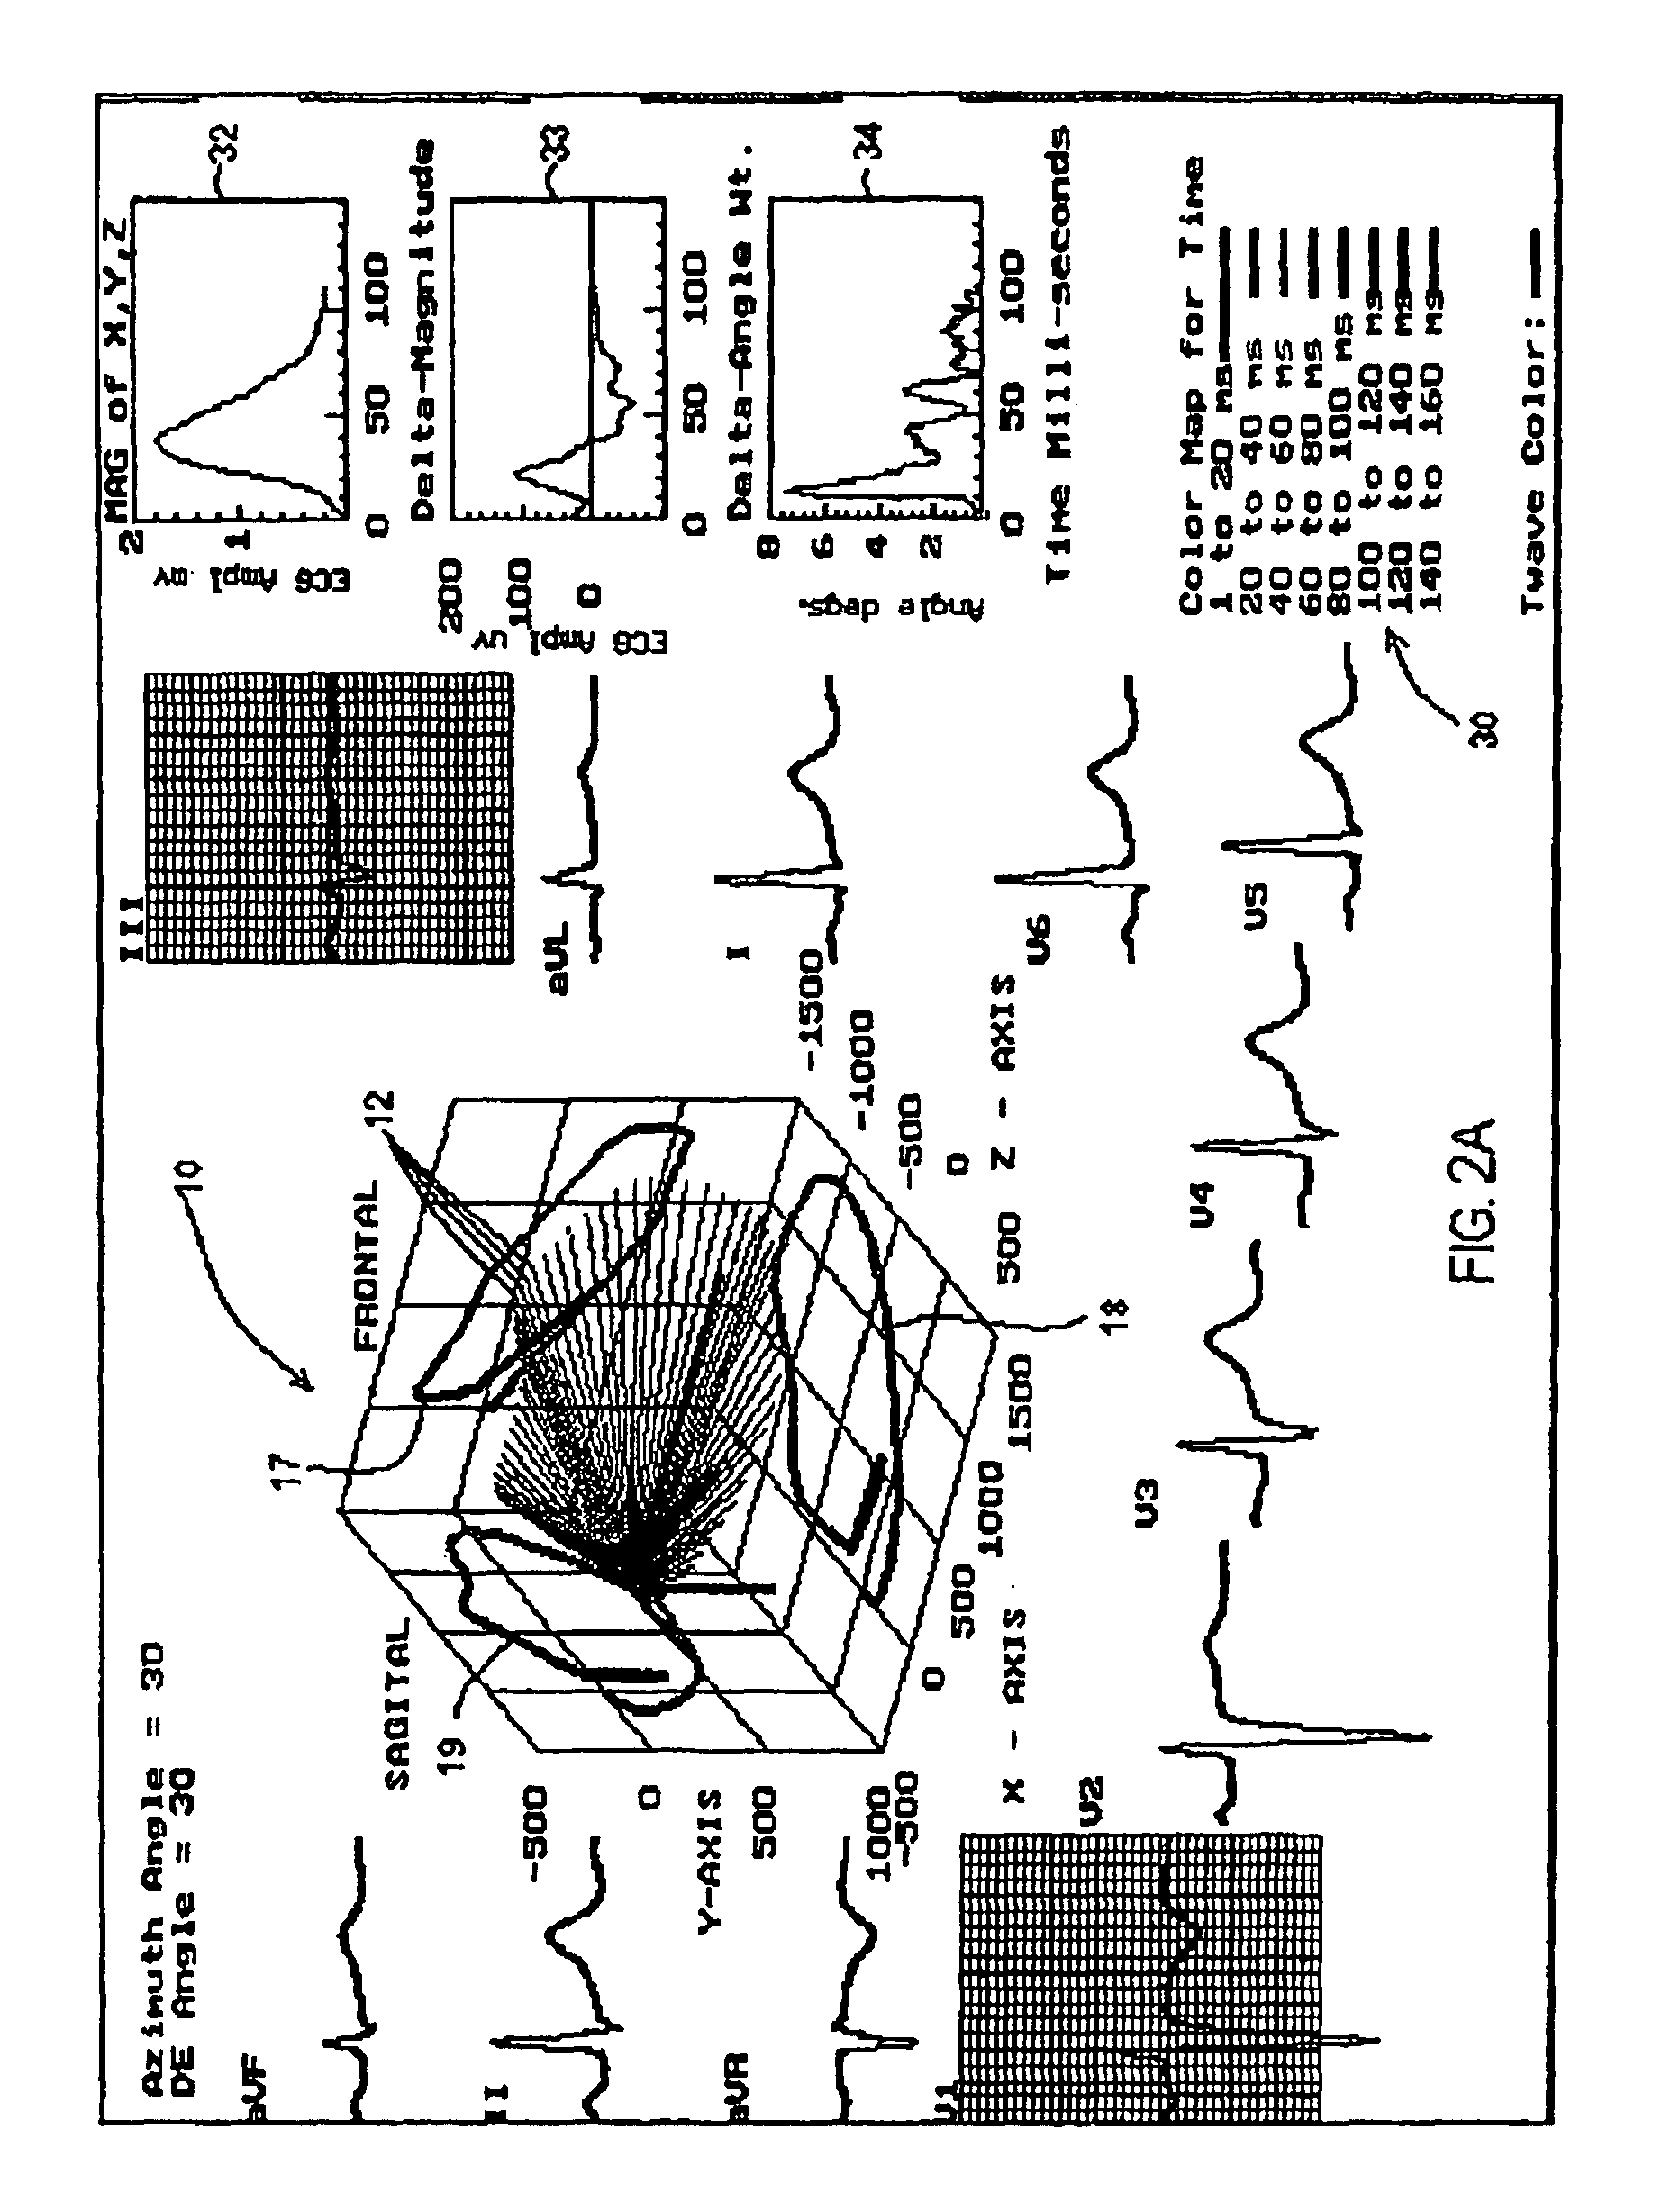
[0081]Conventional cardiographs display electrocardiograph heart signals in vector format within a conventional coordinate system comprising the “x” and “y” axes. The present disclosure relates to a vector cardiograph coordinate system sampled at incremental time intervals which comprises a point of origin and a three-dimensional coordinate system comprising an x-axis, a y-axis and a z-axis extending from the point of origin. As defined, the three dimensional coordinate system includes a frontal plane defined by the area between the x-axis and the y-axis, a sagittal plane defined by the area between the z-axis and the y-axis and a transverse plane defined by the area between the x-axis and the z-axis. One such system is described in commonly-owned U.S. Pat. No. 5,803,084 the entire contents of which is incorporated herein in its entirety. The '084 patent discloses a displaying mechanism which displays the magnitude and location of the signal within a three dimensional coordinate sys...
PUM
 Abstract
Description
Claims
Application Information