Spectral analysis method

A technique of spectral analysis and variance, applied in the field of X-ray fluorescence spectroscopic analysis, can solve problems such as spectral peak distortion, fluorescent spectral peak overlap, and spectral peak reproducibility cannot be guaranteed, and achieve the effect of improving reproducibility

Active Publication Date: 2010-09-01
BEIJING GENERAL RES INST OF MINING & METALLURGY
View PDF0 Cites 16 Cited by
  • Summary
  • Abstract
  • Description
  • Claims
  • Application Information

AI Technical Summary

Problems solved by technology

Among them, X-ray fluorescence spectrum analysis is the key to X-ray fluorescence analysis technology. Identifying spectral peaks and extracting characteristic parameters are important steps to analyze the elements and their contents of the measured object. If the elements of the measured object are complex, the corresponding matrix effect will be Seriously, there are interferences such as tailing, overlapping, and scattering background at the peak of the fluorescence spectrum, which distorts the peak and affects the accuracy of subsequent analysis
In addition, due to the existence of statistical fluctuations, the reproducibility of the spectral peaks obtained by measuring the same standard sample cannot be guaranteed under the condition of constant measurement conditions, which has a great impact on the measurement accuracy of low-content and granular samples.
[0003] Therefore, the existing X-ray fluorescence spectroscopic analysis technology is not accurate enough for the positioning and quantitative analysis of elements

Method used


Image

  • Spectral analysis method
  • Spectral analysis method
  • Spectral analysis method

Examples


Embodiment Construction

[0030] The technical solutions in the embodiments of the present invention will be clearly and completely described below in conjunction with the accompanying drawings in the embodiments of the present invention. It should be understood that the described embodiments are only part of the embodiments of the present invention, not all of them. example. Based on the embodiments of the present invention, all other embodiments obtained by persons of ordinary skill in the art without making creative efforts belong to the protection scope of the present invention.

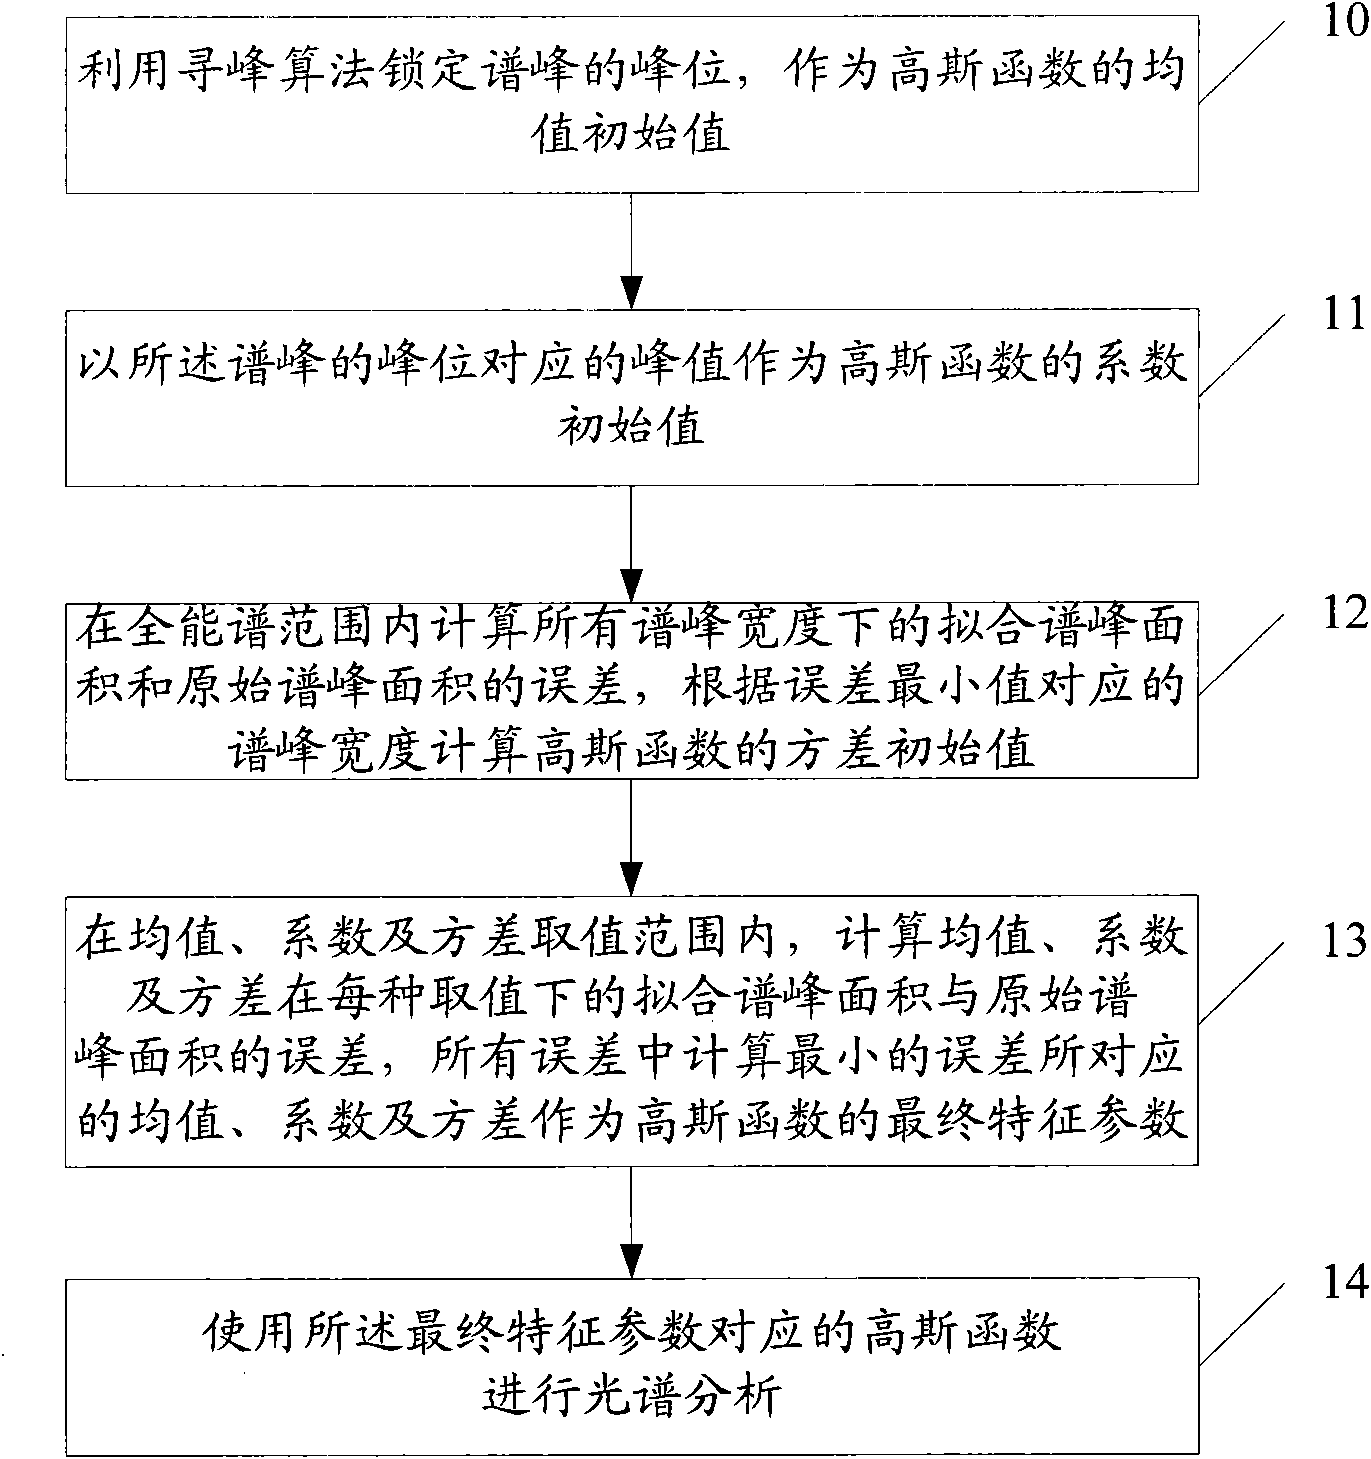
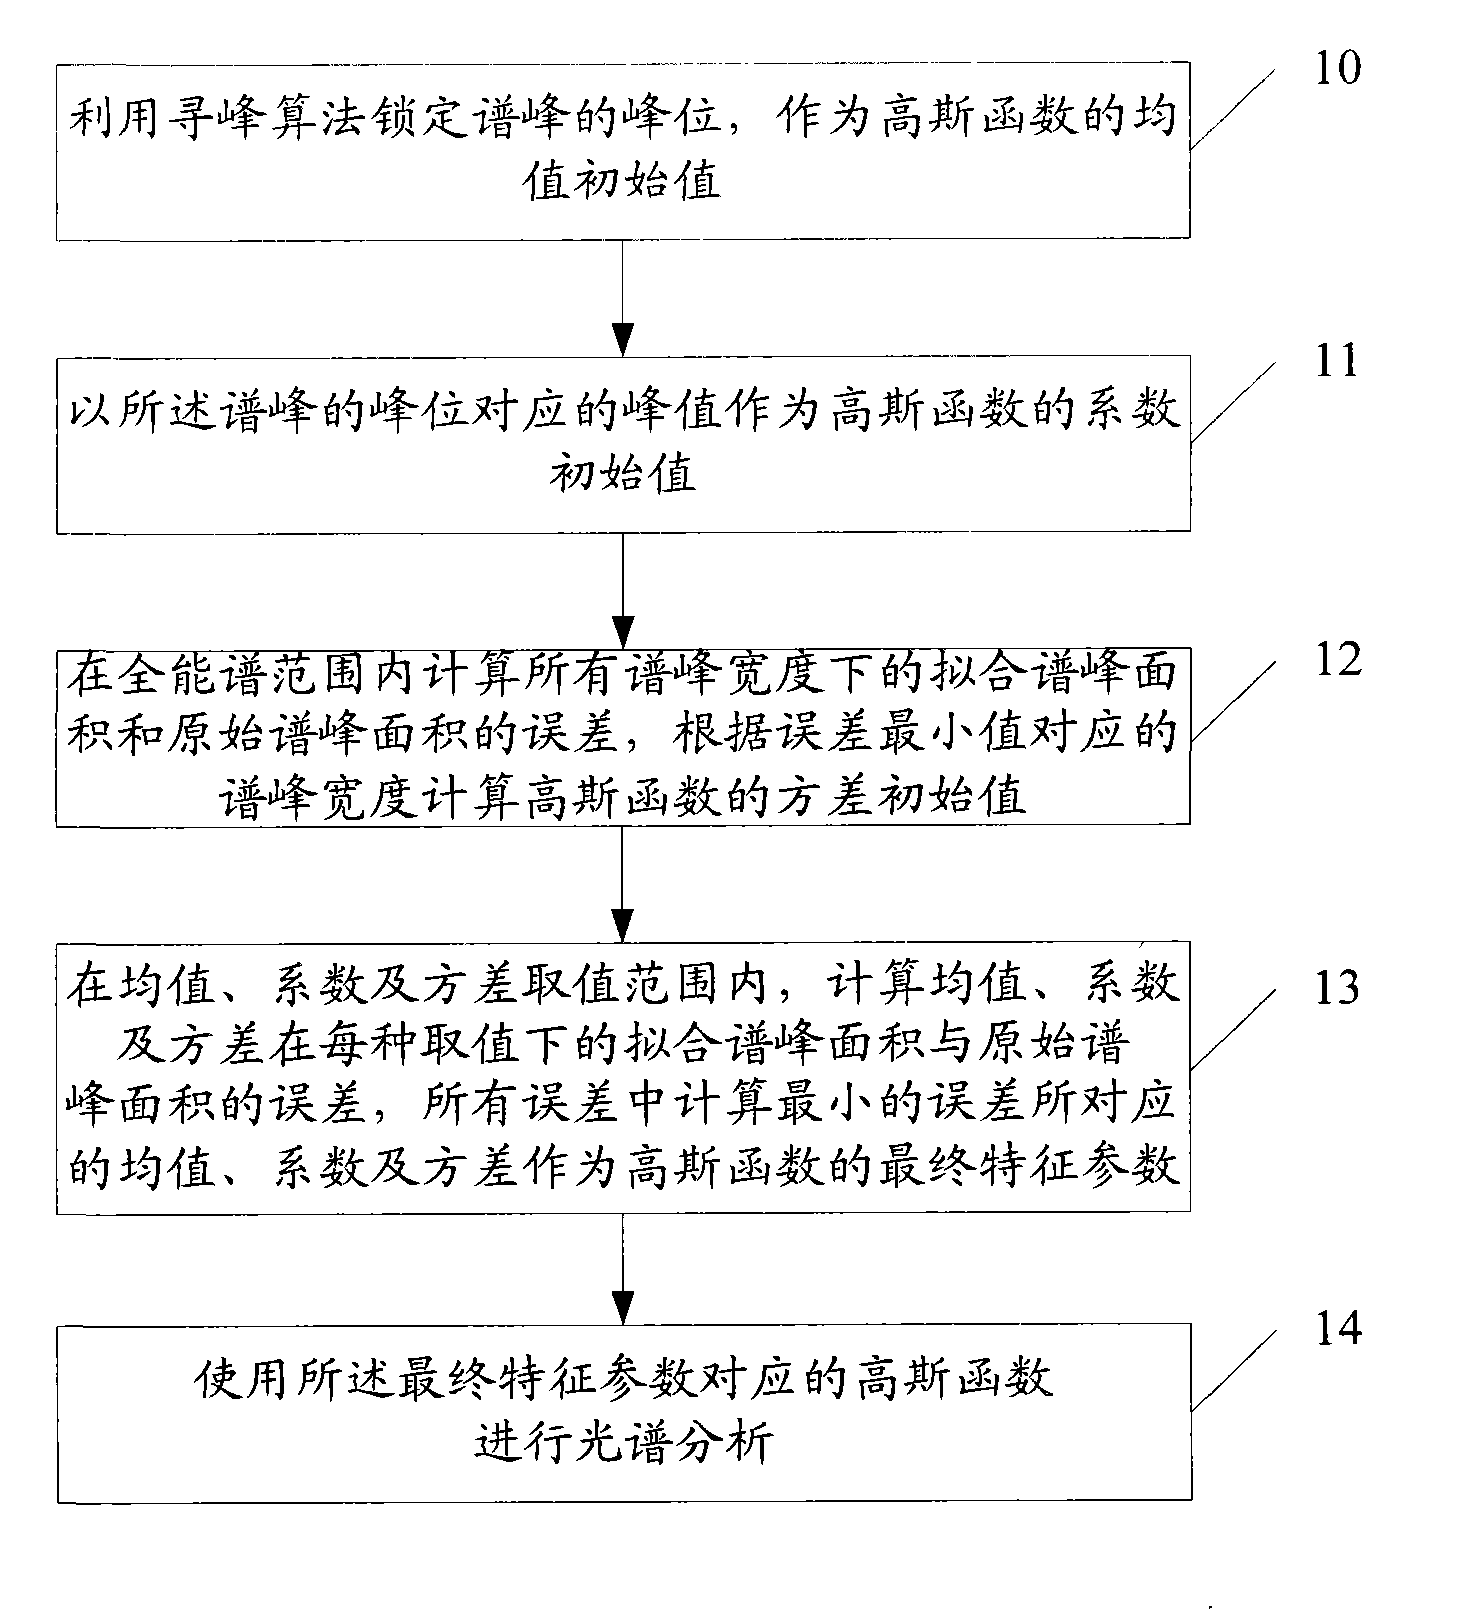
[0031] One embodiment of the present invention provides a spectral analysis method, such as figure 1 shown, including the following steps:

[0032] Step 10: Use the peak-finding algorithm to lock the peak position of the spectral peak as the initial value of the mean value of the Gaussian function;

[0033] In one embodiment of the present invention, the method of peak-finding algorithm to lock the peak position of the ...


PUM


Abstract

The embodiment of the invention relates to a spectral analysis method in the filed of elemental spectral analysis, which comprises the following steps of: locking the peak of a spectral peak as the mean initial value of a Gaussian function by using a peak-detection algorithm; using a peak value corresponding to the peak position of the spectral peak as a coefficient initial value of the Gaussian function; calculating the errors of a fit spectral peak area and the original spectral peak area under all spectral peak widths in the range of the whole energy spectrum, and calculating a variance initial value of the Gaussian function according to the spectral peak width corresponding to the error minimum; calculating the error of the fit spectral peak area and the original spectral peak area under each value of the mean value, the coefficient and the variance in the value range of the mean value, the coefficient and the variance, and calculating the mean value, coefficient and variance corresponding to the minimized error in all the errors to serve as the final characteristic parameters of the Gaussian function; and performing the spectral analysis by using the Gaussian function corresponding to the final characteristic parameters. The spectral analysis method improves the reproducibility of the spectral peak, and provides more accurate and detailed data for subsequent elemental analysis and quantitative analysis.

Description

technical field [0001] The invention relates to the field of element spectrum analysis, in particular to an X-ray fluorescence spectrum analysis method. Background technique [0002] Fluorescence analysis technology is widely used in non-destructive rapid analysis and detection of elements in non-ferrous metals, cement, geological exploration, traceability and other industries. Among them, X-ray fluorescence spectrum analysis is the key to X-ray fluorescence analysis technology. Identifying spectral peaks and extracting characteristic parameters are important steps to analyze the elements and their contents of the measured object. If the elements of the measured object are complex, the corresponding matrix effect will be Seriously, there are interferences such as tailing, overlapping, and scattering background at the peak of the fluorescence spectrum, which distorts the peak and affects the accuracy of subsequent analysis. In addition, due to the existence of statistical fl...

Claims


Application Information

Patent Timeline
Patent Type & Authority Applications(China)
IPC IPC(8): G01N23/223G06F17/00
Inventor 周俊武徐宁李杰赵建军尚海洋杨树亮徐晓东
Owner BEIJING GENERAL RES INST OF MINING & METALLURGY
Why Eureka
Try Eureka