Method and device for improving positioning accuracy of wireless communication system by soft information

A wireless communication system and accuracy technology, applied in radio wave measurement systems, location-based services, positioning, etc., can solve the problems of high computational complexity and high complexity of the maximum similarity algorithm, affecting positioning accuracy, etc.

Inactive Publication Date: 2010-12-01
LINK TECH INC
2 Cites 8 Cited by

AI-Extracted Technical Summary

Problems solved by technology

The disadvantage of the model-based algorithm is that it requires huge channel measurement data to establish an indoor wireless signal transmission model, and due to the high complexity of the indoor environment, it is not easy to establish an accurate wireless signal transmission model, which will affect the accuracy of positio...

Method used

Concept of the present invention relates to the algorithm proposed in the paper "A Novel Indoor RSS-basedPosition Location Algorithm Using Factor Graph" published by the applicant in IEEE TRANSACTIONSON WIRELESS COMMUNICAITON in March, 2009. Please refer to FIG. 2 . FIG. 2 is a schematic diagram of a process 20 of an embodiment of the present invention. The process 20 is used in a positioning system to improve the problem of insufficient positioning accuracy of the existing Receive Signal Strength method. The process 20 assumes that the positioning system is set in an area, where there are base stations AP1-APN, and the base stations AP1-APN can detect the target device entering the area and send radio signals to the target device; at the same time, the positioning system can receive signals from the base stations AP1-APN. APN and received signal strength data of the target device. Process 20 includes the following steps:
In other words, the process 20 produces a Gaussian probability density function corresponding to the input data, and the positioning system can improve the existing method of positioning directly according to the input data of the received signal strength according to the process 20, so that the positionin...

Abstract

The invention discloses a method for improving positioning accuracy of a wireless communication system by soft information, comprising the followings steps: receiving a plurality of input data required by calculating the position of a target device; and generating a plurality of gauss probability density functions corresponding to a plurality of input data for calculating the position of the target device.

Application Domain

Position fixationLocation information based service

Technology Topic

Wireless communication systemsEngineering +5

Image

  • Method and device for improving positioning accuracy of wireless communication system by soft information
  • Method and device for improving positioning accuracy of wireless communication system by soft information
  • Method and device for improving positioning accuracy of wireless communication system by soft information

Examples

  • Experimental program(1)

Example Embodiment

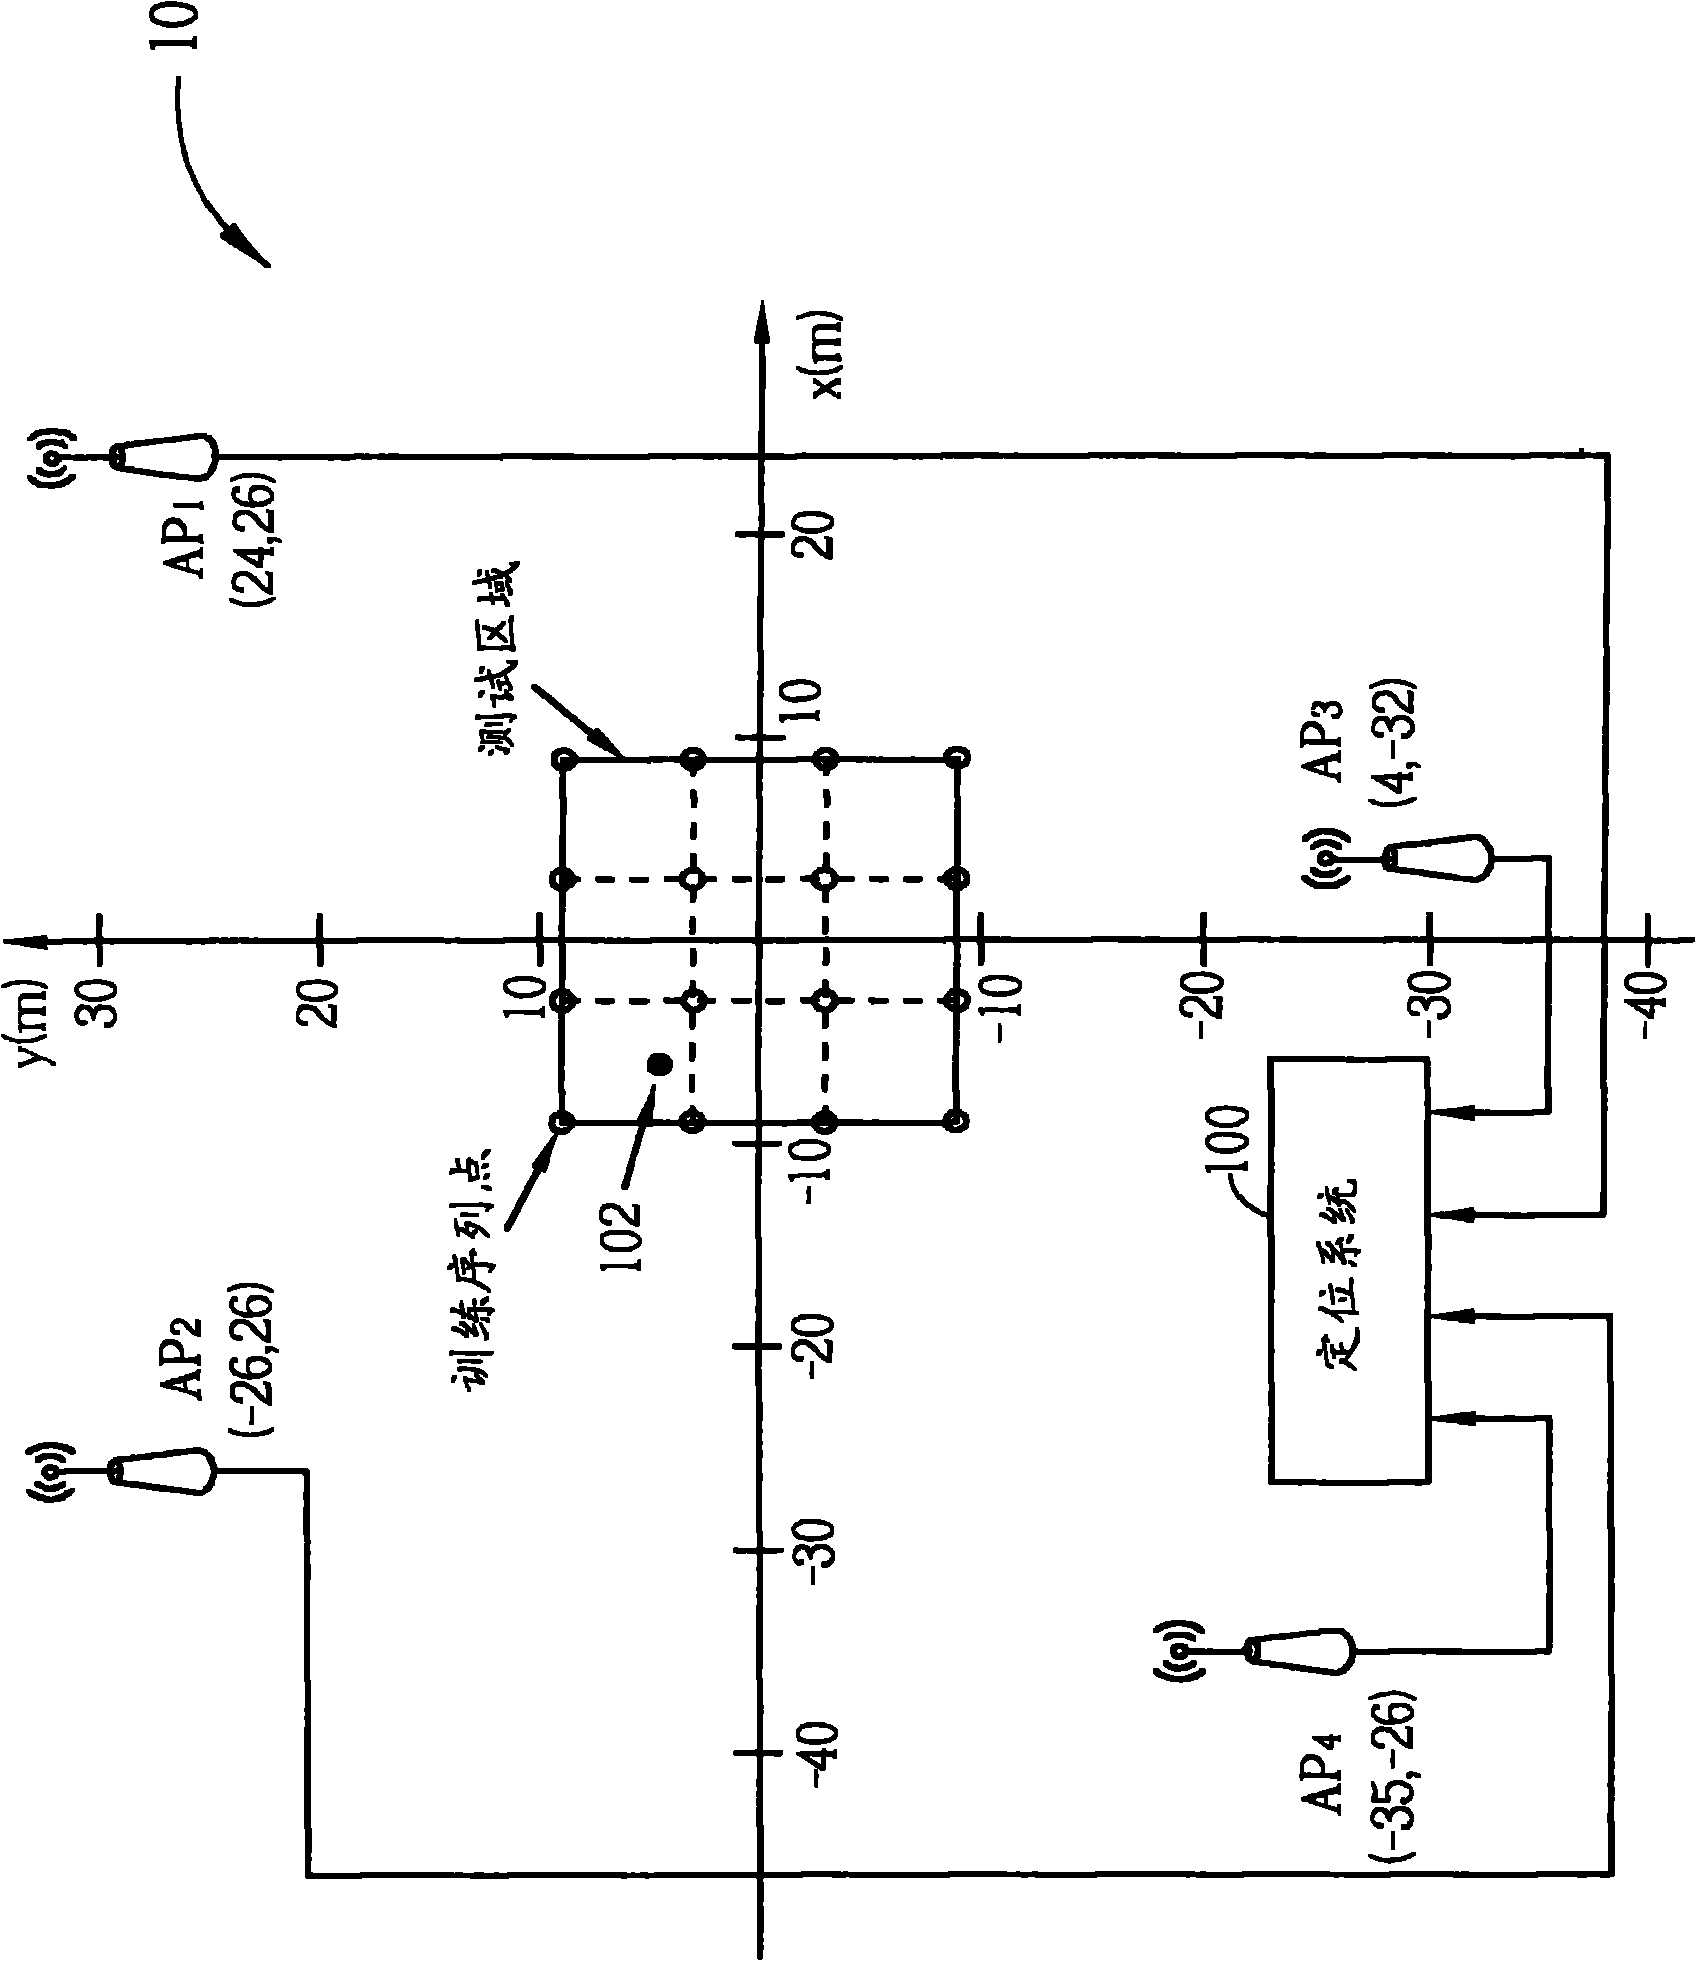
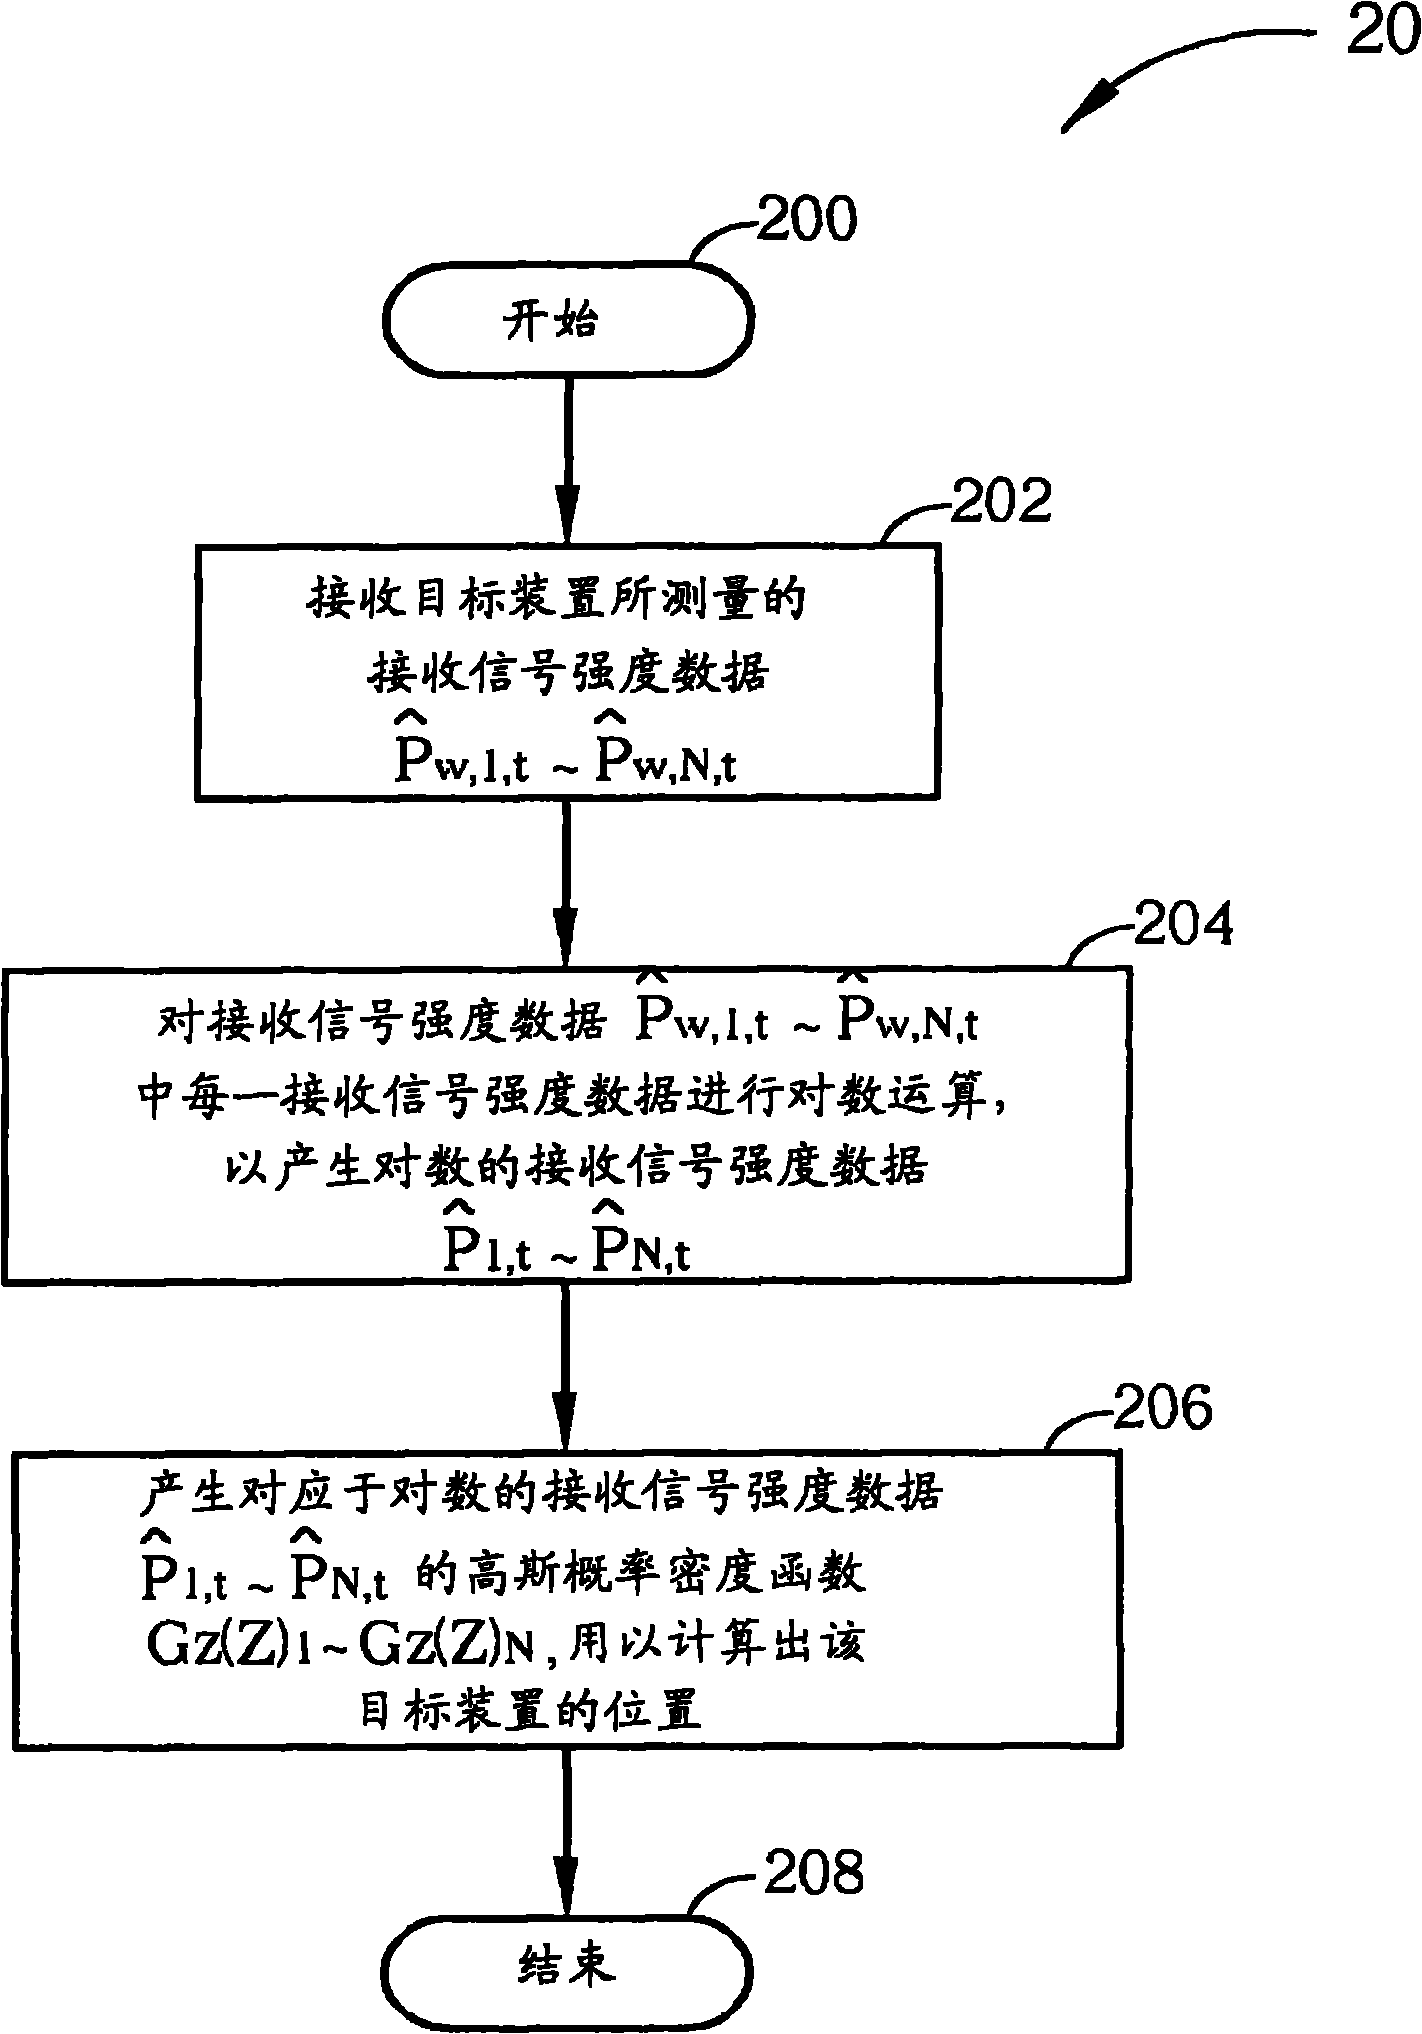
[0023] The concept of the present invention relates to the algorithm proposed by the applicant in the paper "A Novel Indoor RSS-based Position Location Algorithm Using Factor Graph" published in IEEE TRANSACTIONSON WIRELESS COMMUNICAITON in March 2009. Please refer to figure 2 , figure 2 It is a schematic diagram of the process 20 according to an embodiment of the present invention. The process 20 is used in a positioning system to improve the problem of insufficient positioning accuracy of the existing Receive Signal Strength method. Process 20 assumes that the positioning system is set up in an area, where there are base stations AP1 to APN. The base stations AP1 to APN can detect the target device entering this area and transmit radio signals to the target device; at the same time, the positioning system can receive from the base station AP1 to AP1. APN and the received signal strength data of the target device. Process 20 includes the following steps:
[0024] Step 200: Start.
[0025] Step 202: Receive received signal strength data measured by the target device
[0026] Step 204: Check the received signal strength data Logarithmic operation is performed on each received signal strength data to generate logarithmic received signal strength data
[0027] Step 206: Generate received signal strength data corresponding to the logarithm Gaussian probability density function G z (z) 1 ~G z (z) N To calculate the location of the target device.
[0028] Step 208: End.
[0029] In process 20, the positioning system obtains the location of the target device based on the received signal strength data, which is hereinafter referred to as the target location, so the received signal strength data For the positioning system, it is input data. Received signal strength data Received signal strength data It is measured by the target device based on the radio signal received from the base station APi, and then the target device will receive signal strength data Transfer to the positioning system. The received signal strength is expressed in power, which corresponds to the received signal strength data of the base station APi Is expressed as the following equation:
[0030] p ^ w , i , t = p ~ w , i , t + n i - - - ( 1 )
[0031] among them Received signal strength equal to zero error And measurement error n i Sum. According to step 204, the positioning system receives the received signal strength data Afterwards, logarithm operation is performed on the received signal strength data RSSi to generate logarithmic received signal strength data And then generate all logarithmic received signal strength data Is expressed as the following equation:
[0032] p ^ i , t = 10 log 10 ( p ~ w , i , t + n i ) - - - ( 2 )
[0033] The present invention is used for receiving signal strength data The reason for taking the logarithm is that the multiplication and division operations between the received signal strength data can be simplified into addition and subtraction operations. Please note that the measurement error n i That is, the noise of the received signal strength data is that the average value is zero and the variance is The Gaussian Probability Density Function (GaussianProbability Density Function). Therefore, the logarithmic received signal strength data Can be expressed as a probability density function f z (z), as in the following equation:
[0034] f z ( z ) = ( ln 10 ) · 10 z 10 10 · σ n i · 2 π · exp { - ( 10 z 10 - p ~ w , i , t ) 2 2 σ 2 n i } , z = p ^ i , t - - - ( 3 )
[0035] Probability density function f z (z) is not a Gaussian probability density function, but approximates to a Gaussian probability density function. Please refer to image 3 , image 3 Is the probability density function f of the embodiment of the present invention z (z) and Gaussian probability density function G z (z) Graph of received signal strength data, Gaussian probability density function G on the right z (z) 1 And probability density function f z (z) 1 The average value and variance are the same, and its average value is -42.6dB; the Gaussian probability density function G on the left z (z) 2 And probability density function f z (z) 2 The average value and variance are the same, and the average value is -44.6dB. by image 3 It can be seen that the probability density function f with the larger average value z (z), the smaller the variance; on the contrary, the smaller the mean probability density function f z (z), the greater the variance. The above function characteristics indicate that when positioning, the received signal strength data corresponding to the closer base station is more reliable than the received signal strength data corresponding to the far base station.
[0036] In the prior art, the disadvantage of the RADAR algorithm is that the reliability of the position of each training sequence point is not necessarily the same. Although the positioning result obtained by the LANDMARC algorithm is more accurate than that obtained by the RADAR algorithm, the weight value used therein cannot Correctly reflect the geographical distance. In comparison, based on image 3 The characteristics of the probability density function shown, if the target position is determined according to the received signal strength data in the form of the probability density function, also known as the received signal strength data of soft information, it is equivalent to considering the reliability of the received signal strength data Therefore, the positioning accuracy is higher than the LANDMARC algorithm. In addition, by image 3 It can be seen that the Gaussian probability density function G z (z) Approximate to the probability density function f z (z), and the advantage of the Gaussian probability density function is that after multiple Gaussian probability density functions are added and subtracted from each other, they are still Gaussian probability density functions. Based on the above reasons, in step 206, the positioning system approaches the probability density function f with a Gaussian distribution z (z) 1 ~f z (z) N , Generate the received signal strength data corresponding to the logarithm Gaussian probability density function G z (z) 1 ~G z (z) N To determine the target location.
[0037] In other words, the process 20 generates the Gaussian probability density function corresponding to the input data, and the positioning system can then improve the existing method of positioning directly based on the input data of the received signal strength according to the process 20, and the positioning accuracy is therefore improved. For example, in this case The algorithm proposed by the applicant in the paper "A Novel IndoorRSS-based Position Location Algorithm Using Factor Graph" uses a factor graph (Factor Graph) for positioning, and the Gaussian probability density function generated in the process 20 is used in the factor graph. Please refer to Figure 4 , Figure 4 Represents the positioning system according to the algorithm proposed by the applicant in the paper (indicated by FG), the existing 4-NN (4Nearest Neighbor) algorithm (similar to the RADAR algorithm), the LANDMARC algorithm and the maximum similarity algorithm (indicated by ML), obtained The average positioning error vs. the received signal strength data error n i Standard deviation Graph with standard deviation The range is 2×10 -6 Watt to 7×10 -6 watt. The measurement error obtained by the algorithm proposed by the applicant in this case in the paper is significantly smaller than the measurement error obtained by the 4-NN algorithm and the LANDMARC algorithm, and is close to the maximum similarity algorithm with the lowest measurement error. It can be seen that using Gaussian probability density function to calculate the target position can effectively improve the positioning accuracy.
[0038] Please refer to Figure 5 , Figure 5 This is a schematic diagram of the process 50 according to an embodiment of the present invention. The process 50 can also be used in a positioning system to improve the problem of insufficient positioning accuracy of the existing Time of Arrival method. The process 50 includes the following steps:
[0039] Step 500: Start.
[0040] Step 502: Receive the distance data transmitted by the target device
[0041] Step 504: Generate data corresponding to the distance Gaussian probability density function G x (x) 1 ~G x (x) N To calculate the location of the target device.
[0042] Step 506: End.
[0043] In the process 50, the positioning system obtains the target position based on the distance data. For positioning systems, distance data Is the input data, each distance data Is the distance measured by the target device from the base station APi in the base stations AP1-APN, expressed as the following equation:
[0044] d ^ i , k = d i , k + e i , k + e NLOS , i , k - - - ( 4 )
[0045] Where k represents the k-th sampling time, e i, k Is the measurement distance error of Line of Sight (LOS), the mean value is zero and the variance is Gaussian probability density function of; e NLOS, i, k It is the measurement distance error of Non-Line of Sight (NLOS), the mean value is non-zero and the variance is σ 2 NLOS The Gaussian probability density function. Distance data Can be expressed as a probability density function f x (x), Received signal strength data similar to the aforementioned logarithm Probability density function f z (z) feature, the probability density function f of the distance data x (x) also approaches the Gaussian probability density function G x (x), therefore, in step 504, the positioning system approaches the probability density function f with a Gaussian distribution x (x) 1 ~f x (x) N , Generate data corresponding to distance Gaussian probability density function G x (x) 1 ~G x (x) N. Further, the positioning system can use the Gaussian probability density function G in the factor graph based on the time of receipt method, such as the factor graph of the Kalman Filter (Kalman Filter). x (x) 1 ~G x (x) N To determine the target location. Please refer to Image 6 , Image 6 The factor graph of the Kalman filter used for the positioning system and the average positioning error versus time graph obtained using the maximum similarity algorithm, where the dotted line represents the curve obtained using the factor graph of the Kalman filter; the solid line represents the maximum The curve obtained by the similarity algorithm. in Image 6 Among them, the curve with larger error does not consider the case that the input data is soft information; the curve with smaller error is obtained by applying the process 50, which shows that the present invention can significantly improve the positioning error and make the positioning more accurate.
[0046] Please note that the factor graph is only a type of Graphical Model, which graphically represents the relationship between multiple random variables. Therefore, the Gaussian probability density function generated by the process 20 and the process 50 of the embodiment of the present invention is not limited to be used for factor graphs, and can also be used for other appropriate graph models such as Normal Graph or Tannar Graph. . In a wireless communication network, the base station and the target device to be located are defined according to different requirements. In addition, in terms of hardware implementation, the positioning system may be set independently, or may be set on the base station side or the target device side. For example, for the Global Position System (Global Position System), the base station is a positioning satellite, and the target device is a navigation device or a receiving antenna. The positioning system is usually set on the side of the target device; for a wireless local area network system, the base station is a wireless Access Point, the target device is a wireless network card or related network equipment, and the positioning system is usually set on the side of the base station; for radio frequency identification (RFID) systems, the radio frequency identification reader (Reader) is the base station, and the radio frequency identification The tag is the target device, and the positioning system may be installed on the base station side or independently. Please note that since the present invention can significantly improve the positioning inaccuracy caused by the multipath effect, it is more suitable for indoor positioning systems, but is not limited to indoor positioning systems.
[0047] In summary, the present invention considers the data reliability of the input data used to calculate the target position in the positioning system, and generates a Gaussian probability density function corresponding to the input data to perform positioning operations. Therefore, the present invention can improve the positioning accuracy in either the reception strength method, the reception time method or other similar positioning technologies.
[0048] The above are only preferred embodiments of the present invention, and all equivalent changes and improvements made according to the claims of the present invention should fall within the scope of the present invention.

PUM

no PUM

Description & Claims & Application Information

We can also present the details of the Description, Claims and Application information to help users get a comprehensive understanding of the technical details of the patent, such as background art, summary of invention, brief description of drawings, description of embodiments, and other original content. On the other hand, users can also determine the specific scope of protection of the technology through the list of claims; as well as understand the changes in the life cycle of the technology with the presentation of the patent timeline. Login to view more.
Why Eureka
Try Eureka