Method for measuring dissolving and precipitating temperatures of precipitated phase in steel and iron material
A technology of precipitation temperature and iron and steel materials, applied in the field of precipitation temperature and measuring the dissolution of precipitation phase in iron and steel materials, can solve the problems of complicated testing process and no experimental measurement method that can give precipitation phase precipitation and dissolution temperature, etc. The measurement method is simple, the test method is simple, and the temperature accuracy of the test is high.
- Summary
- Abstract
- Description
- Claims
- Application Information
AI Technical Summary
Problems solved by technology
Method used
Image
Examples
Embodiment 1
[0028] Example 1 AlN and VC precipitation, measurement of dissolution temperature
[0029] (1) Sampling: Take 80mg of a certain steel with Al, V, N added. The steel composition is shown in the table below:
[0030] C
Si
mn
P
S
Al
V
Ti
N
0.161
0.41
1.45
0.011
0.0039
0.041
0.05
0.004
0.0036
[0031] Grind the surface of the sample with sandpaper to remove iron oxide scale, then ultrasonically clean it with alcohol solution for 2 minutes, and wait for the sample to dry before use.
[0032] (2) Calorimetric scanner test and draw curve:
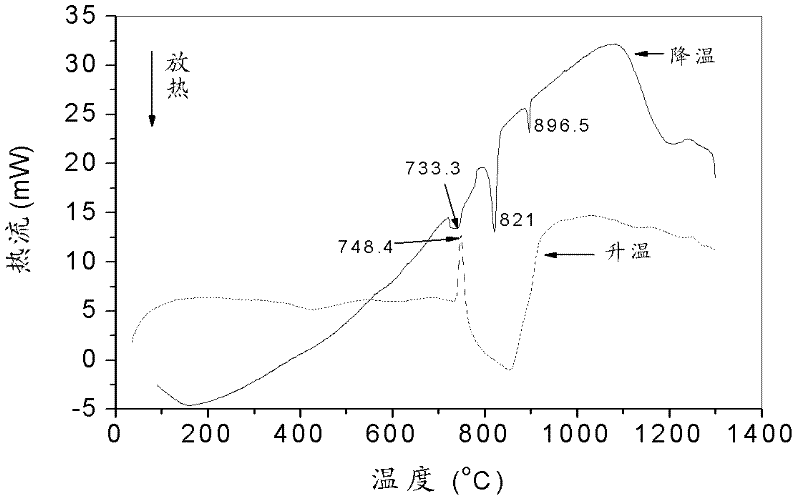
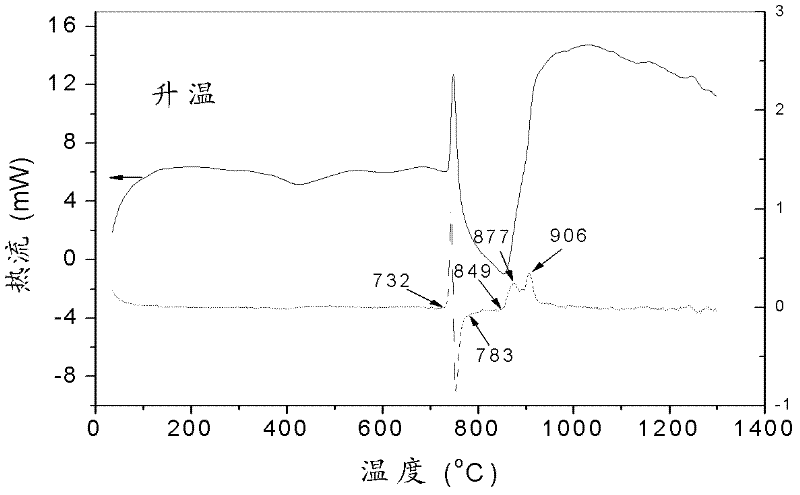
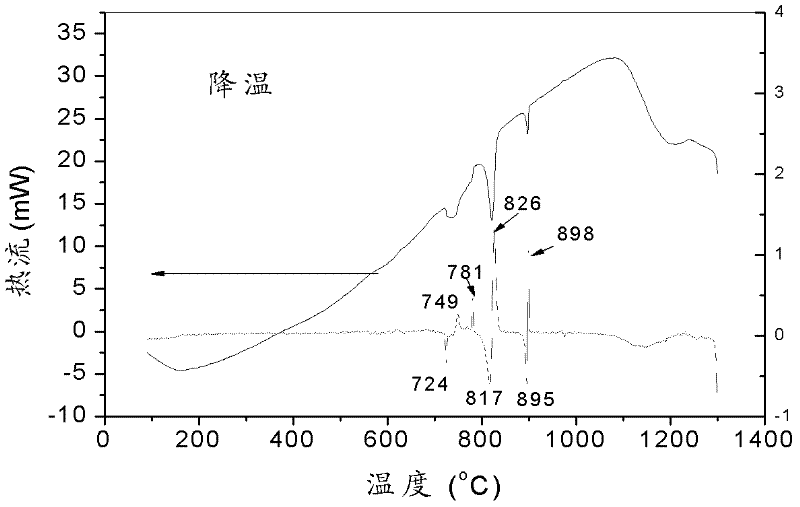
[0033] Temperature measuring range: 30~1300°C; heating and cooling rate: 10°C / min. After the test, the temperature-heat change curve is as follows: figure 1 shown. From figure 1 It can be roughly seen that a reaction occurs at 748.4°C during the heating process. During the cooling process, reactions occurred at 896.5°C, 821°C...
Embodiment 2
[0040] The precipitation temperature measurement of embodiment 2TiC
[0041] (1) Sampling: Take 18 mg of a steel with Ti and N added. The steel composition is shown in the table below:
[0042] C
Si
mn
P
S
Ti
Al
N
0.12
1.36
1.85
0.009
0.005
0.15
0.053
0.0048
[0043] Grind the surface of the sample with sandpaper to remove iron oxide scale, then ultrasonically clean it with alcohol solution for 2 minutes, and wait for the sample to dry before use.
[0044] (2) Calorimetric scanner test and draw curve:
[0045]Temperature measurement range: 30-1300°C; heating rate: 20°C / min, cooling rate: 10°C / min. Only the data of the cooling section is measured. After the test, the temperature-calorie change curve and its primary differential results are as follows: Figure 6 shown. From Figure 6 It can be seen from the figure that obvious reactions occurred at 1118°C, 903-905°C, 8...
PUM
 Abstract
Description
Claims
Application Information
 - R&D
- Intellectual Property
- Life Sciences
- Materials
- Tech Scout
- Unparalleled Data Quality
- Higher Quality Content
- 60% Fewer Hallucinations
Browse by: Latest US Patents, China's latest patents, Technical Efficacy Thesaurus, Application Domain, Technology Topic, Popular Technical Reports.
© 2025 PatSnap. All rights reserved.Legal|Privacy policy|Modern Slavery Act Transparency Statement|Sitemap|About US| Contact US: help@patsnap.com


