

Multi-focus image fusion method based on compressive sensing
A multi-focus image, compressed sensing technology, applied in the field of image processing, can solve the problems of high computational complexity, noise and stripes in fusion results, and achieve the effect of good visual effect, small amount of data, and saving storage space.
- Summary
- Abstract
- Description
- Claims
- Application Information
AI Technical Summary
Problems solved by technology
Method used
Image

Examples
Embodiment Construction
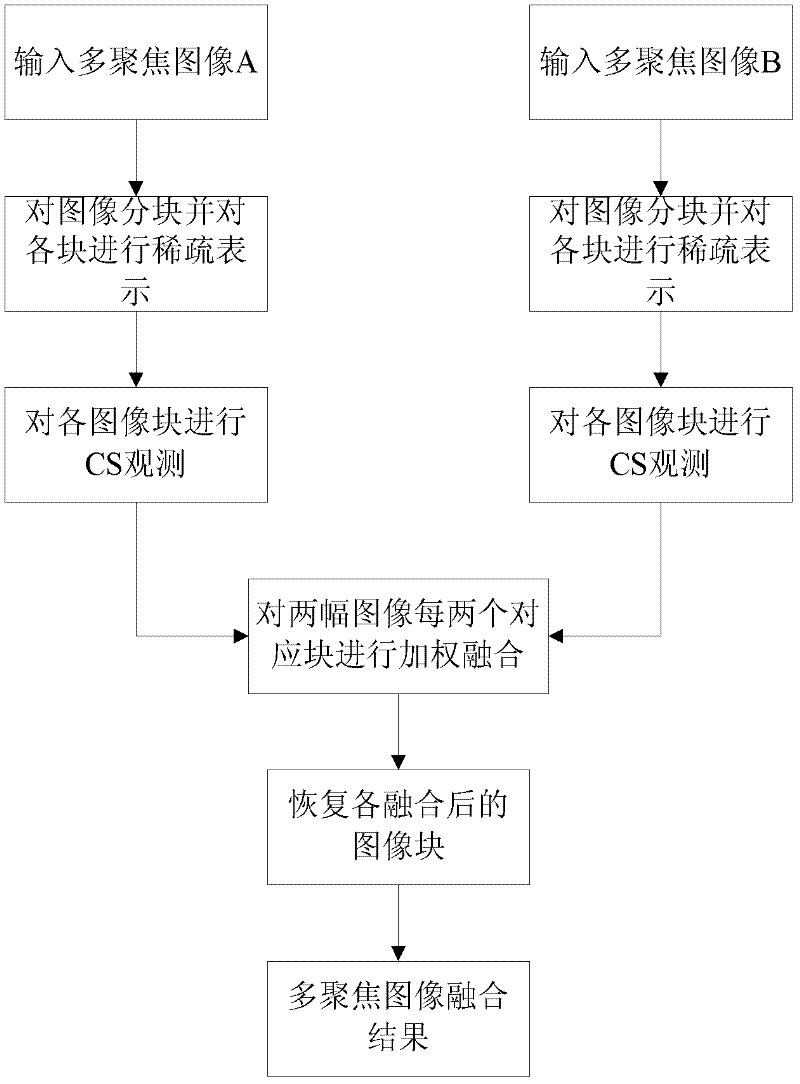
[0029] refer to figure 1 , the specific implementation steps of the present invention are as follows:
[0030] Step 1. Block the two input multi-focus images A and B and calculate the average gradient of each image sub-block and
[0031] Images A and B are two left-focused and right-focused images respectively, and the information in the clear part of the two images is complementary, and the purpose is to obtain a fully focused image with clear left and right sides through fusion. The image is divided into blocks, which is beneficial to processing and can reduce the computational complexity. The present invention divides the two multi-focus images A and B into image sub-blocks with a size of 32×32, and calculates the average gradient of each image sub-block , calculated according to the following formula:
[0032] ▿ G ‾ I = 1 M × ...
PUM
 Abstract
Description
Claims
Application Information