Apparatus and method for event correlation and problem reporting

a technology of event correlation and problem reporting, applied in the field of event correlation, to achieve the effect of effective monitoring, increasing the efficiency of automated problem identification, and increasing efficiency

Inactive Publication Date: 2006-09-12
VMWARE INC
View PDF3 Cites 138 Cited by
  • Summary
  • Abstract
  • Description
  • Claims
  • Application Information

AI Technical Summary

Benefits of technology

[0055]The invention provides a method and apparatus for using a formal machine-compilable language to capture event information and event propagation information in a system based on classes of components in the system. This captured information may then be used to determine which symptoms can be most effectively monitored in order to achieve a selected degree of certainty with respect to problem identification and isolation. The captured information may also be selectively reduced to increase the efficiency of automated problem identification.
[0056]The invention further provides a method and apparatus for generating a causality matrix for a dynamically changing system from static event information and event propagation information for component classes, and the dynamic specification of a particular system configuration. The causality matrix may be used to decode problems in the system based on observable symptoms with increased efficiency.
[0057]The invention further provides a method and apparatus for detecting problems in a dynamically changing system through the use of efficient “codes” (sets of symptom events); the “codes” may be determined and optimized outside the critical real-time path, making it possible to optimize performance in the real-time path.
[0058]The invention further provides a method and apparatus for decoding observed symptoms in a dynamically changing system to efficiently detect and identify problems in real-time by comparing vectors of observed symptoms to “codes” for the problems. A mismatch measure can be used to vary the degree of certainty required in reporting particular problems. Additional advantages of the present invention will become apparent through the following detailed explanation and the drawings incorporated herein,

Problems solved by technology

(1) Specifying an event model and a propagation model for classes of components in the system. This specification can be provided as early as component design time or later. The specification may include the exceptional events associated with each class of component, their corresponding local symptoms, and the potential relationships with other components along which events can propagate. An exceptional event may be an event that requires some handling action (e.g., a problem such as a defective disk drive, or adding a workstation to a LAN) while a symptom may be an observable event (e.g., excessive read / write errors for the disk, or a change in routing tables) caused by the exceptional event. Events may propagate between objects along relationships associated with their classes. For example, components of a type “LINK” may have an exceptional event “LINK FAILURE”. Links may have a relationship “connected-to” with components of type NODE. Link failure can propagate from a LINK to a NODE along this “connected-to” relationship, being observed in NODE via the symptom “NODE-UNREACHABLE”.
(2) Creating a causality data representation of problems and symptoms for the system to be monitored (the term “problem” as used in this specification will be understood to mean any exceptional event). The causality data representation includes data to describe problems, events and their causal relations both within a component and across components. This representation may associate with causal relations probabilities, or other measures of likelihood, that certain events cause each other. It may also associate other performance measures that may be useful in correlating events, such as the expected time for the causal relations among events to happen. In a preferred embodiment the causality data representation utilizes a matrix. This causality matrix contains a mapping of symptoms to likely problems in the systems, with probabilities for each cell of the matrix. The matrix is manipulated to ensure that columns are sufficiently distinguishable from one another (i.e., no two problems are close to one another under a defined distance measure). A distance measure, which can be defined arbitrarily, adds robustness by allowing the invention to tolerate a loss of events or spurious symptoms. (In a rule-based system, a large number of combinations of subsets of the rules would need to be tried to get the same effect).

Method used


Image

  • Apparatus and method for event correlation and problem reporting
  • Apparatus and method for event correlation and problem reporting
  • Apparatus and method for event correlation and problem reporting

Examples


Embodiment Construction

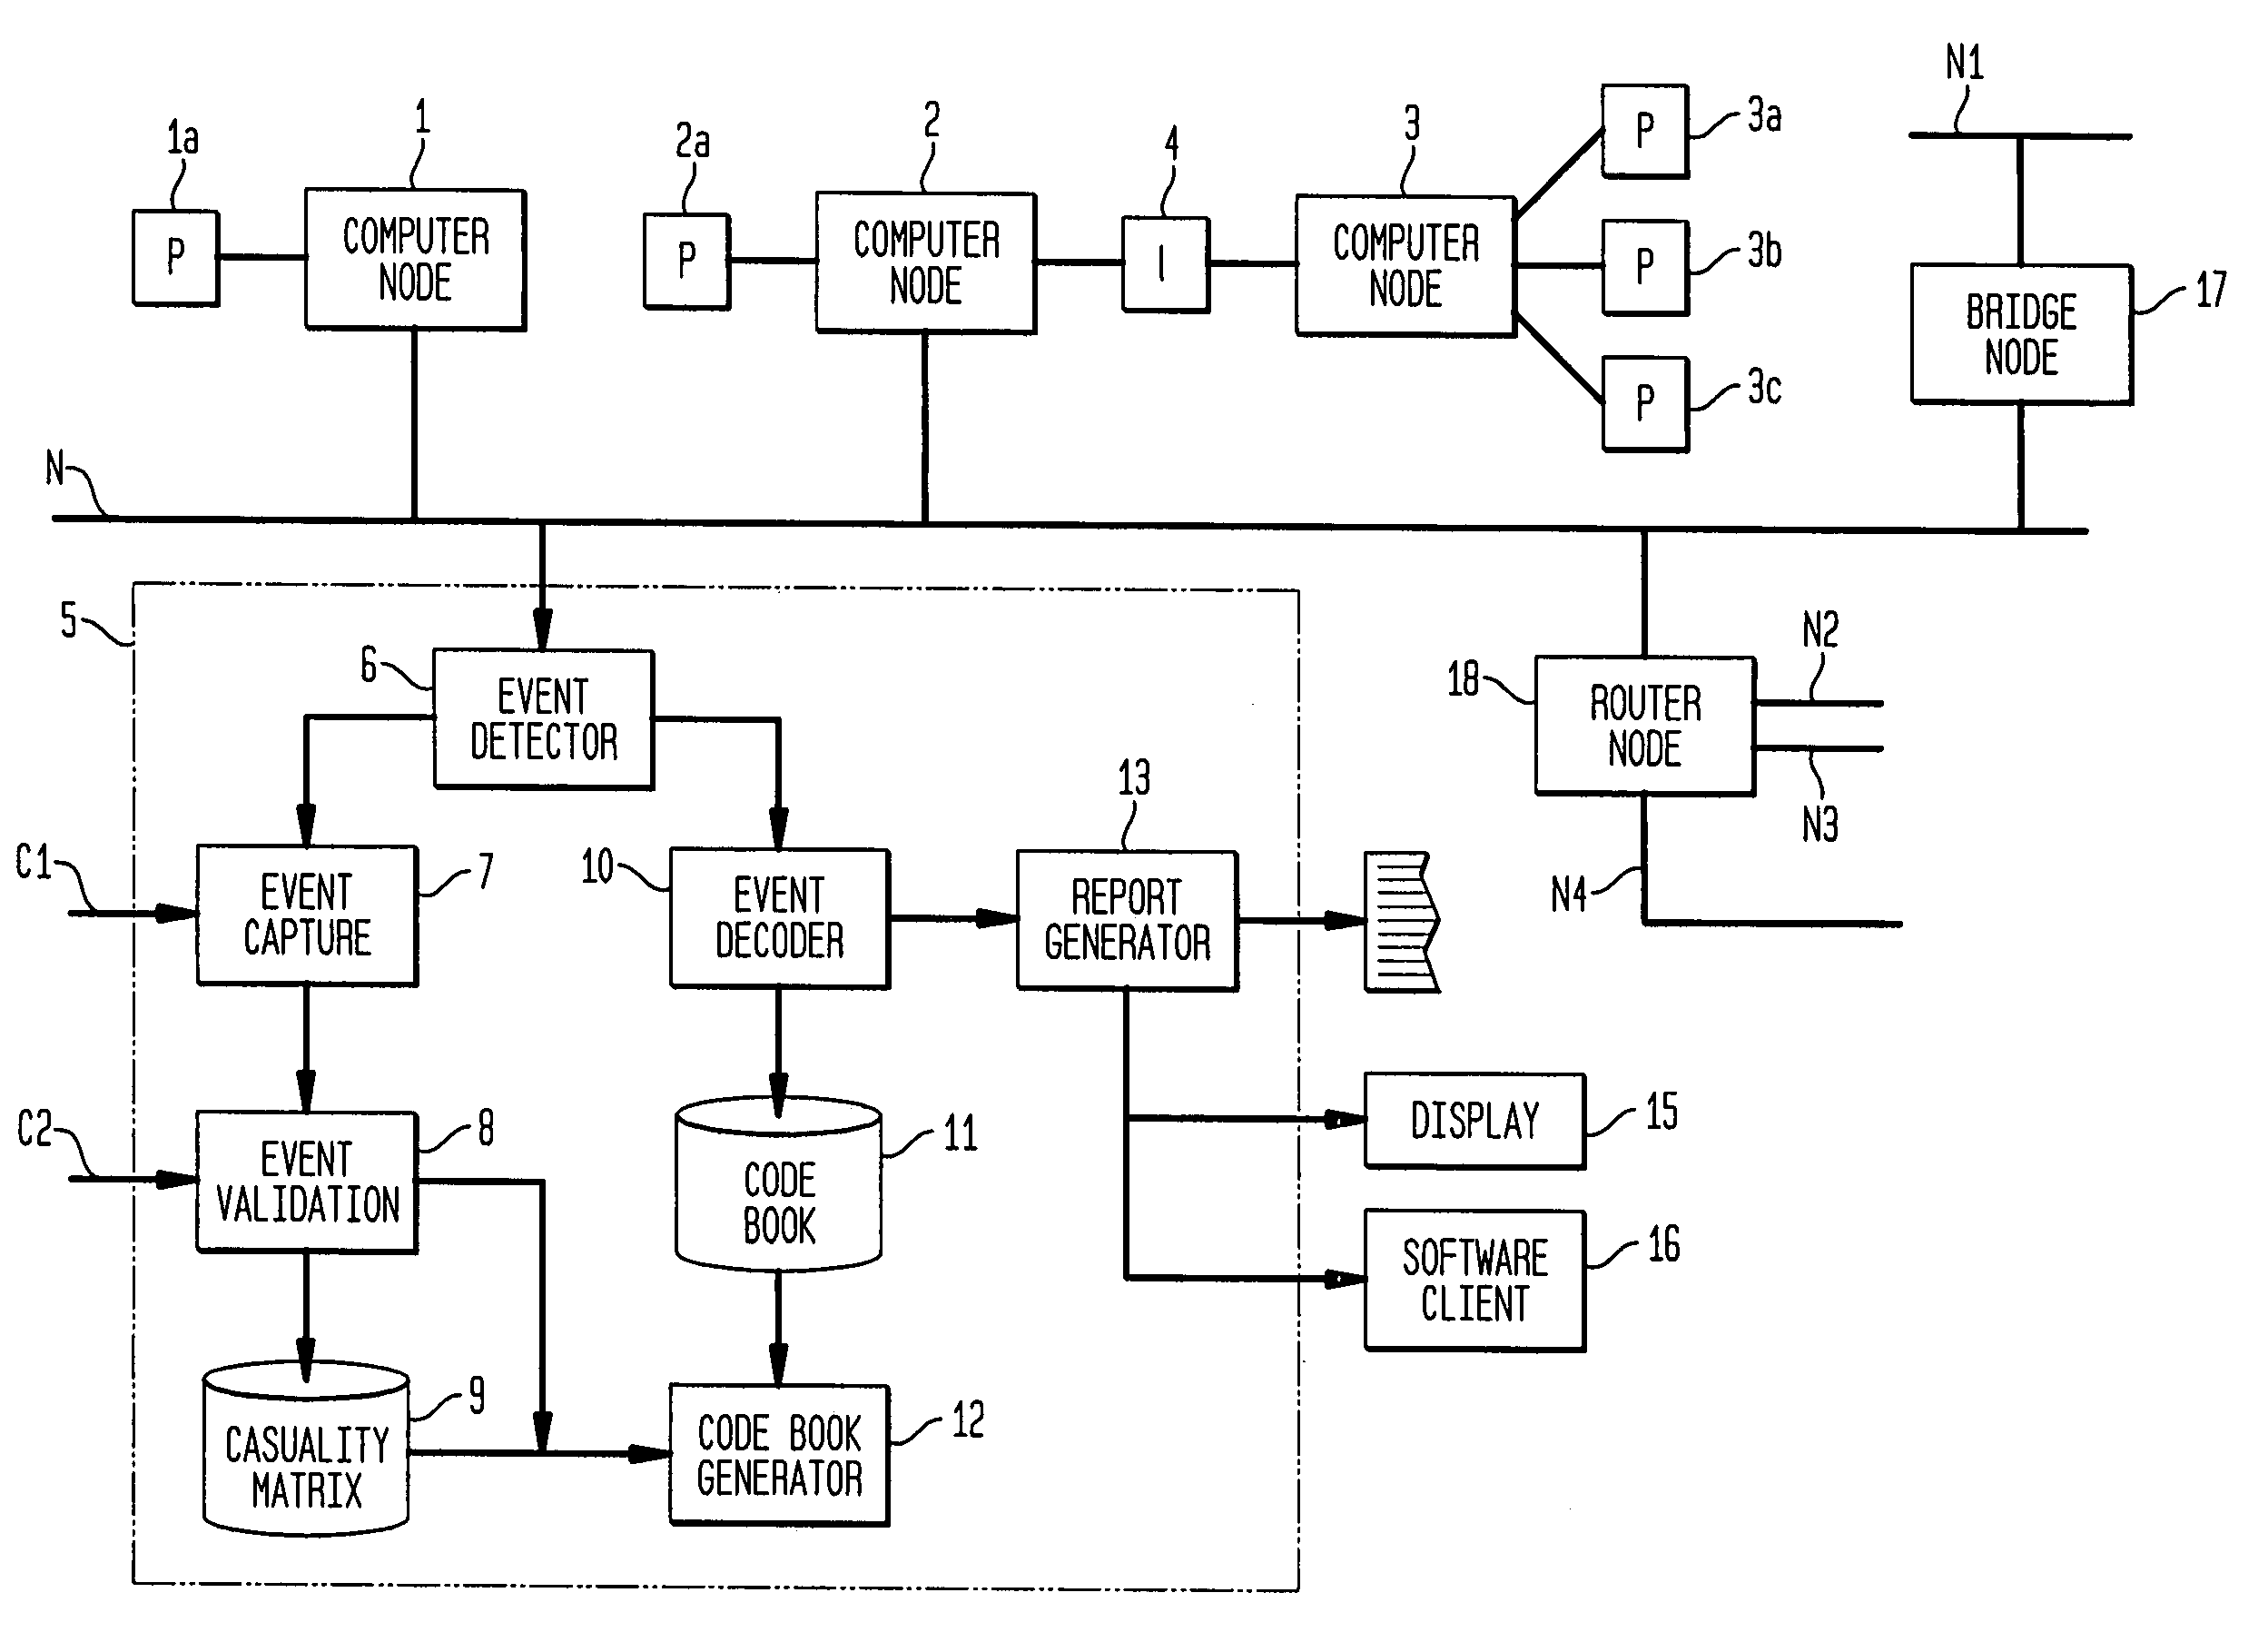
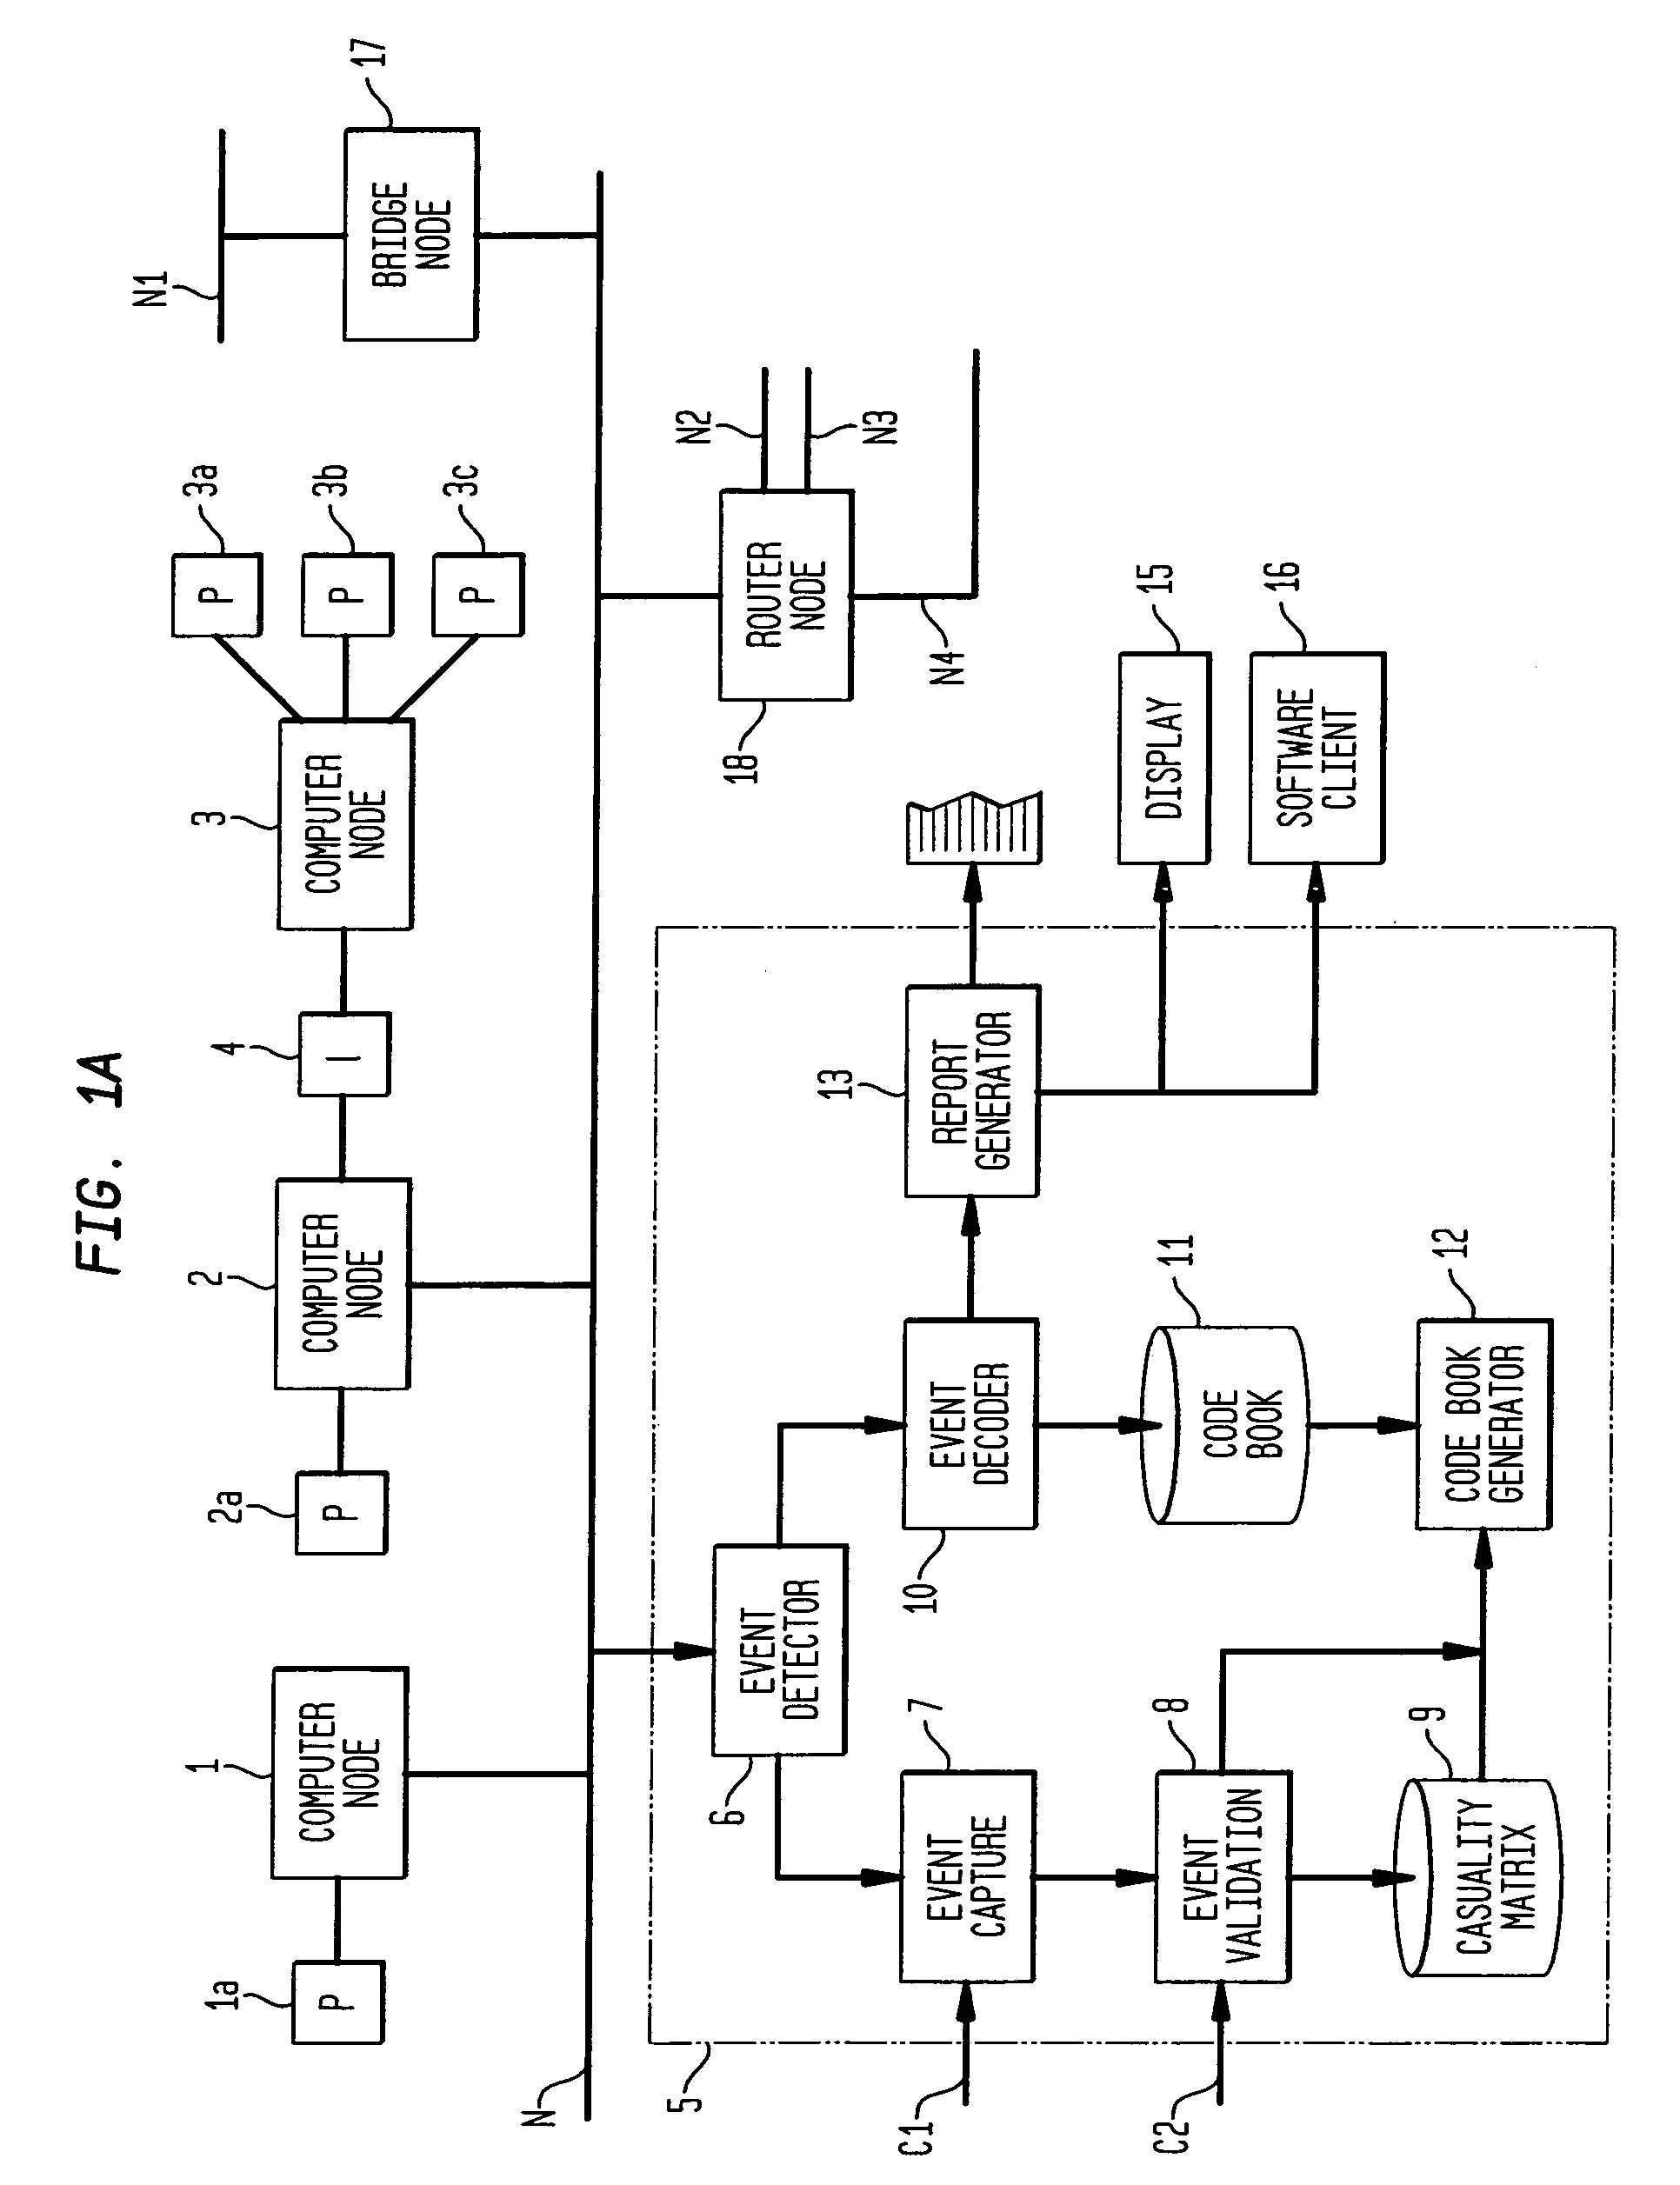
[0078]FIG. 1A shows a networked computer system connected to apparatus 5 in accordance with the principles of the present invention. Three computer nodes 1, 2, and 3 are shown connected to a computer network N. The network N is interconnected with other networks (N1, N2, N3, N4) via communication nodes, a bridge node 17 and a router node 18. The phrase “network of computer nodes” as used herein and in the claims will be understood to refer to both a network which only includes computer nodes and to a network which further includes communication nodes. Each computer node may also be connected to peripherals such as 1a, 2a, and 3a–3c. Moreover, two or more computer nodes may be connected via an interface 4. Each computer node may generate one or more signals on network N, or through other means, corresponding to symptoms in the system. Examples of symptoms for which signals may be generated could include power failure, peripheral failure, temperature limit exceeded, network interface ...


PUM


Abstract

A computer implemented method on a computer readable media is provided for determining the source of a problem in a complex system of managed components based upon symptoms. The problem source identification process is split into different activities. Explicit configuration non-specific representations of types of managed components, their problems, symptoms and the relations along which the problems or symptoms propagate are created that can be manipulated by executable computer code. A data structure is produced for determining the source of a problem by combining one or more of the representations based on information of specific instances of managed components in the system. Computer code is then executed which uses the data structure to determine the source of the problem from one or more symptoms.

Description

CLAIM OF PRIORITY[0001]This application is a continuation of and claims the benefit of the earlier filing date of U.S. patent application Ser. No. 11 / 034,192, entitled “Apparatus and Method for Event Correlation and Problem Reporting,” filed on Jan. 12, 2005, now U.S. Pat. No. 7,003,433, which is a continuation of U.S. patent application Ser. No. 10 / 400,718, entitled “Apparatus and Method for Event Correlation and Problem Reporting,” filed on Mar. 27, 2003, now U.S. Pat. No. 6,868,367, which is a continuation of U.S. patent application Ser. No. 09 / 809,769 filed on Mar. 16, 2001, now abandoned, which is a continuation of U.S. patent application Ser. No. 08 / 893,263, now U.S. Pat. No. 6,249,755, filed on Jul. 15, 1997, which is a continuation of U.S. patent application Ser. No. 08 / 679,443, now U.S. Pat. No. 5,661,668, filed on Jul. 12, 1996, which is a continuation of U.S. patent application Ser. No. 08 / 465,754, filed on Jun. 6, 1995, now abandoned, which is a continuation of U.S. pate...

Claims


Application Information

Patent Timeline
Patent Type & Authority Patents(United States)
IPC IPC(8): G06F17/00
CPCG06F11/2257
Inventor YEMINI, YECHIAMYEMINI, SHAULA ALEXANDERKLIGER, SHMUEL
Owner VMWARE INC
Why Eureka
Try Eureka