Method for measuring theoretical life of mechanical product
A technology for mechanical products and lifespan, applied in electrical digital data processing, special data processing applications, instruments, etc., can solve problems such as the inability to accurately obtain the optimal confidence interval for the reliability of mechanical products
- Summary
- Abstract
- Description
- Claims
- Application Information
AI Technical Summary
Problems solved by technology
Method used
Image
Examples
Embodiment 1
[0185] Embodiment 1 Evaluation of Rolling Bearing Performance Life
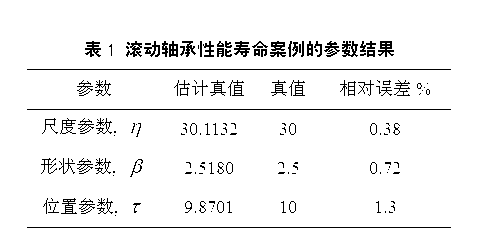
[0186] According to the characteristics of the parameters of the friction and wear life of a rolling bearing, the Weibull parameter is set =(30, 2.5, 10), use the inverse function method to simulate the performance failure data of n=9 bearing units (unit: 24h):
[0187] T=(22.1953, 26.4647, 29.8623, 32.9314, 35.9090, 38.9691, 42.3123, 46.2903, 51.8801)
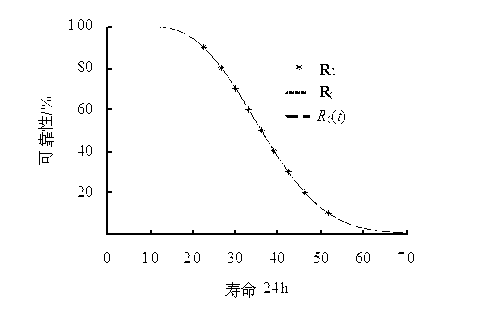
[0188] The simulated 9 failure data are processed by the self-service weighted norm method, and the parameters are calculated The estimated true value of , and then compare the relative error between the true value of the parameter estimate and the true value of the parameter, and compare the reliability estimate of the true value function R 0 (t) and the theoretical value of reliability R 0 and reliability expectation empirical value R 1 consistency between.
[0189] Using norm criterion 1~6, take B=80000, see the result figure 1 with figure 2 . ...
Embodiment 2
[0191] Example 2 Failure Case of Helicopter Components
[0192] The failure data (n=13, unit: h) of a helicopter part 206-011-147-005 is:
[0193] T=(156.5, 213.4, 265.7, 265.7, 337.7, 337.7, 406.3, 573.5, 573.5, 644.6, 744.8, 774.8, 1023.6)
[0194] Adopt norm criteria 1~6, take B=80000, confidence level P=99.999%, use self-service weighted norm method to process failure data, and estimate the true value of parameters and its confidence interval ( , , ) results see Figure 4 , the reliability estimation truth function R 0 (t) and its optimal confidence interval function [R L (t), R U (t)] for results see Figure 5 . For the convenience of comparative analysis, Figure 5 Also shown in the reliability median rank empirical value R 1 .
[0195] Depend on Figure 5 It can be seen that one of the data exceeds the reliability optimal confidence interval function [R L (t), R U (t)], the coverage rate is 12 / 13=92.3%, this percentage is less than the confidence leve...
Embodiment 3
[0196] Example 3 Fatigue life case of a test piece
[0197] The fatigue life data of a group of specimens were measured under the same stress level (n=20, unit: kC):
[0198] T=(350, 380, 400, 430, 450, 470, 480, 500, 520, 540, 550, 570, 600, 610, 6 30, 650, 670, 730, 770, 840)
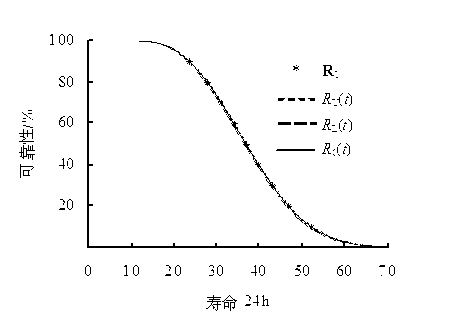
[0199] Using norm criterion 1 and 4~6, taking B=80000, confidence level P=90%, the results obtained by self-help weighted norm method are shown in Image 6 with Figure 7 . For the convenience of comparative analysis, Figure 7 Also shown in the existing method (probability weighted moment method) reliability estimation true value result R and reliability expectation empirical value R 1 .
[0200] Depend on Figure 7 It can be seen that the reliability estimation truth function R of the bootstrap weighted norm method 0 (t) with existing methods to estimate the truth function R against the reliability expectation empirical value R 1 The consistency is very good. Moreover, the 20 reliability ex...
PUM
 Abstract
Description
Claims
Application Information
 - R&D
- Intellectual Property
- Life Sciences
- Materials
- Tech Scout
- Unparalleled Data Quality
- Higher Quality Content
- 60% Fewer Hallucinations
Browse by: Latest US Patents, China's latest patents, Technical Efficacy Thesaurus, Application Domain, Technology Topic, Popular Technical Reports.
© 2025 PatSnap. All rights reserved.Legal|Privacy policy|Modern Slavery Act Transparency Statement|Sitemap|About US| Contact US: help@patsnap.com


