Automatic experiment and analysis device for gas-liquid equilibrium phase diagram of binary liquid solution

A technology for balancing phase diagrams and analysis devices, applied in the investigation stage/state change, etc., can solve problems such as low operating efficiency, low efficiency, and existing safety, and achieve the effects of convenient experimental process, improved experimental efficiency, and improved accuracy

Active Publication Date: 2014-02-26
CHUZHOU SEEK ELECTRONICS
View PDF3 Cites 4 Cited by
  • Summary
  • Abstract
  • Description
  • Claims
  • Application Information

AI Technical Summary

Problems solved by technology

[0003] The above operations are basically completed by manual experimental operation and measurement. The problem is that repeated operations are inefficient and error-prone; temperature control uses a voltage regulator to manually adjust the voltage of the heating wire to control the temperature. This voltage regulator controls the temperature Method, because the heating 220V phase line is not completely isolated, there are potential safety hazards, and the temperature control adopts an open-loop control method with low control accuracy; data collection and analysis are done manually, the operation cycle is long, and the efficiency is low. Problems need to be dealt with afterwards. It cannot collect, process, analyze and display in real time, and the whole experimental process is far behind modern experimental methods and measurement technologies

Method used


Image

  • Automatic experiment and analysis device for gas-liquid equilibrium phase diagram of binary liquid solution
  • Automatic experiment and analysis device for gas-liquid equilibrium phase diagram of binary liquid solution
  • Automatic experiment and analysis device for gas-liquid equilibrium phase diagram of binary liquid solution

Examples


Embodiment Construction

[0030] The present invention will be described in detail below in conjunction with the accompanying drawings.

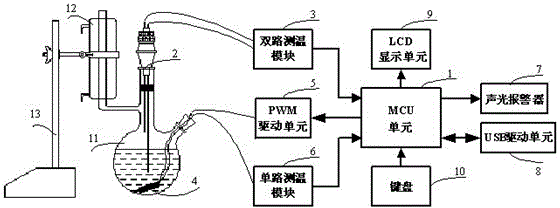
[0031] Such as figure 1As shown, the automatic experiment and analysis device of the gas-liquid equilibrium phase diagram of the binary liquid solution of the present invention includes: MCU unit 1, dual-channel RTD assembly 2, dual-channel temperature measurement module 3, heating rod assembly 4, PWM drive unit 5, Single-channel temperature measurement module 6, sound and light alarm 7, USB drive unit 8, LCD display 9, keyboard 10, flask 11, fractionation device 12, fixed bracket 13. MCU unit 1 has PWM output, SPI communication, USB drive unit and related components, and has data power-down protection function. Among them, the PWM output is a process of dynamic adjustment of the duty cycle, and the SPI communication can continuously measure multiple RTD signals. The flask 11 is used to store the solution, and the fractionating device 12 is used to provide sampling...


PUM


Abstract

The invention discloses an automatic experiment and analysis device for a gas-liquid equilibrium phase diagram of a binary liquid solution. The automatic experiment and analysis device comprises a fixed bracket, a flask, a heating device, a fractionating device, a temperature measurement device, a micro control unit and a PWM (pulse width modulation) driving unit, wherein a heating stick assembly is adopted as the heating device; one end of the heating stick assembly extends into the flask, and the other end of the heating stick assembly is connected with the micro control unit through the PWM driving unit; the temperature measurement device comprises a double-path RTD (resistance temperature detector) assembly and a double-path temperature measurement module; one end of the double-path RTD assembly extends into the flask, and the other end of the double-path RTD assembly is connected with the micro control unit through the double-path temperature measurement module; an RTD sensor in the double-path RTD assembly extends into the binary liquid solution, and another RTD sensor is positioned above the binary liquid solution. The automatic experiment and analysis device for the gas-liquid equilibrium phase diagram, which is disclosed by the invention, can automatically measure and control the temperature and judge a gas-liquid equilibrium state accurately and sequentially and also finish experiment operations such as data acquisition, data analysis and data displaying; therefore, the precision of temperature control is improved, and the operation is easy.

Description

technical field [0001] The invention relates to an automatic experiment and analysis device for the gas-liquid equilibrium phase diagram of a binary liquid solution. Background technique [0002] The gas-liquid equilibrium phase diagram experiment of binary liquid solution is a given experiment in the university chemistry syllabus, which involves a wide range of schools and majors. The existing experimental operation method has been used for decades, and the experimental process is basically completed by manual operation. The experimental method is to distill two mixtures of a certain composition in a special still. When the temperature remains constant, it means that the gas and liquid phases have reached equilibrium. Use the traditional mercury scale temperature to record the boiling point temperature, and measure the composition of the gas phase (condensate) and liquid phase at the boiling point. T - x - y The data are plotted in the graph, and the liquid phase po...

Claims


Application Information

Patent Timeline
Patent Type & Authority Applications(China)
IPC IPC(8): G01N25/02
Inventor 江国栋张晓阳赵骥
Owner CHUZHOU SEEK ELECTRONICS
Why Eureka
Try Eureka