
An Accurate Measurement Method of Signal-to-Noise Ratio of Fiber Optic Spectrometer

A fiber optic spectrometer and precise measurement technology, which is applied in spectrum investigation and other directions, can solve the problems of inability to measure the signal-to-noise ratio accurately, unfavorable optical system signal-to-noise ratio results, etc.

Inactive Publication Date: 2016-02-03
THE 41ST INST OF CHINA ELECTRONICS TECH GRP
View PDF3 Cites 2 Cited by
  • Summary
  • Abstract
  • Description
  • Claims
  • Application Information

AI Technical Summary

Problems solved by technology

[0005] Shortcomings of the prior art: 1. The prior art measures under a fixed light intensity, and cannot accurately measure the signal-to-noise ratio under different input light intensities; 2. The prior art uses an integrating sphere as The incident light source and the ambient background light will become stray light and enter the spectrometer, which is not conducive to the accurate measurement of the signal-to-noise ratio of the optical system; 3. In addition to the exposure pixels of the array photodetector, there are some non-exposure pixels on its edge. The existing technology The non-exposed pixel signal is not effectively utilized as a dark response to measure the signal-to-noise ratio

Method used


Image

  • An Accurate Measurement Method of Signal-to-Noise Ratio of Fiber Optic Spectrometer
  • An Accurate Measurement Method of Signal-to-Noise Ratio of Fiber Optic Spectrometer
  • An Accurate Measurement Method of Signal-to-Noise Ratio of Fiber Optic Spectrometer

Examples


Embodiment 1

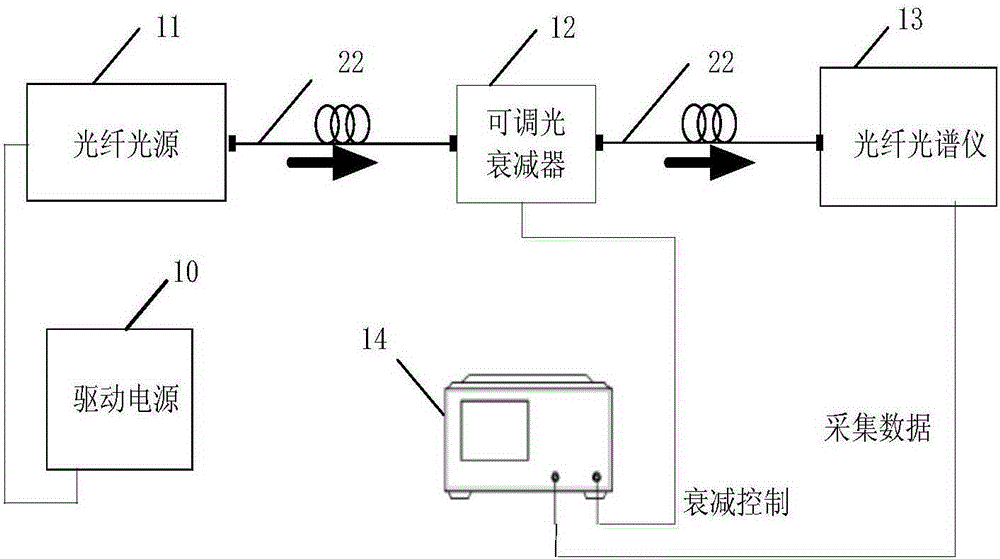
[0033] The invention proposes a method for measuring the signal-to-noise ratio of a fiber optic spectrometer, which is mainly composed of a driving power supply, an optical fiber light source, an adjustable optical attenuator, a connecting optical fiber, and a main control computer. (1) The driving power supply is used to control the optical fiber light source to generate stable The output of the optical fiber light source needs to meet the working mode and stability requirements of the optical fiber light source; (2) The optical signal generated by the optical fiber light source can be in any band of ultraviolet, visible light, and near-infrared. 3) The adjustable optical attenuator receives the optical signal from the optical fiber light source through the connecting optical fiber. Its working wavelength and the interface standard of the connecting optical fiber should match the optical fiber light source. The adjustable optical attenuator needs to be fine-tuned under the cont...

Embodiment 2

[0052] On the basis of the above examples, if figure 1 Shown, a kind of accurate measurement method of optical fiber spectrometer signal-to-noise ratio, wherein, comprises the following steps:

[0053] Step 101: Connect the driving power to the fiber optic light source, then connect the fiber optic light source to the adjustable optical attenuator through the connecting fiber, connect the adjustable optical attenuator to the fiber optic spectrometer through the connecting fiber, and at the same time, the adjustable optical attenuator and the fiber optic spectrometer are respectively Connect with the master computer;

[0054] Step 102: The adjustable optical attenuator receives the optical signal from the optical fiber light source through the connected optical fiber, and its working wavelength and interface standard with the optical fiber should match the optical fiber light source. Finely adjust the light intensity of the incident light under control, and then transmit the o...


PUM


Abstract

The invention provides an accurate measurement method for the signal-to-noise ratio of a fiber optic spectrometer. The method includes the following steps that first, related devices are connected; second, measurement on the signal-to-noise ratio of the fiber optic spectrometer under different light intensities is achieved; third, the specific value between a correction average value mu of a signal corresponding to the ith exposure pixel of an array photoelectric detector and a jittering value sigma of a signal deflection average value is calculated through N times of signal acquisition and measurement. By the adoption of the scheme, the method can adapt to the measurement requirement of the signal-to-noise ratio of the fiber optic spectrometer, not only can influences of stray light be decreased or reduced, but also the intensity of incident light of the fiber optic spectrometer can be conveniently and fast changed through a variable optical attenuator, and accurate measurement on the signal-to-noise ratio of the fiber optic spectrometer under different light intensities is achieved.

Description

technical field [0001] The invention belongs to the technical field of accurate measurement of the signal-to-noise ratio of an optical fiber spectrometer, and in particular relates to an accurate measurement method for the signal-to-noise ratio of an optical fiber spectrometer. Background technique [0002] The use of array optoelectronic devices as detection devices has been widely used in miniaturized fiber optic spectroscopic instruments for spectral analysis of signals from ultraviolet to near-infrared bands (190nm-1100nm). Optical signal-to-noise ratio, as the main criterion for distinguishing signal and noise, is an important technical index reflecting this type of spectroscopic instrument, reflecting the characteristics of the evaluation instrument such as weak light response and detection tolerance. In the prior art, only theoretical research and experiments on the signal-to-noise ratio of Fourier transform spectrometers and imaging spectrometers have been described....

Claims


Application Information

Patent Timeline
Patent Type & Authority Patents(China)
IPC IPC(8): G01J3/28
Inventor 聂建华吴威鞠军委
Owner THE 41ST INST OF CHINA ELECTRONICS TECH GRP
Learn More