Gyroscope fault diagnosis method based on K-S (Kolmogorov-Smirnov) distribution check and HHT (Hilbert-Huang Transform)
A technology of fault diagnosis and inspection method, which is applied in the direction of instruments, special data processing applications, measuring devices, etc., can solve the problem of low accuracy of fault diagnosis, achieve good fault diagnosis and simplify the detection process
- Summary
- Abstract
- Description
- Claims
- Application Information
AI Technical Summary
Problems solved by technology
Method used
Image
Examples
specific Embodiment approach 1
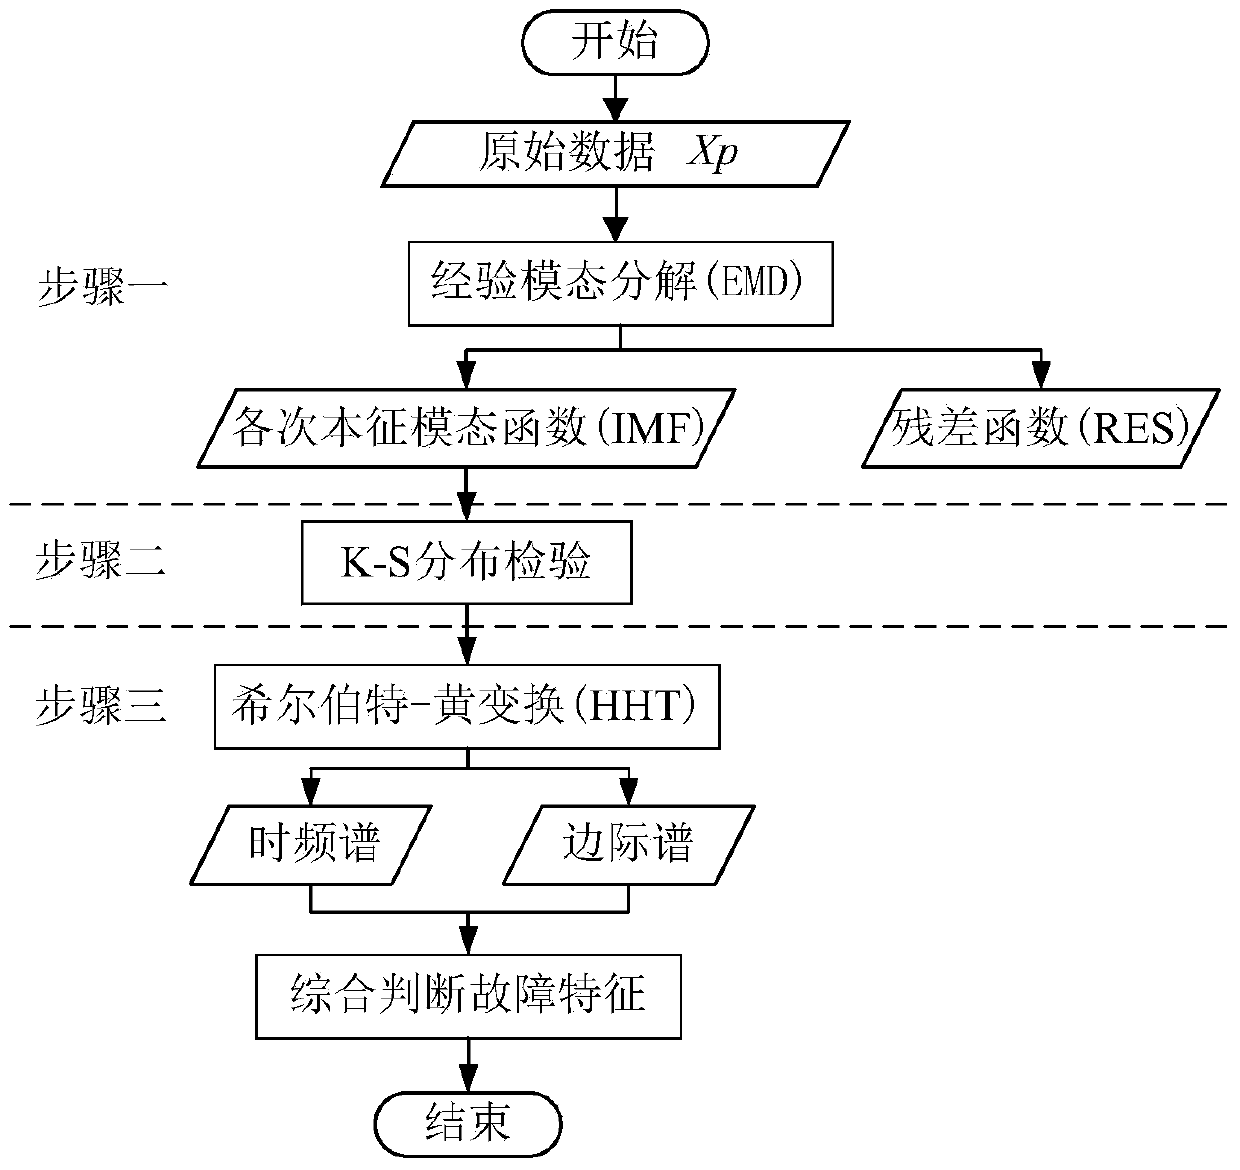
[0028] Specific embodiment one: the gyroscope fault diagnosis method based on K-S distribution test and HHT of the present embodiment is realized according to the following steps:
[0029] Step 1: Decompose the original gyro angular velocity output signal Xp using the EMD method to obtain IMF components in different frequency bands;
[0030] Step 2: Utilize the K-S distribution test method to carry out correlation test to the IMF component of different frequency bands obtained in step 1, judge whether the IMF component of different frequency bands is the effective component of original gyroscope angular velocity output signal;
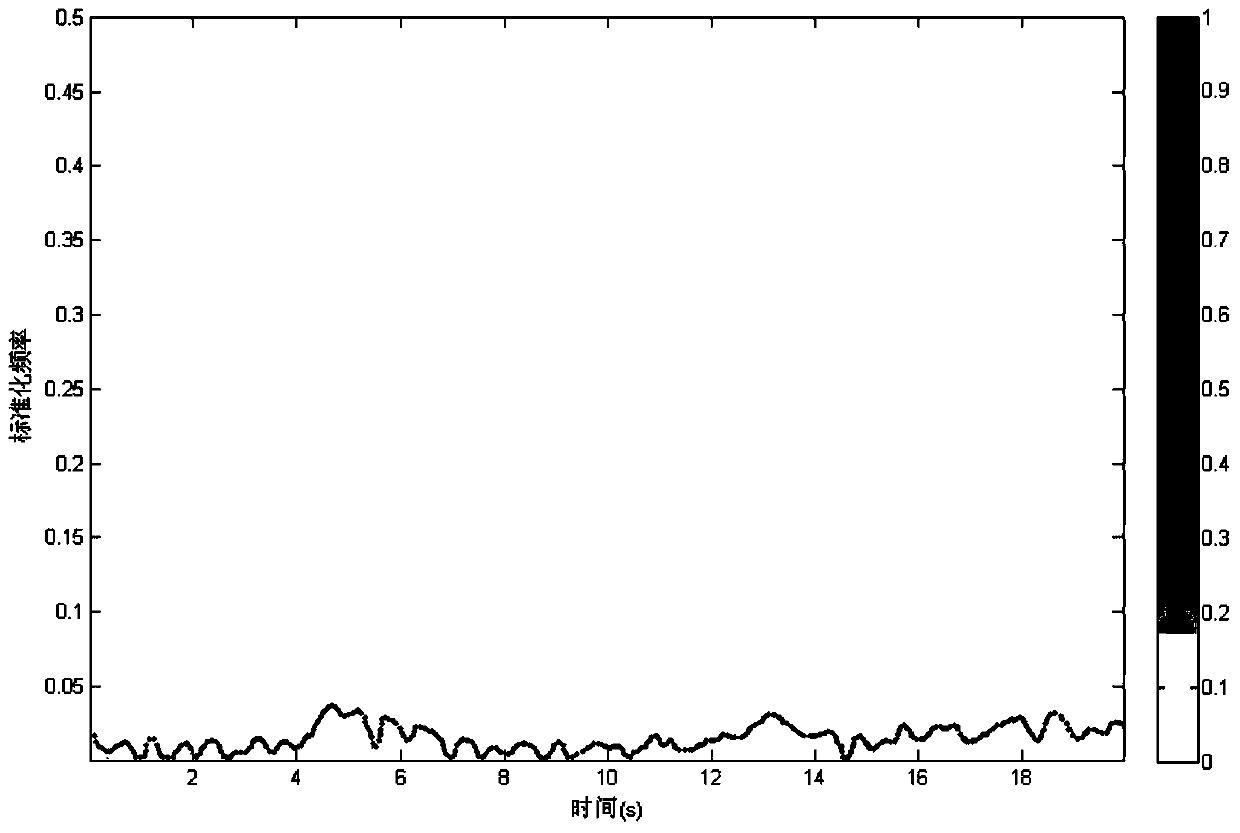
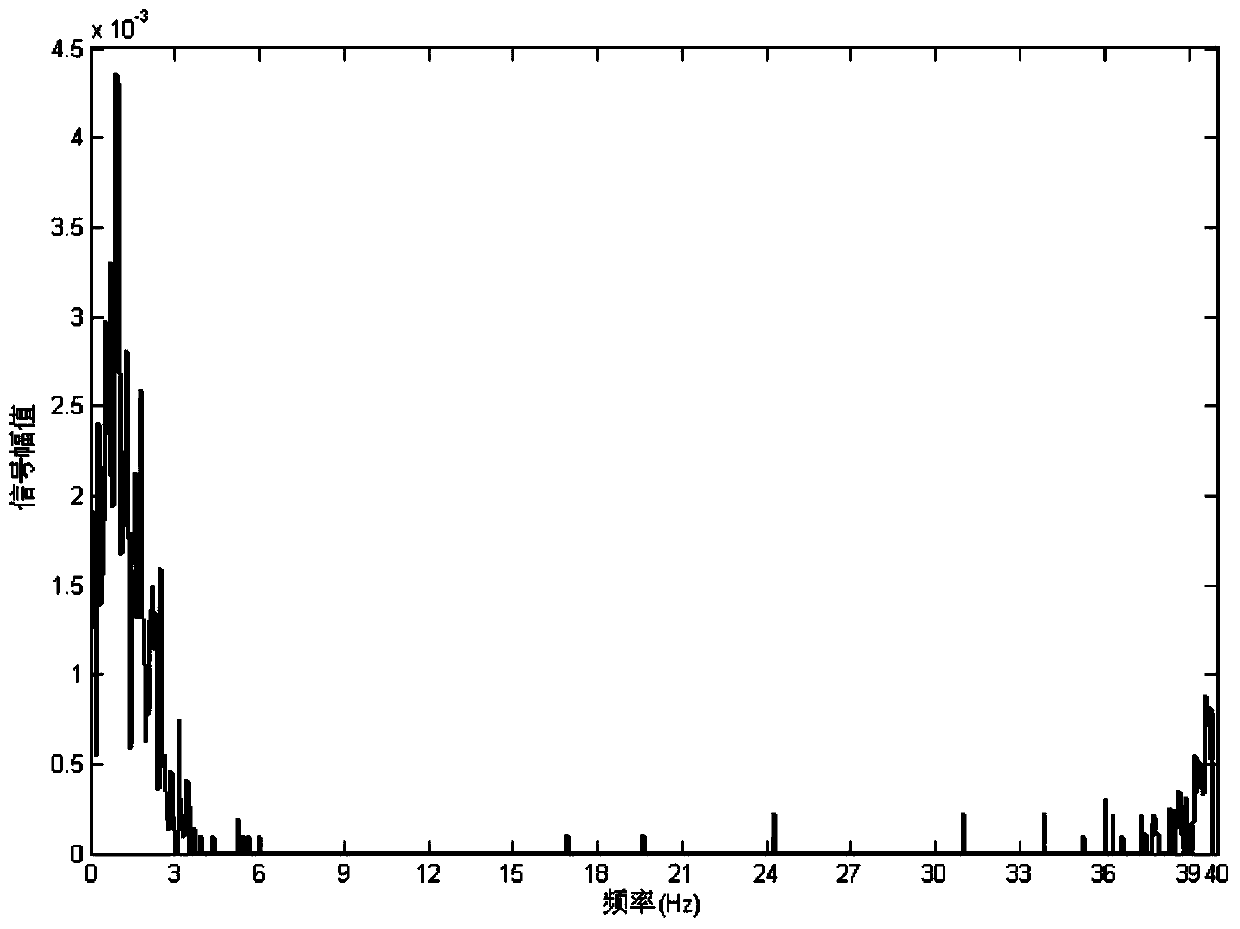
[0031] Step 3: Perform HHT transformation on the IMF component tested by the K-S method in step 2, and then obtain the time spectrum and marginal spectrum of the IMF component, and combine the energy and frequency changes of the signal on the time spectrum and the signal frequency distribution judgment system on the marginal spectrum Whether there is a...
specific Embodiment approach 2
[0037] Specific embodiment two: the difference between this embodiment and specific embodiment one is: the original gyro angular velocity output signal Xp is decomposed by the EMD method in the step one, and the different frequency band IMF components obtained are specifically:
[0038] (1) Use the matlab extremum function to find out all local extremum points on the time series of the original gyro angular velocity output signal Xp;
[0039] (2) The upper envelope function and the lower envelope function of Xp are generated by constructing the maximum value and the minimum value respectively, denoted as e max (t) and e min (t);
[0040] (3) Generate the mean function of the upper and lower envelope functions of Xp: get the mean function m of the upper and lower envelope functions of Xp based on formula (1) 1 (t);
[0041] m 1 ( t ) = e ...
specific Embodiment approach 3
[0058] Specific embodiment three: what this embodiment is different from specific embodiment one or two is: the IMF component of the different frequency bands that obtains in described step 2 utilizes the K-S distribution test method to carry out correlation test, and judges whether the IMF component of different frequency bands is The effective components of the raw gyro angular velocity output signal:
[0059] (1) K-S distribution test:
[0060] For N-point time series y(n)={y 1 ,y 2 ,...,y n}, define its cumulative distribution function:
[0061] E i = n ( i ) N - - - ( 6 )
[0062] Among them, n(i) is the number of samples whose data value is less than y(i) in the sample population obtained by first sorting the data samples ...
PUM
 Abstract
Description
Claims
Application Information
 - R&D
- Intellectual Property
- Life Sciences
- Materials
- Tech Scout
- Unparalleled Data Quality
- Higher Quality Content
- 60% Fewer Hallucinations
Browse by: Latest US Patents, China's latest patents, Technical Efficacy Thesaurus, Application Domain, Technology Topic, Popular Technical Reports.
© 2025 PatSnap. All rights reserved.Legal|Privacy policy|Modern Slavery Act Transparency Statement|Sitemap|About US| Contact US: help@patsnap.com


