Flow cytometry data fast analysis method

A flow cytometer and rapid analysis technology, applied in the field of fast clustering algorithm of flow cytometer data, can solve the problems of loss of biological information, long calculation time, large sample size, etc. low effect

Active Publication Date: 2014-12-10
SANITARY EQUIP INST ACAD OF MILITARY MEDICAL SCI PLA
View PDF5 Cites 15 Cited by
  • Summary
  • Abstract
  • Description
  • Claims
  • Application Information

AI Technical Summary

Problems solved by technology

Aiming at this problem, a pre-sampling spectral clustering algorithm is currently proposed. This method solves the problem of long calculation time caused by large sample size. However, due to the pre-processing of the data, some biological information contained in the data may be processed. lost in process

Method used


Image

  • Flow cytometry data fast analysis method
  • Flow cytometry data fast analysis method
  • Flow cytometry data fast analysis method

Examples


Embodiment Construction

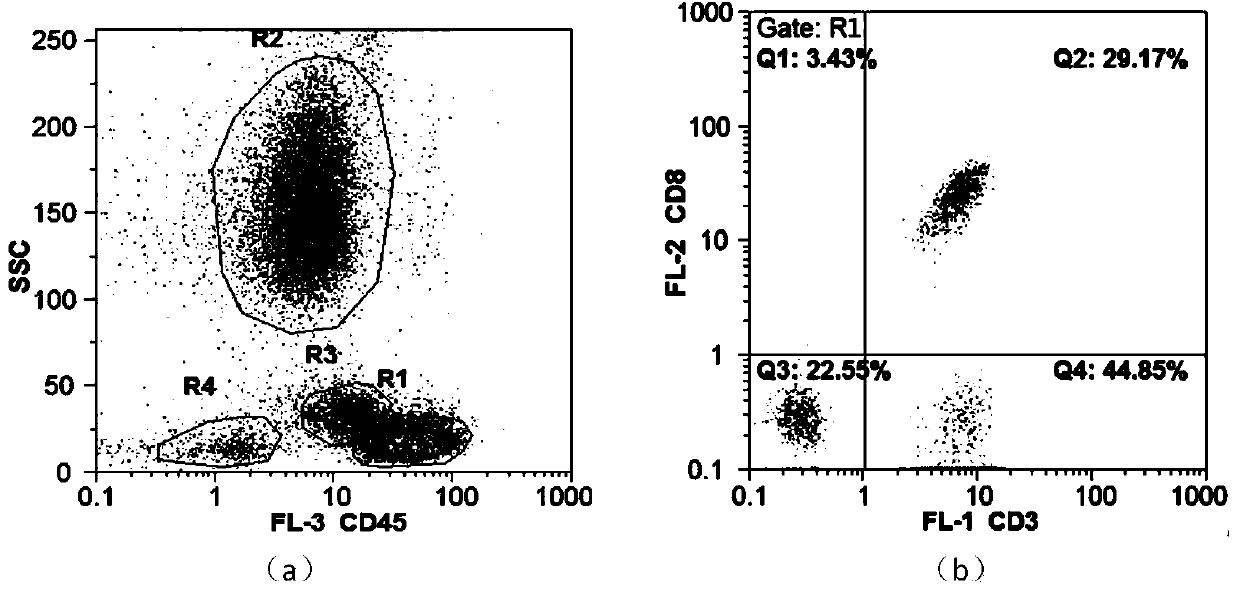
[0038] Such as figure 1 It is the projection of the experimental data in the dimension of SSC and CD45. The data comes from a patient's peripheral blood sample, which contains 29320 cells and 3 kinds of marker molecules, namely CD3, CD8 and CD45. The purpose of the experiment is to find the subset of CD8+ T lymphocytes. Group and its number of particles. The method of manually analyzing the data is to first identify the lymphocyte subsets through the scatter diagram composed of CD45 and SSC, and then analyze the CD3 and CD8 dimensional projection analysis of the corresponding lymphocyte subset data to find the CD8 + T lymphocytes. Such as figure 1 a is the result of experts using FloMax software to search for lymphocyte subsets by CD45 and SSC. According to the results, the sample contains four cell subsets, and the R1-R4 regions represent lymphocyte subsets, monocytes, and monocytes, respectively. Cell subpopulations, granulocyte subpopulations, and dead cells. figure 1 b...


PUM


Abstract

The invention discloses a flow cytometry data fast analysis method. The flow cytometry data fast analysis method comprises the steps of estimating the number of class groups in flow cytometry data through the nuclear density estimation method to obtain the range of the number of the class groups contained in the data; after the number of the class groups is obtained, automatically clustering the data through the K-means method of an optimized initial clustering center; merging the clustered results through the two-stage linear regression fitting method and screening out the optimal result. According to the flow cytometry data fast analysis method, the result accuracy is high, and the analysis time is much shorter than the time of manual data analysis and other present analysis methods.

Description

technical field [0001] The invention relates to an automatic analysis technology of flow cytometer data, in particular to a fast clustering algorithm of flow cytometer data. Background technique [0002] Flow cytometry is a technique that can accurately and quickly perform multi-parameter quantitative analysis of the physicochemical and biological properties of biological cells and sort specific cell groups. The principle is to excite the hydrodynamically focused cells one by one with a micron-scale laser beam, collect and record the multi-angle scattered light and multi-wavelength labeled fluorescent signals induced by each cell, and analyze the data of the cell population through multiple optical channels The cluster analysis of the method realizes the high-precision quantitative detection of samples. Typically, the scattered light and fluorescence signals induced by a single cell are recorded as individual events, all of which are aggregated into a complete flow cytometr...

Claims


Application Information

Patent Timeline
Patent Type & Authority Applications(China)
IPC IPC(8): G06F19/00G01N15/10
Inventor 王先文程智陈锋杜耀华暴洪涛李辰宇吴太虎
Owner SANITARY EQUIP INST ACAD OF MILITARY MEDICAL SCI PLA
Why Eureka
Try Eureka