Coherent mixing based in-band optical signal to noise ratio monitoring method and calculation system
What is AI technical title?
AI technical title is built by Patsnap AI team. It summarizes the technical point description of the patent document.
A technology of optical signal-to-noise ratio and frequency mixing, applied in the field of communication, can solve problems such as high cost and inaccuracy
Active Publication Date: 2015-02-18
HUAZHONG UNIV OF SCI & TECH
View PDF5 Cites 7 Cited by
Summary
Abstract
Description
Claims
Application Information
AI Technical Summary
This helps you quickly interpret patents by identifying the three key elements:
Problems solved by technology
Method used
Benefits of technology
Problems solved by technology
[0004] The present invention provides an in-band optical signal-to-noise ratio monitoring method and calculation system based on coherent frequency mixing to solve the technical problems in the prior art that are either not accurate enough or costly when measuring OSNR for high-speed signals
Method used
Image
Click on the blue label to locate the original text in one second.
Reading with bidirectional positioning of images and text.
Examples
Embodiment 1
[0143] In this embodiment, the CO-OFDM system will be used as an example to introduce the optical signal-to-noise ratio calculation system, please refer to Figure 5 , the CO-OFDM system includes the following structure:
[0147] An attenuator 53, connected to the ASE noise source 52, for adjusting the size of the ASE noise;
[0148] 50:50 coupler 54, connected to IQ modulator 51 and attenuator 53;
[0149] The 10:90 coupler 55 is connected to the 50:50 coupler 54, wherein the 50:50 coupler 54 and the 10:90 coupler 55 are used to couple the ASE noise with the optical signal, so that the OSNR can be changed;
[0150] The tunable bandpass ...
Embodiment 2
[0158] In this embodiment, the calculation results for the CO-OFDM system will be introduced. The system transmits 16QAM signals of 40Gb / s. The obtained OSNR monitoring results are as follows Figure 6 shown, where Figure 6 The vertical axis of represents the calculated value of OSNR determined by the formula [3], Figure 6 The horizontal axis of represents the standard value of OSNR measured by spectrometer 57, from Figure 6 It can be seen that the calculated value of OSNR is not much different from the standard value, which shows that the accuracy is high.
[0159] Also, please refer to Figure 7 , Figure 7 The ordinate represents the error of the calculated value of OSNR relative to the standard value, and the abscissa represents the standard value of OSNR, by Figure 7It can be seen that when the OSNR changes within the range of 10-25dB, the error of the calculated value is within 0.5dB.
[0160] One or more embodiments of the present invention have at least the fo...
PUM
Abstract
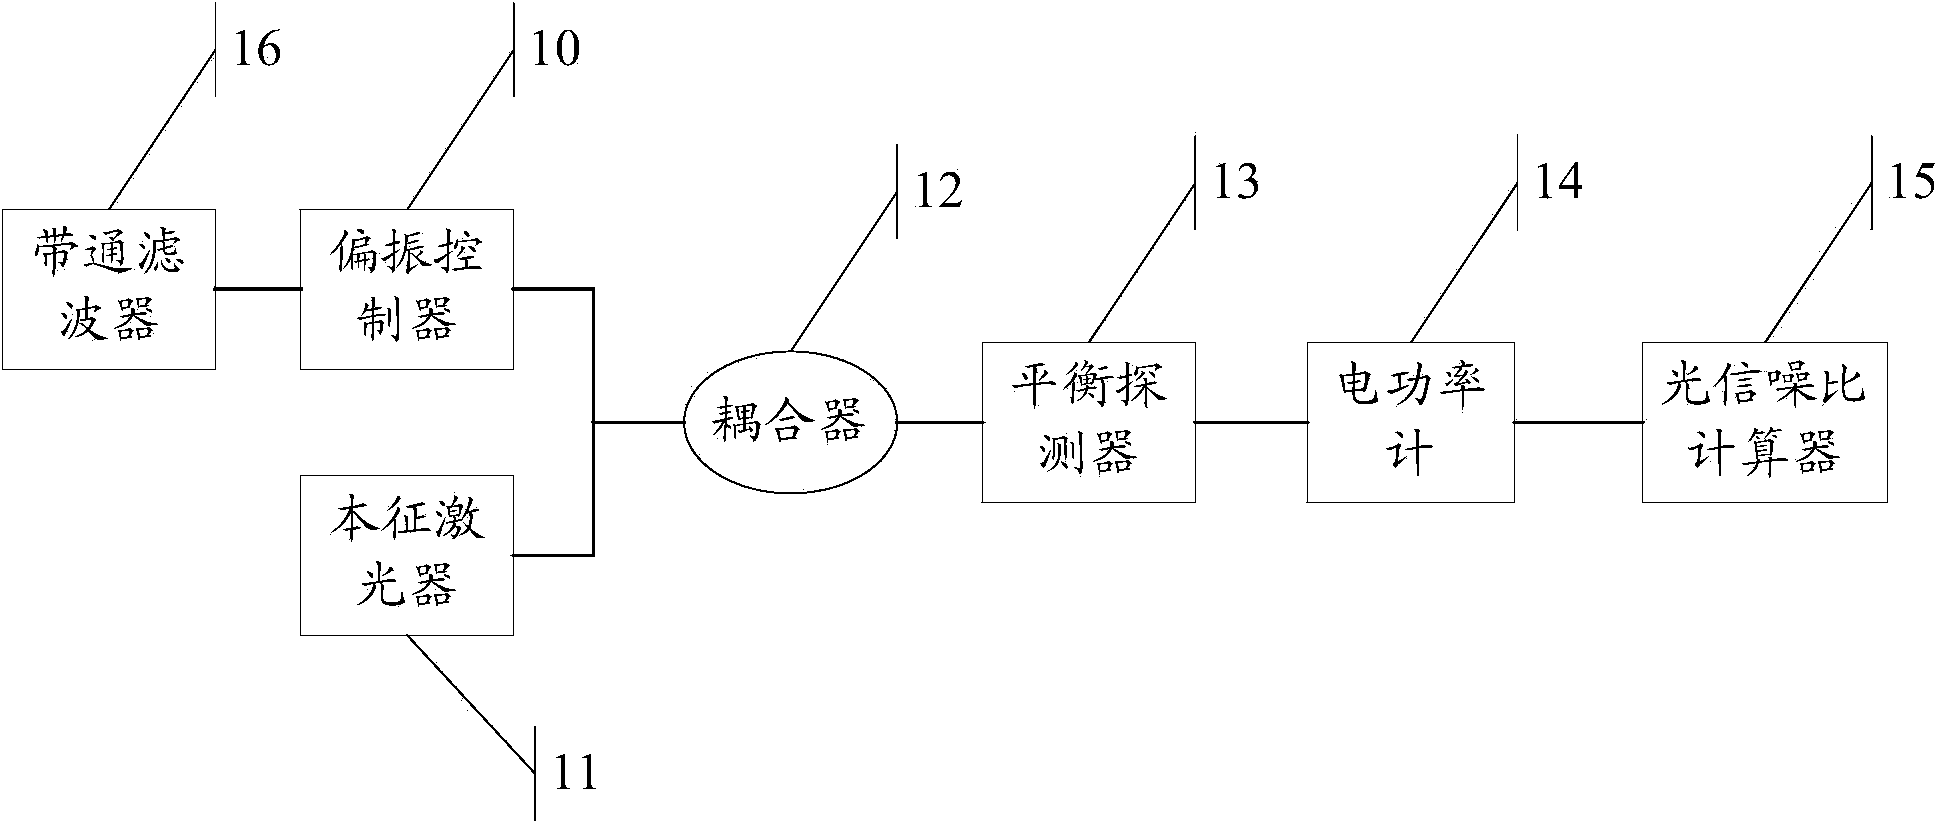
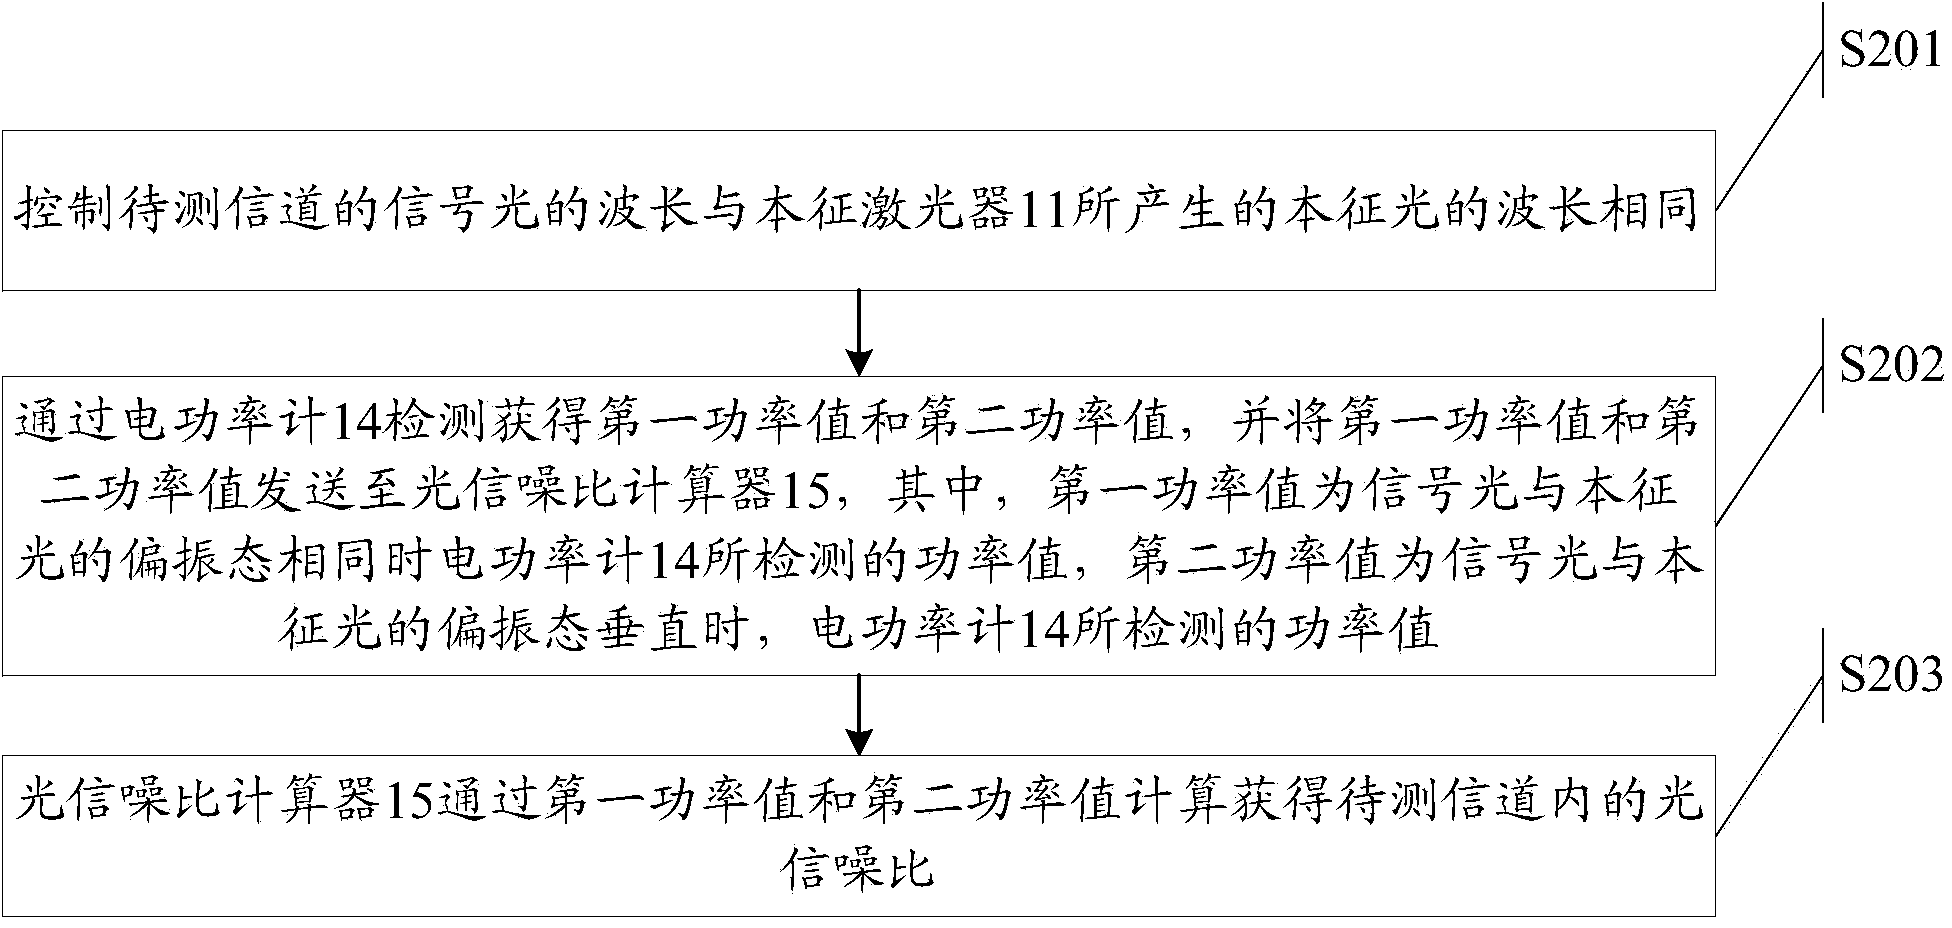
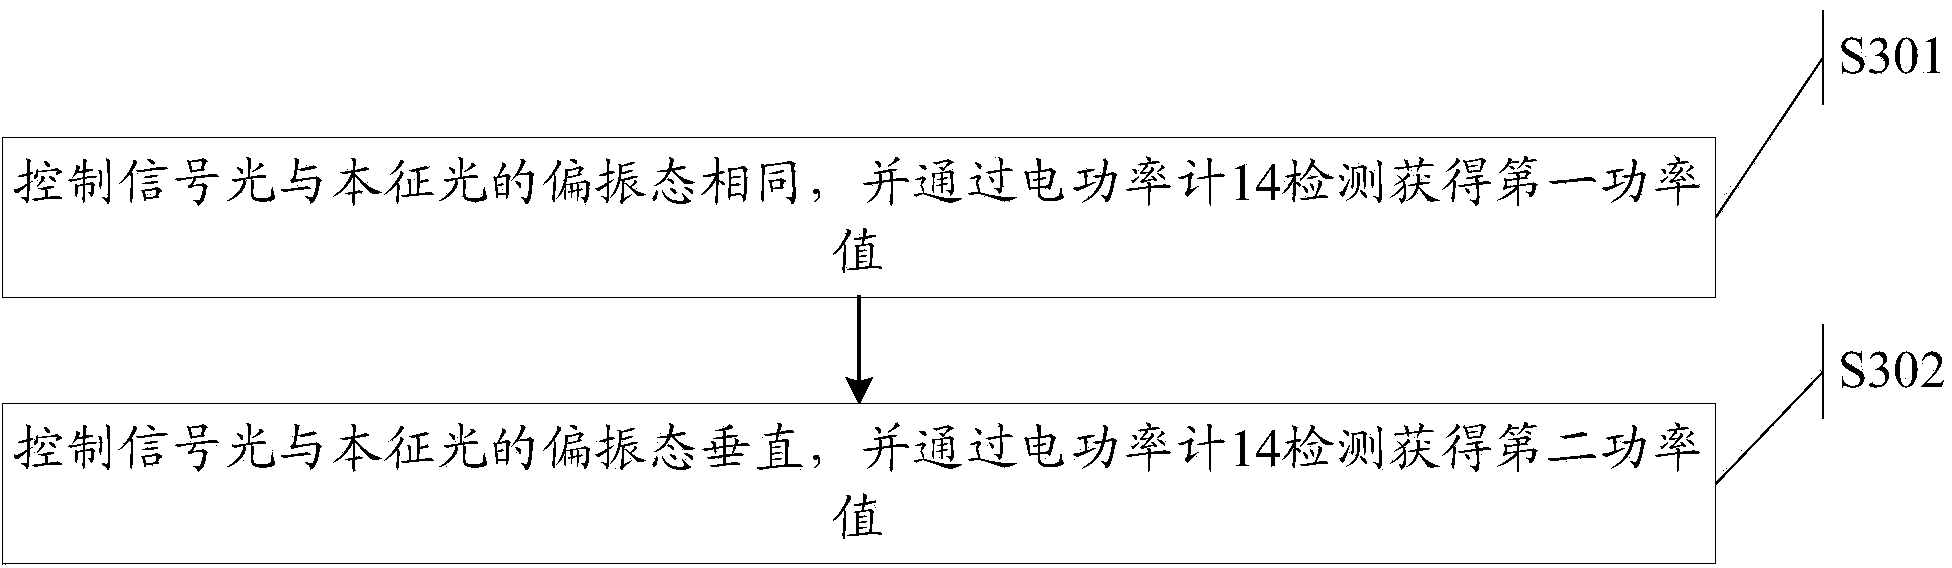
The invention relates to the field of communication, and discloses a coherent mixing based in-band optical signal to noise ratio monitoring method and an optical signal to noise ratio calculation system. The method is applied to the optical signal to noise ratio calculation system which comprises a polarization controller, an intrinsic laser, a coupler, a balanced detector, an electrodynamic meter and an optical signal to noise ratio calculator, and the input end of the polarization controller receives signal light. The method includes that wavelength of a to-be-tested channel is controlled to be identical to that of intrinsic light generated by the intrinsic laser; a first power value and a second power value are obtained by detection of the electrodynamic meter and are sent to the optical signal to noise ratio calculator, wherein the first power value is a power value detected by the electrodynamic meter when the signal light is equal to the intrinsic light in polarization state, and the second power value is a power value detected by the electrodynamic meter when the polarization state of the signal light is perpendicular to the polarization state of the intrinsic light; the optical signal to noise ratiocalculator acquires an optical signal to noise ratio in the to-be-tested channel by calculating through the first power value and the second power value.
Description
technical field [0001] The invention relates to the communication field, in particular to an in-band optical signal-to-noise ratio monitoring method and calculation system based on coherent frequency mixing. Background technique [0002] As people's requirements for bandwidth are getting higher and higher, the single-channel rate of the optical communicationbackbone network is evolving from 40Gb / s to 100Gb / s and above, and the wavelength interval of the WDM (Wavelength Division Multiplexing) system is also changing from 50GHz to 100Gb / s. 25GHz and even 12.5GHz evolution. When the wavelength interval is very small, the traditional linear interpolation method has been unable to measure the noise power between channels, and it is also unable to fit the noise power within the band. And with the introduction of optical add-drop multiplexer (ROADM: optical add-drop multiplexer), the signals of different channels will pass through different links, which is equivalent to passing t...
Claims
Application Information
Patent Timeline
Application Date:The date an application was filed.
Publication Date:The date a patent or application was officially published.
First Publication Date:The earliest publication date of a patent with the same application number.
Issue Date:Publication date of the patent grant document.
PCT Entry Date:The Entry date of PCT National Phase.
Estimated Expiry Date:The statutory expiry date of a patent right according to the Patent Law, and it is the longest term of protection that the patent right can achieve without the termination of the patent right due to other reasons(Term extension factor has been taken into account ).
Invalid Date:Actual expiry date is based on effective date or publication date of legal transaction data of invalid patent.

