
Factory bus load prediction based on similar day and least squares support vector machine

A technology of support vector machine and bus load, which is used in forecasting, instrumentation, data processing applications, etc., and can solve the problems of difficult bus load forecasting, sudden changes in data, and low forecast accuracy.

Inactive Publication Date: 2017-06-16
SICHUAN UNIV
View PDF0 Cites 20 Cited by
  • Summary
  • Abstract
  • Description
  • Claims
  • Application Information

AI Technical Summary

Problems solved by technology

The factory-specific bus load is similar to the bus load of the power grid, but its load value is much smaller than the system load, so the prediction base is relatively small and the regularity is weak
And the dedicated bus load is easily affected by small power sources in the power supply area, users, transformer operation mode in the substation, environmental factors, etc., resulting in data mutations
Therefore, compared with system load forecasting, bus load forecasting is more difficult, and the forecasting accuracy is also lower; at present, bus load forecasting mainly uses the historical data of bus load, load characteristics and corresponding influencing factors to directly carry out bus load forecasting

Method used


Image

  • Factory bus load prediction based on similar day and least squares support vector machine
  • Factory bus load prediction based on similar day and least squares support vector machine
  • Factory bus load prediction based on similar day and least squares support vector machine

Examples


Embodiment 1

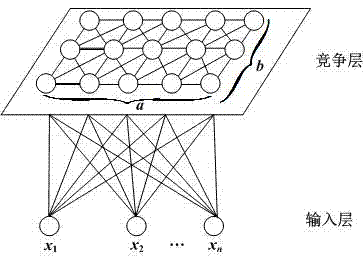
[0070] (1) Select the data sample of 35kV busbar load dedicated to a large metallurgical enterprise in May (31 days). The sample includes the maximum temperature, minimum temperature, average temperature, relative humidity, date type (weekday, weekend) and load data ( 24 points per day); taking the 31st as the forecast day, using SOM’s fuzzy clustering model and artificial experience to select ten similar days from the data of the other 30 days, the results are shown in Table 1;

[0071] Table 1 Similar days selected by artificial and SOM fuzzy clustering methods

[0072]

[0073] The 10 similar days selected by the two methods were used as training samples, and May 31 was used as the prediction day, and the least squares support vector machine model was used for prediction. The results are shown in Table 2;

[0074] Table 2 Artificial and SOM fuzzy clustering methods select similar days for

[0075]

[0076] It can be seen from Table 2 that using the SOM fuzzy clusteri...

Embodiment 2

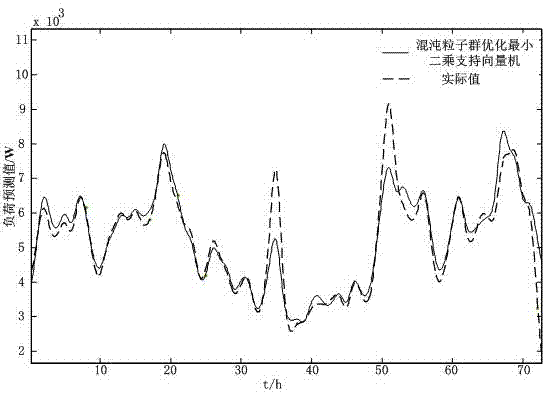
[0095] Here, the 30th, 29th, and 28th of June are the forecast days. Select ten similar days, after wavelet denoising preprocessing, and then use chaotic particle swarm optimization to optimize the least squares support vector machine model prediction; the predicted load value is as follows Figure 5 Shown, MRE value, RMSE value and A L Values ​​are shown in Table 6;

[0096] Table 6 Optimizing the least squares support vector machine with chaotic particle swarm optimization on bus 2

[0097] The model continuously predicts the MRE value, RMSE value and A L value

[0098]

[0099] From attached Figure 5 It can be seen from Table 6 that in the 72 time points of continuous prediction for 3 days, the MRE value is less than 2%, and A L The value is greater than 97%, indicating that the load prediction of bus 2 by the least squares support vector machine model optimized by chaotic particle swarm optimization meets the prediction accuracy requirements.


PUM


Abstract

The present invention relates to a method for predicting the load of a dedicated bus in large-scale industrial enterprises. The fuzzy clustering method of the SOM network is used to select similar days to be predicted, and the load data of the similar days are decomposed, denoised and reconstructed by db4 wavelet. As the training sample of the later prediction model; the penalty parameter and kernel function coverage width of the least squares support vector machine are optimized by using the chaotic particle swarm optimization algorithm, and the bus load forecasting model of the least squares support vector machine optimized by the chaotic particle swarm optimization is constructed. The method of the invention aims at the characteristics of many types of bus loads, uneven distribution, weak regularity and the like in large-scale industrial enterprises, and predicts the load of the bus, which can effectively improve the prediction accuracy of the bus load.

Description

technical field [0001] The invention relates to a method for predicting the load of a dedicated bus for large-scale industrial enterprises. Background technique [0002] The accuracy of the load prediction of the special busbar in the factory is of great significance to improve the safety and stability of the factory, production efficiency and cost saving. The factory-specific bus load is similar to the bus load of the power grid, but its load value is much smaller than the system load, so the forecast base is relatively small and the regularity is weak. And the dedicated bus load is easily affected by small power sources in the power supply area, users, transformer operation mode in the substation, environmental factors, etc., resulting in data mutations. Therefore, bus load forecasting is more difficult and less accurate than system load forecasting. At present, bus load forecasting mainly uses the historical data of bus load, load characteristics and corresponding influe...

Claims


Application Information

Patent Timeline
IPC IPC(8): G06Q10/04G06Q50/06
CPCG06Q10/04G06Q50/06
Inventor 赵莉华冯政松蒋伟
Owner SICHUAN UNIV
Learn More