Method of improving distributed fiber sensing resolution in optical frequency domain reflection
A technology of optical frequency domain reflection and distributed optical fiber, applied in the direction of using optical devices, instruments, measuring devices, etc., can solve the problem of low sensitivity of strain sensing, achieve strain or temperature sensing resolution improvement, optical frequency resolution Improved effect
- Summary
- Abstract
- Description
- Claims
- Application Information
AI Technical Summary
Problems solved by technology
Method used
Image
Examples
Embodiment 1
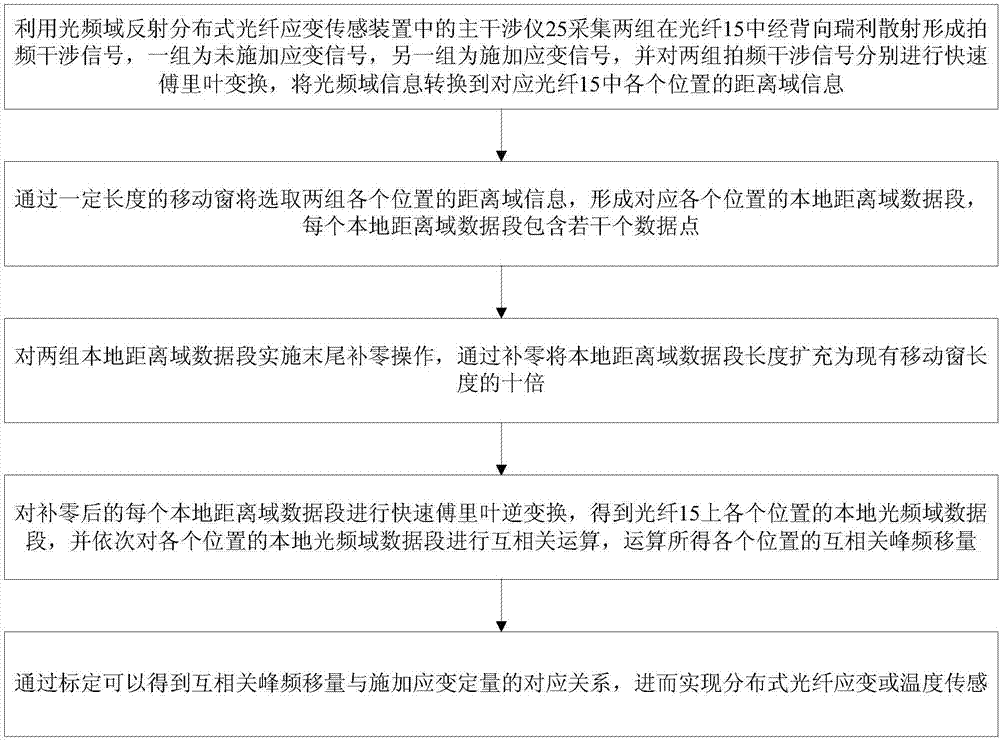
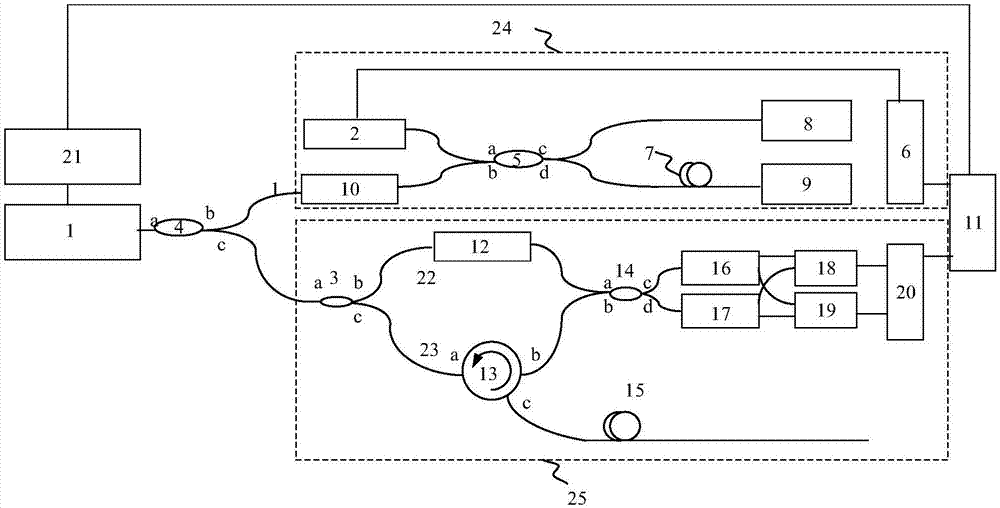
[0046] A method for improving the resolution of distributed optical fiber sensing in optical frequency domain reflection, see figure 1 with figure 2 , the optical fiber sensing resolution method comprises the following steps:
[0047] 101: Use the main interferometer 25 in the optical frequency domain reflection distributed optical fiber strain sensing device to collect two groups of beat frequency interference signals formed by back Rayleigh scattering in the optical fiber 15, one group is the signal without strain applied, and the other group is In order to apply the strain signal, fast Fourier transform is performed on the two sets of beat frequency interference signals respectively, and the optical frequency domain information is converted into the distance domain information corresponding to each position in the optical fiber 15;
[0048] 102: Through a moving window of a certain length, two sets of distance domain information of each position are selected to form a loc...
Embodiment 2
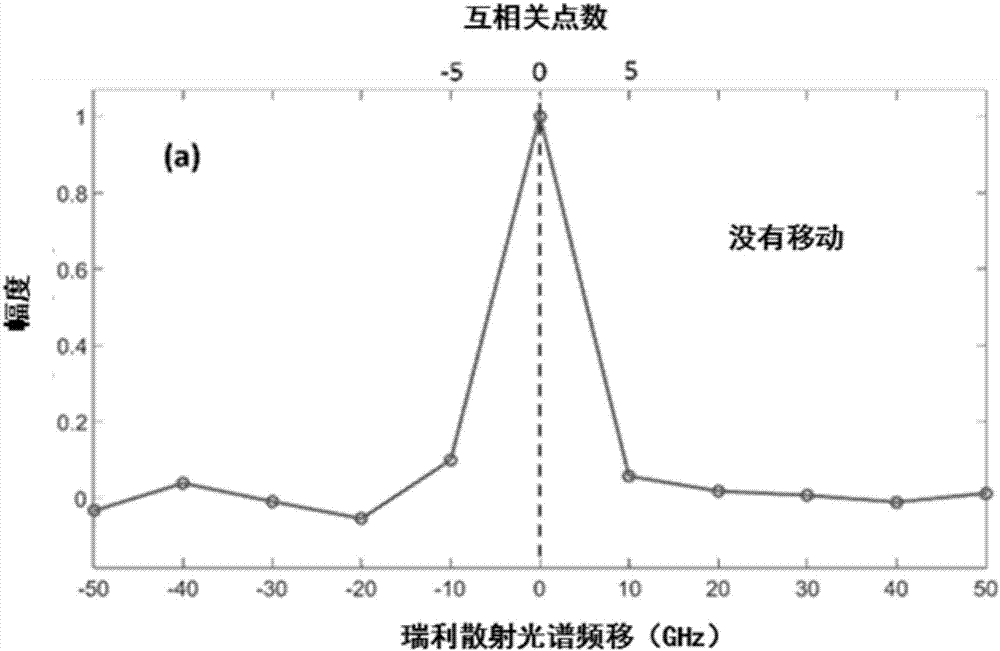
[0071] The following is combined with specific Figure 3a , Figure 3b as well as Figure 4 , Table 1 further introduces the scheme in Embodiment 1, see the following description for details:
[0072] Such as Figure 3a As shown, in the cross-correlation graph without zero padding operation, when the spatial resolution is 1cm and the strain to be measured is 10 microstrain, it can be seen that the cross-correlation peak does not move. The reason is that the number of data points is insufficient, resulting in the cross-correlation graph. The frequency value of the interval between points is relatively large, which cannot describe the small cross-correlation peak frequency shift, resulting in the inability to describe the small strain change value corresponding to the frequency shift.
PUM
 Abstract
Description
Claims
Application Information
 - R&D
- Intellectual Property
- Life Sciences
- Materials
- Tech Scout
- Unparalleled Data Quality
- Higher Quality Content
- 60% Fewer Hallucinations
Browse by: Latest US Patents, China's latest patents, Technical Efficacy Thesaurus, Application Domain, Technology Topic, Popular Technical Reports.
© 2025 PatSnap. All rights reserved.Legal|Privacy policy|Modern Slavery Act Transparency Statement|Sitemap|About US| Contact US: help@patsnap.com


