MLE-PSO indoor positioning method based on RSSI (Received Signal Strength Indication)

An indoor positioning and indoor environment technology, which is applied to services, measuring devices, instruments, etc. based on location information, can solve the problems of unguaranteed positioning accuracy and large positioning errors, and achieves reduction of data calculation amount, improvement of efficiency, and accurate location. Effect

Active Publication Date: 2017-08-18
BEIJING INSTITUTE OF TECHNOLOGYGY
1 Cites 9 Cited by

AI-Extracted Technical Summary

Problems solved by technology

However, when the ranging error becomes larger, the positioning error will al...

Abstract

The invention discloses an MLE-PSO indoor positioning method based on an RSSI (Received Signal Strength Indication). The method comprises the following steps: setting a plurality of base stations in an indoor environment, acquiring an RSSI value of each base station by a receiving terminal, and measuring a distance value between the receiving terminal and each base station; acquiring an estimated position by using maximum likelihood estimation, wherein each base station is corresponding to one estimated position, and determining a limited range by an area in which a plurality of estimated positions are located; initializing each parameter of a particle swarm optimization algorithm, and generating a particle swarm within the limited range at random; and an using the particle swarm optimization algorithm to calculate a global optimal solution of the particle swarm, in the particle swarm optimization algorithm, taking the above limited range as the limit, and selecting the most suitable global optimal solution as the estimated position output. The method of the invention obviously improves the indoor positioning accuracy, and meanwhile guarantees the computation speed of a positioning algorithm, the amount of data collection required for positioning, the number of iterations and other dynamic performances.

Application Domain

Technology Topic

Image

  • MLE-PSO indoor positioning method based on RSSI (Received Signal Strength Indication)
  • MLE-PSO indoor positioning method based on RSSI (Received Signal Strength Indication)
  • MLE-PSO indoor positioning method based on RSSI (Received Signal Strength Indication)

Examples

  • Experimental program(1)

Example Embodiment

[0039] The present invention will be described in detail below with reference to the drawings and embodiments.
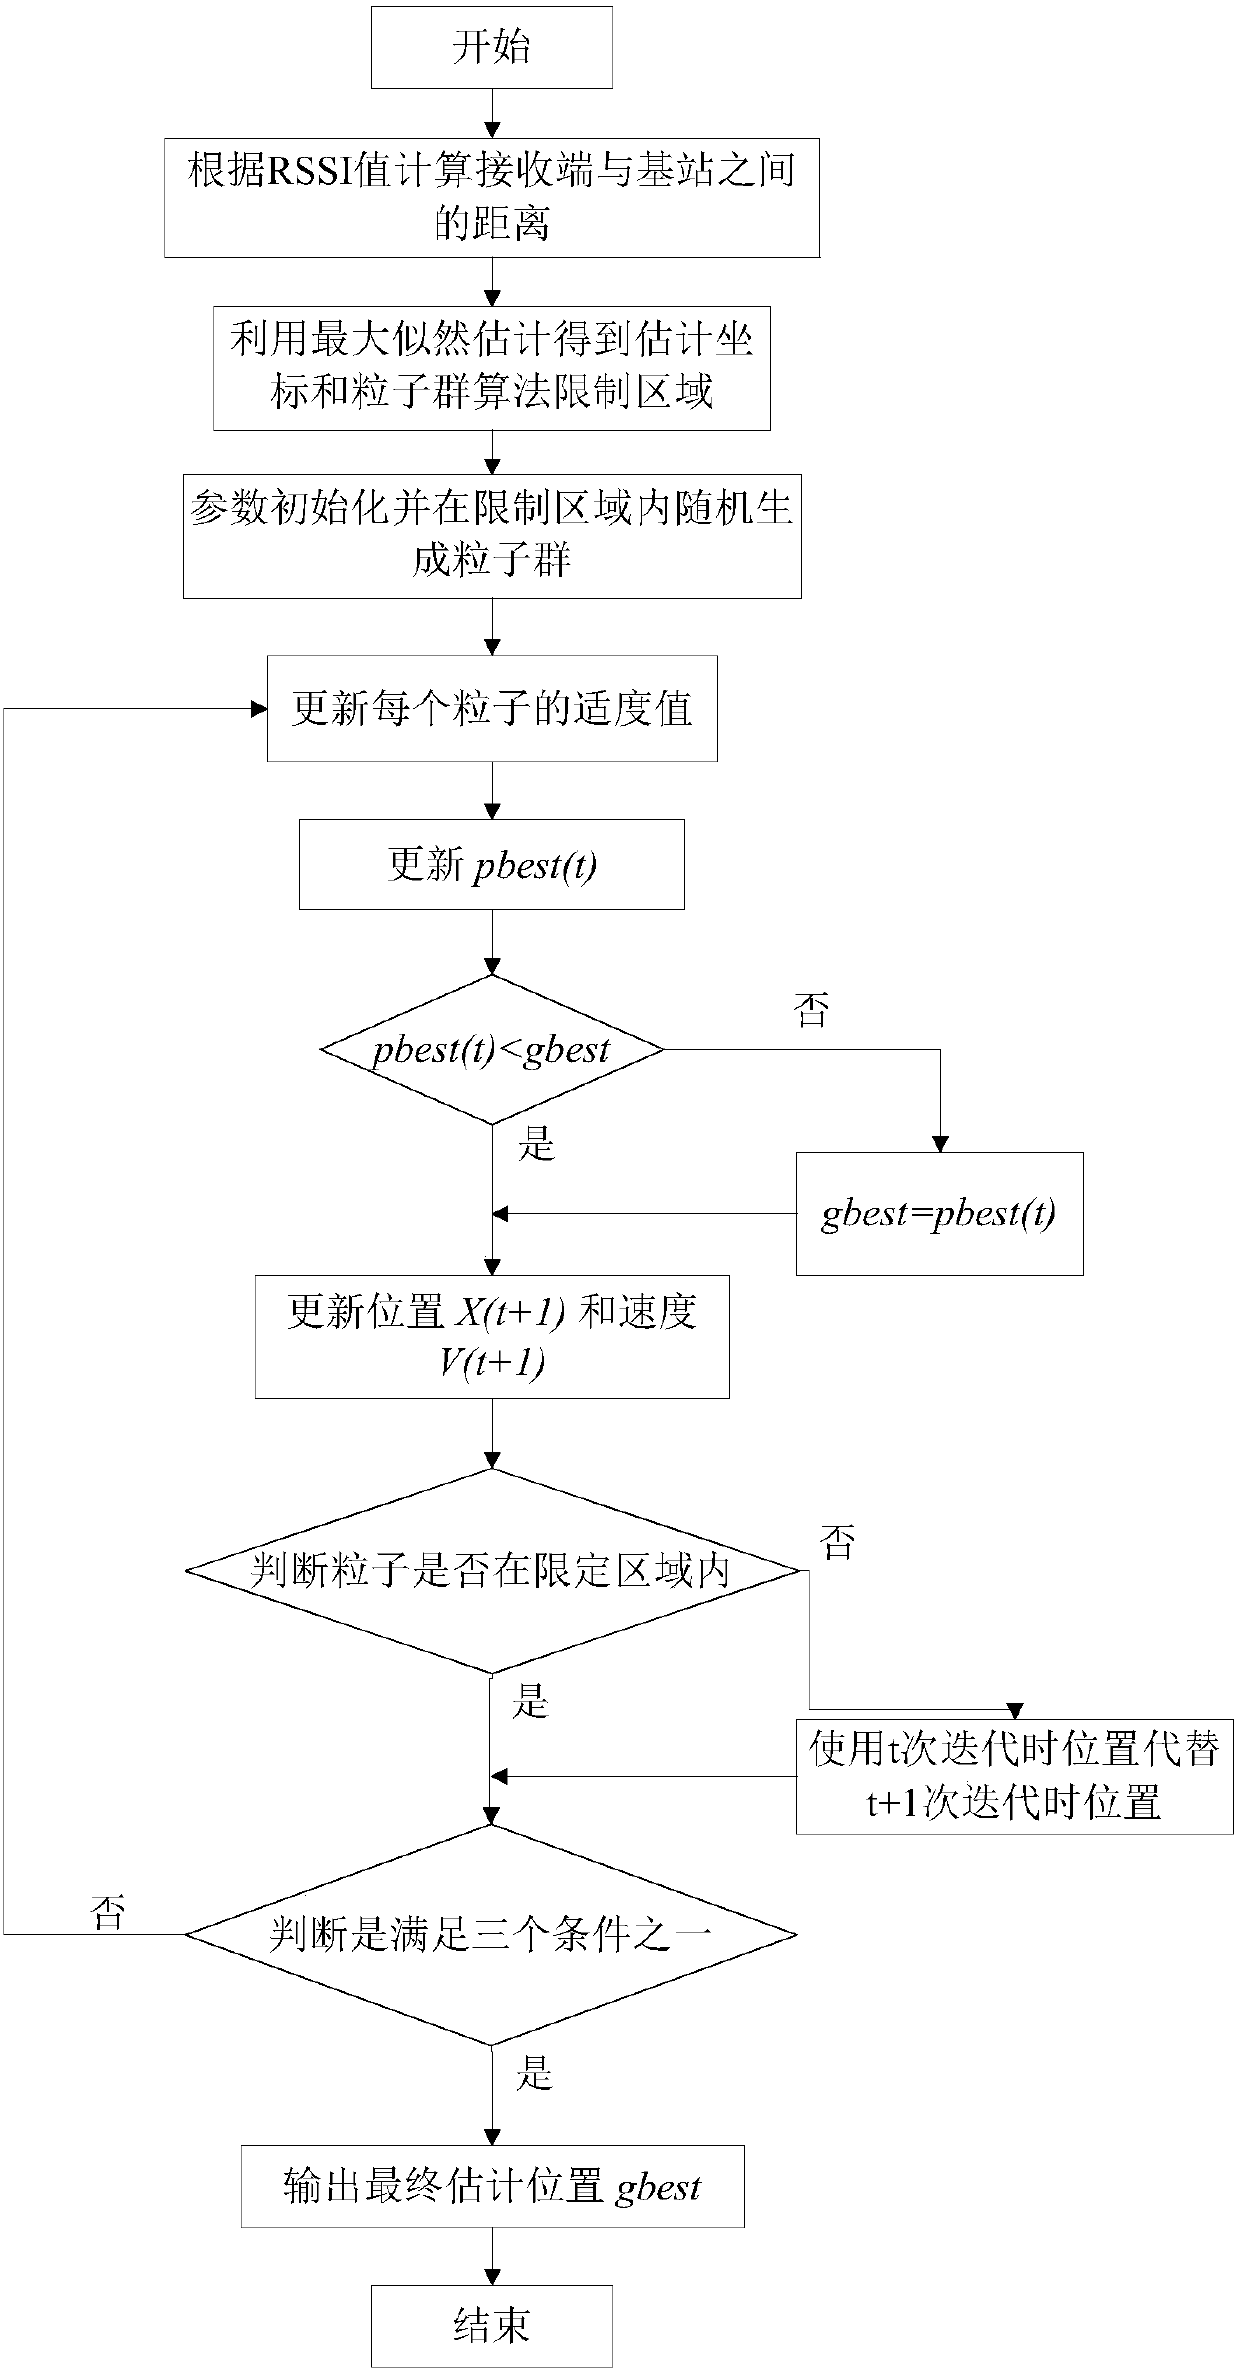
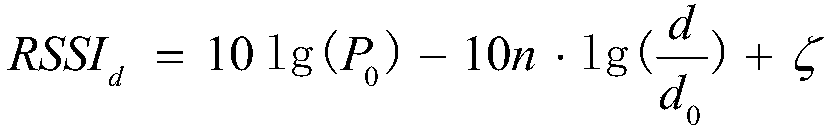
[0040] The principle of the MLE-PSO indoor positioning algorithm based on RSSI is: According to the attenuation characteristics of wireless sensor signal propagation in the room, establish a mathematical model of the distance between the receiving signal strength (RSSI) of the receiving terminal and the base station and receiving terminal, and use this mathematical model to calculate the distance Calculation. Use maximum likelihood estimation to obtain the initialization and iteration limit range of the subsequent particle swarm optimization algorithm positioning process, use the particle swarm algorithm to update the position and velocity of the particle swarm within the range, and judge the position of each particle. If the particle position exceeds The restricted range is replaced with the original position, and the optimal position of the particle and the global optimal position are updated according to the fitness function in each iteration until the maximum number of iterations is reached.
[0041] The MLE-PSO indoor positioning algorithm process based on RSSI proposed by the present invention is as follows figure 1 As shown, the details are as follows:
[0042] Step 1. Set up multiple base stations in the indoor environment, and the receiving terminal obtains the RSSI value of each base station, and the distance between the receiving terminal and each base station is measured by the logarithmic shadow attenuation model; the height of the base station is not considered in the present invention, namely The receiving terminal and the base station are in the same plane.
[0043] According to the attenuation characteristics of wireless sensor signal propagation indoors, the mathematical model of the distance between the receiving signal strength (RSSI) of the receiving terminal and the base station and receiving terminal is established as follows:
[0044]
[0045] Among them, RSSI d (dBm) and P 0 (dBm) is the distance between the receiving end and the base station, d and d 0 Signal reception strength under, n is the path loss factor between nodes, ζ~(0,σ 2 ) Is the white noise interference caused by the shadow fading effect, where the mean square error σ depends on the interference of the propagation path. Therefore, when the path loss factor n of the environment and the received signal strength RSSI are measured d (dBm) After that, the approximate distance between the base station and the receiving end can be measured:
[0046]
[0047] When we are collecting RSSI d At the time, the random variable ζ has been included in it, so there must be an error between the estimated distance obtained by the above formula and the true distance.
[0048] Step 2. In the known coordinates of J base stations , Use the distance d between the receiving end and each base station obtained in step 1 j (j=1,2,...,J), using maximum likelihood estimation to obtain the estimated position Each base station corresponds to an estimated position, from which the initialization and iteration limit range of the particle swarm optimization algorithm positioning are obtained. The specific expression is:
[0049]
[0050] among them
[0051]
[0052]
[0053] Due to the existence of ranging errors, there must be errors in the obtained position. We take the largest abscissa and ordinate values ​​obtained in each set of data to determine a square area, based on which we obtain the restricted area X of the particle swarm algorithm L ,X R ,Y U ,Y D.
[0054] Step 3. Initialize the particle swarm optimization algorithm parameters: set a positive learning factor c 1 And c 2 (Generally set to 0.8 is more appropriate), the maximum and minimum inertia weight ω max ,ω min , The maximum number of iterations T and the particle swarm population size N. And obtain the particle swarm with population size N according to the following formula:
[0055] The coordinate of the i-th particle is x i (t), y i (t), the initial value of t is 0;
[0056] x i (0)=X L +r(X R -X L )
[0057] y i (0)=Y D +r(Y U -Y D );
[0058] Where r is a random number ranging from 0 to 1; each i corresponds to a value of r.
[0059] Step 4. At the tth iteration, the initial value of t is 1, according to the fitness function Calculate the appropriate value of each particle and update the individual optimal value pbest i (t) and the population optimal value gbest(t): use pbest i (t) Save to the position where the modest value of the i particle is the smallest in the tth iteration, and compare all pbest i (t), save the position of the particle with the smallest fitness as the global optimal amount in gbest(t).
[0060] The appropriate function in the particle swarm optimization algorithm is
[0061] Where J is the number of base stations, j is the current base station number;
[0062] d i Is the distance between the i-th particle and the j-th base station, X i (t) is the position of the i-th particle in the t-th iteration;
[0063] Use the particle swarm optimization algorithm to obtain the individual optimal value pbest at the tth iteration i (t) and the population optimal value is gbest(t), then the specific formula for updating speed and position according to the particle swarm optimization algorithm is:
[0064] The velocity of the i-th particle at the +1tth iteration is updated to
[0065] V i (t+1)=ωV i (t)+c 1 r 1 [pbest i (t)-x i (t))+c 2 r 2 [gbest-x i (t)]
[0066] The position of the i-th particle at the t+1th iteration is updated to: X i (t+1)=X i (t)+V i (t+1);
[0067] Where the initial velocity V i (0) is 0, initial position X i (0) Use the initial coordinate of the i-th particle to represent;
[0068] Where ω is the inertia weight when the number of iterations is t:
[0069] Step 5. Determine whether the position of the updated t+1th iteration is within the limited range, if yes, go to step 6; if not, use the position at time t as the position of the t+1th iteration, and then go to step 6;
[0070] Step 6. It is judged that one of the following conditions is met: meeting the set positioning accuracy or meeting the number of iterations as the set maximum number of iterations;
[0071] If one of the above conditions is met, the global optimal solution at this time is output as the estimated position output, and the method ends. Otherwise, t increases by 1, and returns to step 4.
[0072] In summary, the above are only preferred embodiments of the present invention, and are not intended to limit the protection scope of the present invention. Any modification, equivalent replacement, improvement, etc., made within the spirit and principle of the present invention shall be included in the protection scope of the present invention.

PUM

no PUM

Description & Claims & Application Information

We can also present the details of the Description, Claims and Application information to help users get a comprehensive understanding of the technical details of the patent, such as background art, summary of invention, brief description of drawings, description of embodiments, and other original content. On the other hand, users can also determine the specific scope of protection of the technology through the list of claims; as well as understand the changes in the life cycle of the technology with the presentation of the patent timeline. Login to view more.

Similar technology patents

Classification and recommendation of technical efficacy words

  • Accurate location
  • High positioning accuracy
Why Eureka
Try Eureka