Method of drawing real time music frequency spectrum vector graph

A vector graphics and frequency spectrum technology, applied in the field of real-time music spectrum vector graphics drawing, can solve the problems of lack of auditory and visual interaction in visual effects, monotonous music spectrum drawing effect, and weak sense of rhythm, etc., to improve the quality of graphics and images, Improve image quality and rendering performance to achieve real-time effects

Active Publication Date: 2017-10-24
HANGZHOU QUWEI SCI & TECH
View PDF4 Cites 4 Cited by
  • Summary
  • Abstract
  • Description
  • Claims
  • Application Information

AI Technical Summary

Problems solved by technology

The visual display of the music spectrum is an important part of it, but the existing music spectrum drawing effect is monotonous, basically based on the changes in the histogram; and the visual effect lacks the sense of auditory and visual interaction, and the visual sense of rhythm is not good enough. Strong, poor overall experience

Method used


Image

  • Method of drawing real time music frequency spectrum vector graph
  • Method of drawing real time music frequency spectrum vector graph
  • Method of drawing real time music frequency spectrum vector graph

Examples


Embodiment Construction

[0036] The present invention will be further described below in conjunction with the accompanying drawings and specific embodiments.

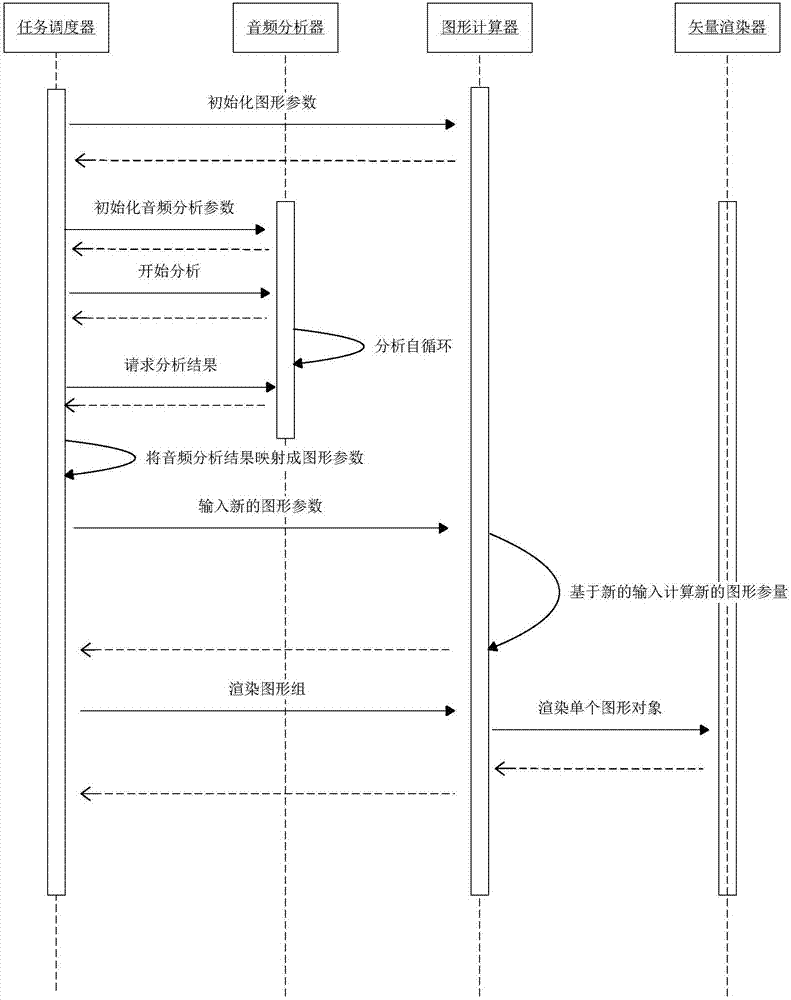
[0037] Such as figure 1 and figure 2 As shown, a method for drawing real-time music spectrum vector graphics specifically includes the following steps:

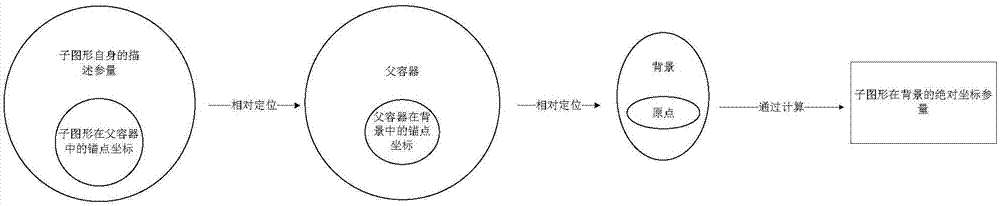
[0038] 101) Step of initializing parameters: the task scheduler initializes the relevant parameters of the graph calculator and the audio analyzer. The parameters of the graphic calculator include the number of graphs, the shape of each graph, the maximum and minimum size of each graph, the color of the graph, the coordinates of the graph in the graph container, the coordinates of the graph container relative to the background and other parameters; the audio analysis The parameters of the instrument include the target music file to be analyzed, the output frequency range, the number of frequency points, the mapping coefficient, and the mapped output value range.

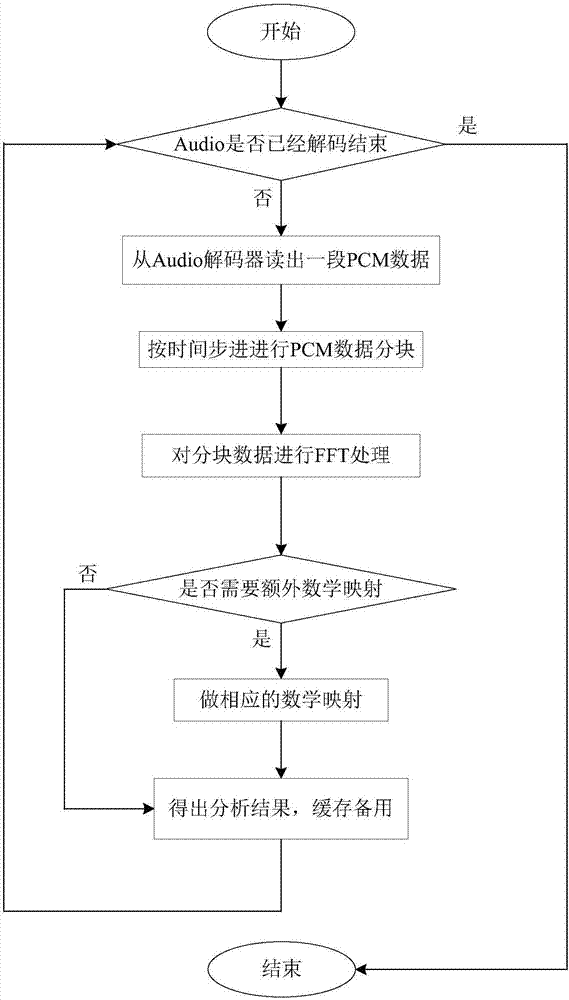
[0039] 102) Audio analysi...


PUM


Abstract

The invention discloses a method of drawing a real time music frequency spectrum vector graph. The method of drawing a real time music frequency spectrum vector graph includes the following steps: a step of initializing parameters, a step of audio analysis, a step of calling audio data, a step of data conversion, and a step of graph processing. The method of drawing a real time music frequency spectrum vector graph realizes real time high precision analysis of frequency spectrum for improving rhythm sensation and interaction feeling of music frequency spectrum. The method of drawing a real time music frequency spectrum vector graph realizes diversity of frequency spectrum graph types and diversity of graph parameter change. The method of drawing a real time music frequency spectrum vector graph realizes timeliness of frequency spectrum drawing, and can improve the graph and image quality.

Description

technical field [0001] The invention relates to the field of audio and video processing, more specifically, it relates to a method for drawing real-time music spectrum vector graphics. Background technique [0002] Music has always been an art form to express emotions, but listening to music in the traditional sense can no longer satisfy people's pursuit of a colorful world, so music visualization came into being. It also coincided with the considerable development of computer technology in image processing, virtual reality, digital signal processing, etc., which laid the foundation for the further development of music visualization technology. The visual display of the music spectrum is an important part of it, but the existing music spectrum drawing effect is monotonous, basically based on the changes in the histogram; and the visual effect lacks the sense of auditory and visual interaction, and the visual sense of rhythm is not good enough. Strong, poor overall experienc...

Claims


Application Information

Patent Timeline
Patent Type & Authority Applications(China)
IPC IPC(8): G06T11/20G10L19/02G10L19/032
CPCG06F17/142G06T11/20G06T11/40G06T11/60G06T15/205
Inventor 龚俊韩晟
Owner HANGZHOU QUWEI SCI & TECH
Why Eureka
Try Eureka