A Separation Method of Overlapping Spectral Lines Based on MPT Spectral Data

A technology of spectral data and separation method, applied in the direction of color/spectral characteristic measurement, etc., can solve the problems of reduced detection precision and accuracy, the inability to separate the spectral peaks, and the inability to use directly, so as to improve the detection ability and detection accuracy. Sample analysis efficiency, the effect of reducing selection constraints

Active Publication Date: 2020-03-27
中控全世科技(杭州)有限公司
View PDF6 Cites 0 Cited by
  • Summary
  • Abstract
  • Description
  • Claims
  • Application Information

AI Technical Summary

Problems solved by technology

The separation of each component of the sample to be analyzed at different wavelength positions on the spectrogram is completed by the spectroscopic system in the spectral data acquisition and analysis system. However, due to the limited resolution capability of the hardware equipment, many element spectral lines with very close wavelengths are separated. The spectral peaks cannot be completely separated, and in the collected characteristic spectral data, it appears as a combined peak form formed by the overlapping of multiple spectral peaks, which is not conducive to the subsequent quantitative analysis of samples
[0003] Therefore, under normal circumstances, since the overlapping peak data is composed of the spectral peaks of multiple element spectral lines, it cannot be used directly. Therefore, when using the MPT spectrometer for sample analysis, try to avoid using the spectral lines in the overlapping peak-shaped area. , which makes many times, in order to avoid overlapping peaks, give up the selection of the spectral line with strong emission intensity of the element to be measured, and choose the spectral line with weak emission intensity of the element, which reduces the detection precision and accuracy of the instrument for the sample.
Especially when analyzing complex mixed samples, it is necessary to carry out complex sample pretreatment first. Even after pretreatment, it is often due to the strong optional emission intensity and few or no peak-overlapping spectral lines, resulting in the instrument’s sensitivity to the sample. The detection precision and accuracy are not enough, even the samples cannot be quantitatively detected

Method used


Image

  • A Separation Method of Overlapping Spectral Lines Based on MPT Spectral Data
  • A Separation Method of Overlapping Spectral Lines Based on MPT Spectral Data
  • A Separation Method of Overlapping Spectral Lines Based on MPT Spectral Data

Examples


Embodiment Construction

[0033] The present invention will be further described in detail below through specific embodiments in conjunction with the accompanying drawings.

[0034] The present invention separates the overlapping spectral lines based on the MPT spectral data to obtain the independent peak shape and related spectral peak data of each spectral peak, so that it can be used for qualitative and quantitative analysis of each component of the sample, thereby improving the sensitivity of the MPT spectrometer to complex Detection capability and detection accuracy of mixed samples.

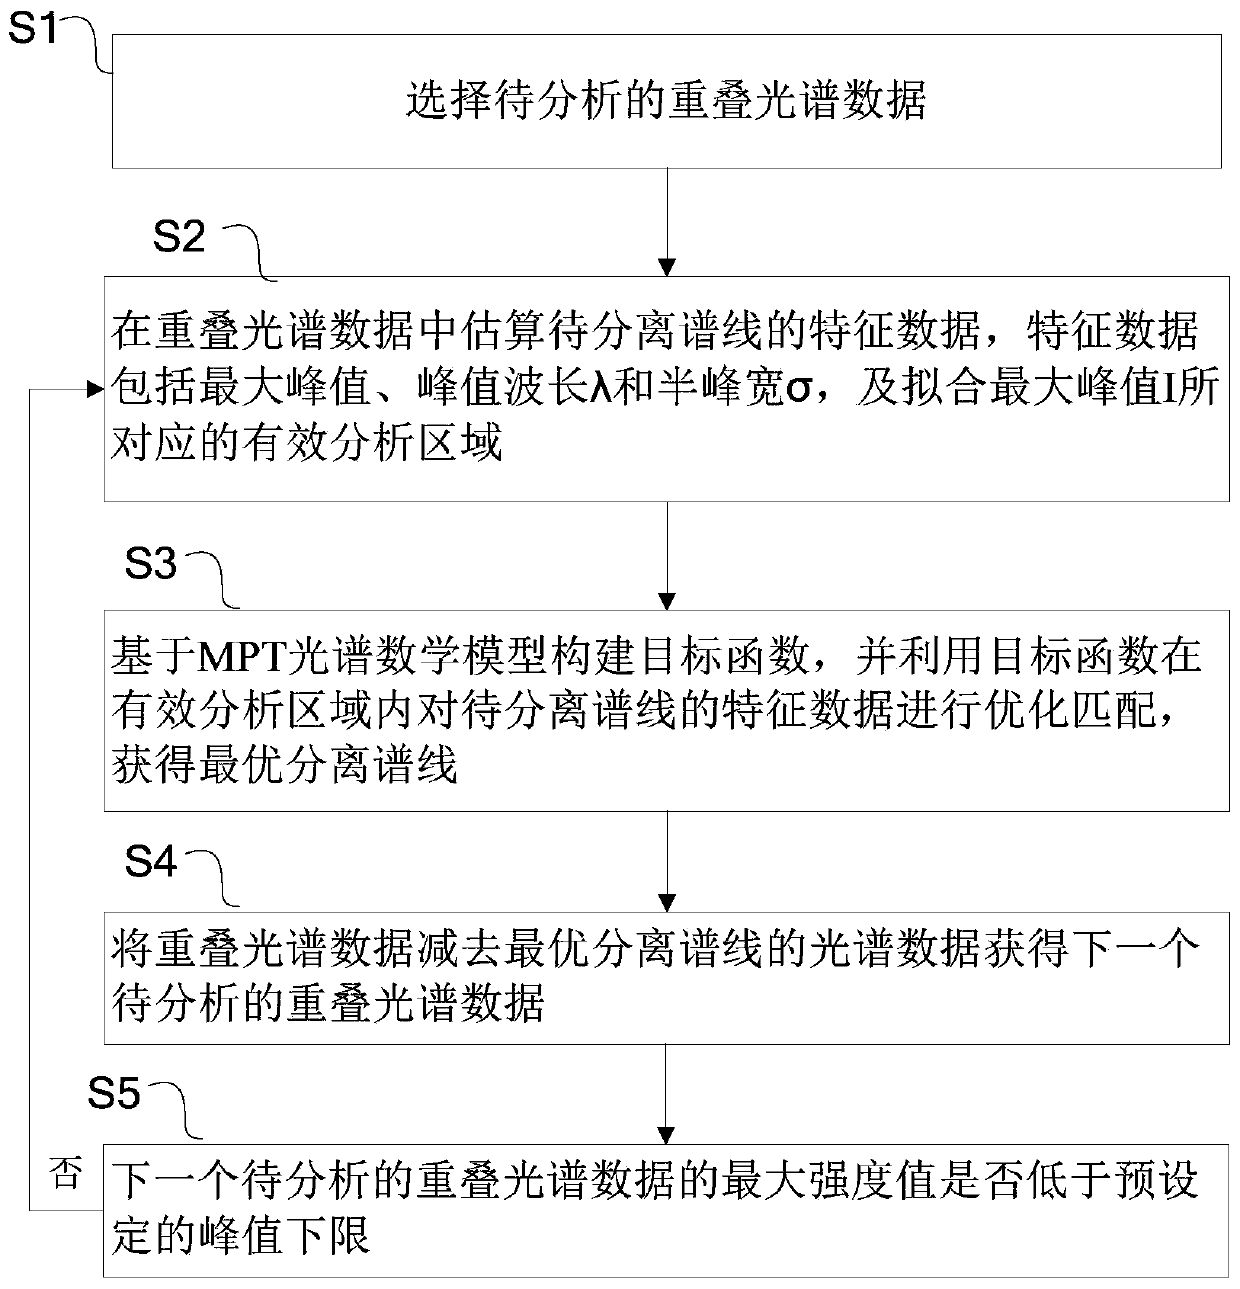
[0035] The overlapping spectral line separation method based on MPT spectral data provided in this example specifically includes the following steps, and its flow chart is as follows figure 1 shown.

[0036] S1: Select the overlapping spectral data to be analyzed.

[0037] Overlapped spectral data is represented as {X,Y}, where X = {λ 0 ,λ 1 ,λ i ...λ n}, Y={I 0 , I 1 , I i …I n}, i=0,1,2...n, i is the ser...


PUM


Abstract

The invention discloses an overlapped spectral line separation method based on MPT (Microwave Plasma Torch) spectral data. The method comprises the following steps: selecting to-be-analyzed overlappedspectral data, and estimating feature data of to-be-separated spectral lines in the overlapped spectral data, wherein the feature data comprises a maximum peak I, a peak wavelength lambda and a half-peak breadth sigma; fitting an effective analysis area corresponding to the maximum peak I; constructing an objective function based on an MPT spectral mathematical model, and performing optimal matching on the feature data of to-be-separated spectral lines in the effective analysis area by utilizing the objective function so as to obtain the optimal separated spectral line; and subtracting the spectral data of the optimal separated spectral line from the overlapped spectral data, thereby obtaining the next to-be-analyzed overlapped spectral data. Therefore, when sample analysis is performed by an MPT spectrometer, qualitative and quantitative analysis can be performed by directly using the data in an overlapped peak area, so that the analytical performance of the MPT spectrometer and thedetection ability and detection precision of the MPT spectrometer on complicated mixed samples are greatly improved.

Description

technical field [0001] The invention relates to the technical field of atomic emission spectroscopic analysis, in particular to a method for separating overlapping spectral lines based on MPT spectral data. Background technique [0002] The MPT spectrometer is composed of a light source system and a spectral data acquisition and analysis system. The light source system is used to excite the characteristic spectrum of the elements in the sample to be tested; the spectrum acquisition and analysis system is used to collect the characteristic spectrum information of the elements excited by the light source system, and then use the characteristic spectrum information for qualitative or quantitative analysis of elements in a sample. The separation of each component of the sample to be analyzed at different wavelength positions on the spectrogram is completed by the spectroscopic system in the spectral data acquisition and analysis system. However, due to the limited resolution cap...

Claims


Application Information

Patent Timeline
Patent Type & Authority Patents(China)
IPC IPC(8): G01N21/25
CPCG01N21/25
Inventor 陈挺刘文龙郭淳郑磊落赖晓健
Owner 中控全世科技(杭州)有限公司
Why Eureka
Try Eureka