A test method for LED wafers with stable spectral energy distribution

A spectral energy distribution, wafer testing technology, applied in diode testing, single semiconductor device testing, spectrum investigation, etc., can solve the problems of sudden change in integration time, large intensity fluctuation of spectral energy distribution, discontinuity in integration time, etc. Achieve the effect of solving fluctuations and good spectral characteristics

Active Publication Date: 2020-02-21
YANGZHOU CHANGELIGHT
View PDF10 Cites 0 Cited by
  • Summary
  • Abstract
  • Description
  • Claims
  • Application Information

AI Technical Summary

Problems solved by technology

[0007] The measurement method in the prior art is to give the INT value range of the spectral energy distribution, and use the variable integration time to obtain the spectral energy distribution map, which will cause the discontinuity of the integration time, or even a sudden change in the integration time, resulting in a spectral energy distribution The intensity fluctuation of the graph is large, and the intensity fluctuation of the spectral energy distribution graph is large, especially in the edge area or the junction of the middle area and the edge area, resulting in a wavelength difference of 0.2nm~ 1.6nm, which has a relatively unfavorable result on the stability and accuracy of the entire LED wafer measurement, so it is necessary to find a stable spectral energy distribution measurement method

Method used


Image

  • A test method for LED wafers with stable spectral energy distribution
  • A test method for LED wafers with stable spectral energy distribution
  • A test method for LED wafers with stable spectral energy distribution

Examples


Embodiment Construction

[0040] The following will clearly and completely describe the technical solutions in the embodiments of the present invention with reference to the accompanying drawings in the embodiments of the present invention. Obviously, the described embodiments are only some, not all, embodiments of the present invention. Based on the embodiments of the present invention, all other embodiments obtained by persons of ordinary skill in the art without making creative efforts belong to the protection scope of the present invention.

[0041] In order to make the above objects, features and advantages of the present invention more comprehensible, the present invention will be further described in detail below in conjunction with the accompanying drawings and specific embodiments.

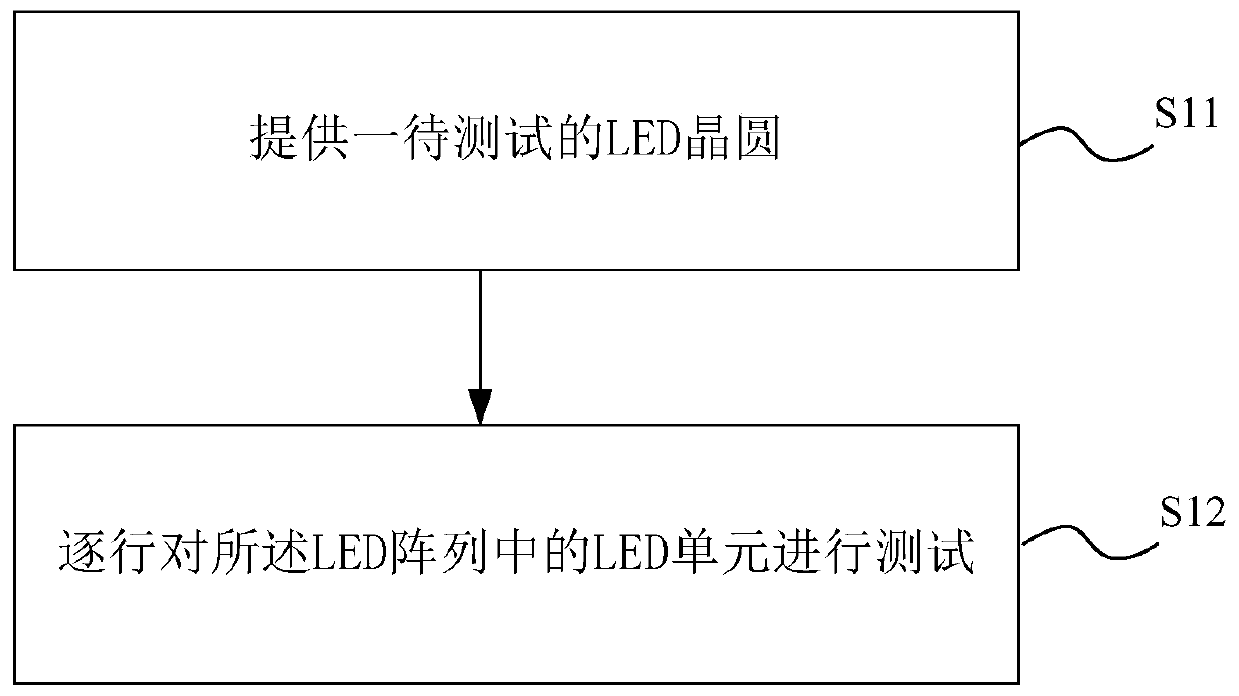
[0042] refer to image 3 , image 3 A schematic flow chart of an LED wafer test method for stable spectral energy distribution provided by an embodiment of the present invention, the test method includes:

[004...


PUM


Abstract

The invention discloses an LED wafer test method for stabilizing spectral energy distribution. When a non-first LED unit in a first edge area of a row of LED units is measured, the integration time ofat least one preceding LED unit of the non-first LED unit is taken as a reference. When a LED unit of a second edge is measured, the integration time of the LED unit is calculated directly based on the INT value proportion of the LED unit to the LED unit in a parameter-stable middle area, so that the integration time changes continuously from the edge to the middle area during the test, the spectral energy distribution of the LED unit in the edge area is consistent with that of the LED unit in the middle area, good spectral characteristics are presented, and the fluctuation problem of the spectral energy in the measurement process in the prior art is solved.

Description

technical field [0001] The invention relates to the technical field of LED testing, in particular to a testing method for LED wafers with stable spectral energy distribution. Background technique [0002] LED can be divided into GaN blue light-emitting diodes and AlGaInP red-yellow light-emitting diodes according to the materials of epitaxial growth. The photoelectric characteristic parameters of AlGaInP red-yellow light-emitting diodes include forward workpiece voltage, dominant wavelength, light intensity, leakage current and other parameters. The above parameters The test method is to output a constant current through the current source of the test machine, light up the LED unit on the LED wafer, and receive light through the normal direction in the vertical direction. The LED emits light through the microscope and optical fiber to the spectrometer, and the spectrometer converts the received light into The energy distribution function of the spectral curve, such as figur...

Claims


Application Information

Patent Timeline
Patent Type & Authority Patents(China)
IPC IPC(8): G01R31/26G01J3/28
CPCG01J3/28G01R31/2635
Inventor 肖和平宗远
Owner YANGZHOU CHANGELIGHT
Why Eureka
Try Eureka