
Method for drawing distribution map of lightning stroke tripping risk

A distribution map and tripping technology, which is applied in image data processing, 2D image generation, instruments, etc., can solve the problems of the influence of positioning accuracy and the inability to effectively reflect the frequency of lightning on the line, and achieve accurate and reliable analysis. The analysis effect is good and the analysis The scientific and reasonable effect of the process

Inactive Publication Date: 2018-05-08
STATE GRID HUNAN ELECTRIC POWER +1
View PDF7 Cites 8 Cited by
  • Summary
  • Abstract
  • Description
  • Claims
  • Application Information

AI Technical Summary

Problems solved by technology

However, the lightning-to-ground flash density calculated by the line corridor method is related to the width of the corridor. If the statistical data is too small, it will be affected by the positioning accuracy, and if it is too wide, it will not be able to effectively reflect the actual lightning frequency of the line.

Method used


Image

  • Method for drawing distribution map of lightning stroke tripping risk
  • Method for drawing distribution map of lightning stroke tripping risk
  • Method for drawing distribution map of lightning stroke tripping risk

Examples


Embodiment Construction

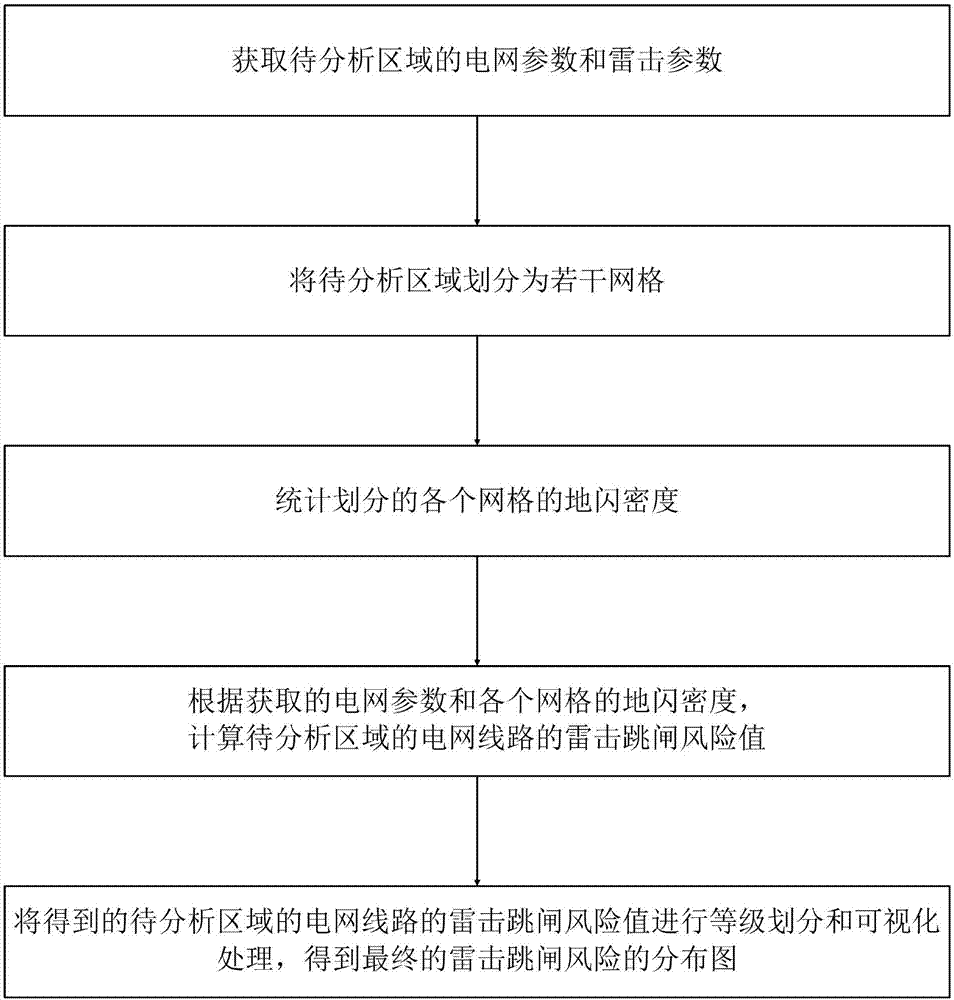
[0032] Such as figure 1 Shown is the flow chart of the method of the present invention: the method for drawing the distribution map of the lightning tripping risk provided by the present invention includes the following steps: .

[0033] S1. Obtain the power grid parameters and lightning strike parameters of the area to be analyzed;

[0034] Power grid parameters include line name, tower name, tower number, longitude, latitude, tower type, appellation height, tower property, lightning conductor crossarm length, conductor crossarm length, lightning conductor hanging point height, conductor hanging point height, tower grounding resistance , ground inclination and vertical span, etc.; the principle of ground inclination is as follows: the value of the ground inclination in plain areas is 0°, and the value of ground inclination in mountainous areas is 10°;

[0035] Lightning parameters include lightning occurrence time, location coordinates of lightning strike point and lightning...


PUM


Abstract

The invention discloses a method for drawing a distribution map of lightning stroke tripping risk. The method comprises: obtaining power grid parameters and lightning stroke parameters of a to-be-analyzed region; dividing the to-be-analyzed region into a plurality of grids; counting cloud-to-ground lightning density of each grid; calculating lightning stroke tripping risk values of power grid circuits of the to-be-analyzed region; grading the lightning stroke tripping risk values of the power grid circuits of the to-be-analyzed region and performing visualization processing, to obtain a finaldistribution map of lightning stroke tripping risk. Through historical operation data of the power grid and lightning stroke historical data, the to-be-analyzed region is divided by grids, and the lightning stroke tripping risk value of each grid is calculated by using a scientific and reasonable calculation method, to obtain the distribution map of lightning stroke tripping risk. Therefore, the method can accurately and reliably analyze lightning stroke tripping probability, and an analysis process is scientific and reasonable, and analysis effect is good.

Description

technical field [0001] The invention specifically relates to a method for drawing a distribution map of a lightning trip risk. Background technique [0002] With the development of national economy and technology and the improvement of people's living standards, electric energy has become an indispensable secondary energy source in people's daily production and life, bringing endless convenience to people's production and life. [0003] The economically developed eastern and southeastern regions of our country are densely covered with power transmission networks. Lightning strikes are frequent in these areas. Lightning strike trips are one of the main threats to power grid security. Statistics show that among the trips of 110kV and above transmission lines, the proportion caused by lightning strikes is as high as 50%. ~70%. Assessing the risk of lightning tripping of transmission lines to formulate differentiated lightning protection measures is an important idea for the ec...

Claims


Application Information

Patent Timeline
Patent Type & Authority Applications(China)
IPC IPC(8): G06F17/50G06T11/20
CPCG06F30/18G06T11/203
Inventor 唐军傅纪年侯赋拉
Owner STATE GRID HUNAN ELECTRIC POWER
Learn More