Eureka AIR delivers breakthrough ideas for toughest innovation challenges, trusted by R&D personnel around the world.

Method for drawing atmospheric corrosion level map

An atmospheric corrosion and grade technology, applied in the field of grade map drawing, can solve the problems of lack of research and application of corrosion grade division, and achieve the effect of saving costs and increasing geographic information data

Inactive Publication Date: 2018-05-11
SOUTH CHINA UNIV OF TECH +2
View PDF7 Cites 9 Cited by
  • Summary
  • Abstract
  • Description
  • Claims
  • Application Information

AI Technical Summary

Problems solved by technology

[0003] At present, most of the corrosion experiments focus on the corrosion behavior of materials in a certain atmospheric environment, and they all analyze the data measured during the experiment. However, there is a lack of research and application on the atmospheric corrosion behavior and the classification of corrosion levels covering the entire area from a macro perspective.

Method used


Image

  • Method for drawing atmospheric corrosion level map
  • Method for drawing atmospheric corrosion level map
  • Method for drawing atmospheric corrosion level map

Examples


Embodiment

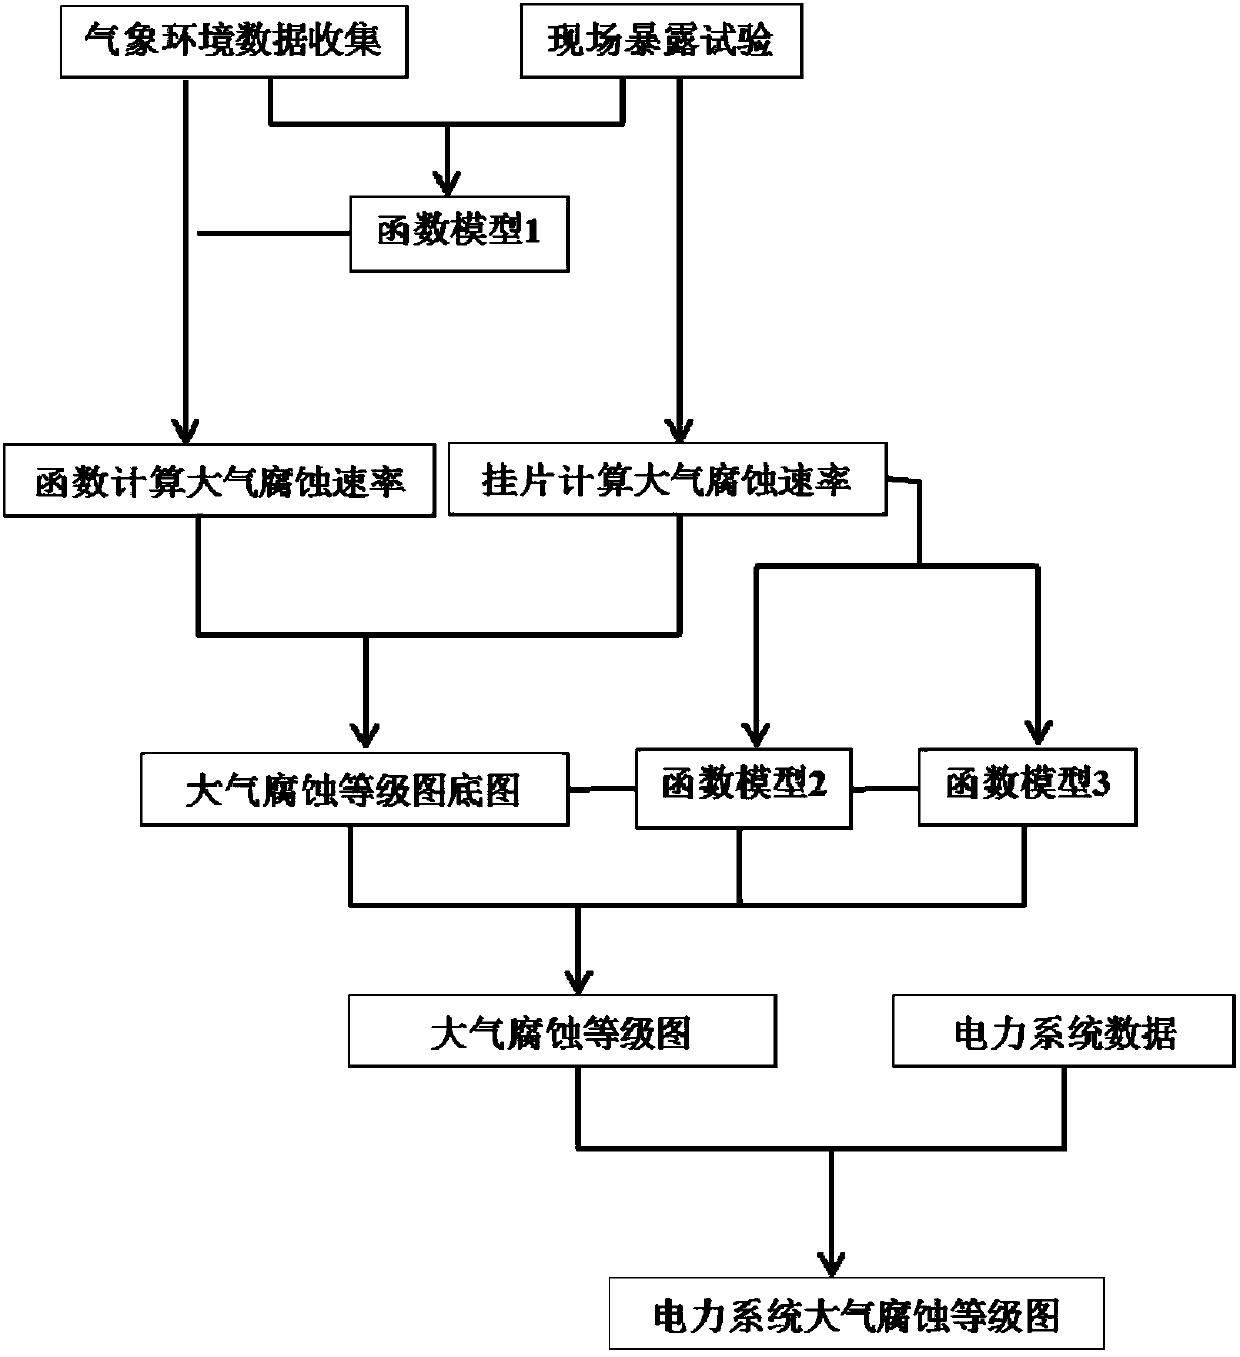
[0041] This embodiment provides a method for drawing an atmospheric corrosion level map, the flow chart of the method is as follows figure 2 shown, including the following steps:

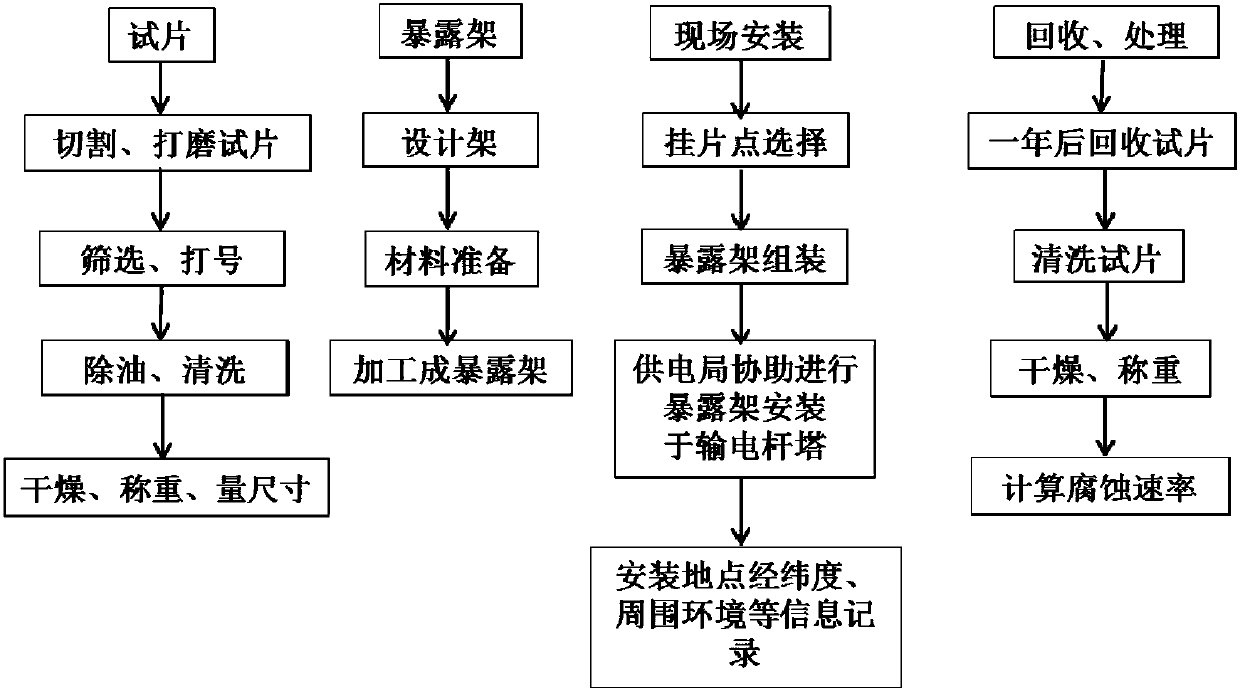
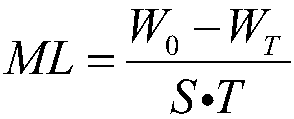
[0042] S1. Atmospheric corrosion rate data collection: through the field exposure test, the flow chart is as follows figure 1 As shown, including on-site coupons of transmission towers, coupon recovery and cleaning, and coupon corrosion rate calculations, so as to obtain the measured atmospheric corrosion rate data of each field exposure test point;

[0043] The on-site exposure test is carried out on-site hanging according to the on-site hanging piece standard in GB / T16145-2008 "Metal and Alloy Atmospheric Corrosion Test-General Requirements for Field Tests". The size of the hanging piece sample is 100mm * 50mm, and the thickness is 3mm, the surface roughness of the sample is 2μm, and the sample slot is made of rubber material to isolate the aluminum alloy frame from the metal test piece; at the ...


PUM

PropertyMeasurementUnit
thicknessaaaaaaaaaa
surface roughnessaaaaaaaaaa

Abstract

The invention discloses a method for drawing an atmospheric corrosion level map. The method comprises the steps that firstly, atmospheric corrosion rate data is collected through on-site exposure tests; secondly, meteorological environment data of each meteorological station in a drawing area of the atmospheric corrosion level map is collected; thirdly, a regression analysis method is utilized toestablish a dose response function model according to the collected atmospheric corrosion rate data and meteorological environment data, and the atmospheric corrosion level map is drawn; finally, dataimplantation of a power transmission system is conducted. The atmospheric corrosion level map drawn by means of the method can be used for evaluating the atmospheric corrosivity of southern power grid regions and predicting the service life of materials, especially geographic information data of the power transmission system can be added, and convenient guidance can be provided for layout, overhaul, corrosion prevention and other work of power transmission lines.

Description

technical field [0001] The invention relates to the field of drawing an atmospheric corrosion grade map, in particular to a calculation and drawing method for a regional atmospheric corrosion grade map. Background technique [0002] The power industry is a basic industry and public utility that supports the development of the national economy and society. With the rapid development of my country's national economy and the continuous improvement of people's living standards, the degree of dependence on electricity is also increasing. The transmission tower is a bridge for power transmission, and the corrosion resistance of the steel components of the transmission tower exposed to the natural environment for a long time is one of the key elements to ensure the safe and reliable operation of the transmission line. In the heavily corrosive environment formed by pollution and the deterioration of the natural environment and climate, the corrosion of important equipment such as st...

Claims


Application Information

Patent Timeline
Patent Type & Authority Applications(China)
IPC IPC(8): G01N17/00G01D21/02
Inventor 高岩黄俊聪郑志军孟晓波犹珀玉刘发勇廖永力李锐海吴新桥
Owner SOUTH CHINA UNIV OF TECH
Why Eureka
Eureka Blog
Learn More