Establishment and application of desertization dynamic simulation model
A dynamic simulation and model technology, applied in data processing applications, ICT adaptation, instruments, etc.
- Summary
- Abstract
- Description
- Claims
- Application Information
AI Technical Summary
Problems solved by technology
Method used
Image
Examples
Embodiment 1
[0069] Example 1: Establish a spatial system dynamic model for dynamic simulation of regional desertification coupled with natural and human elements
[0070] Based on the collection of 6 driving factors and related parameter data and rasterization (1km resolution), by quantifying the dynamic processes within and between the 6 driving factors and their influence and feedback on vegetation NPP, use ArcEngine establishes a spatial system dynamics model for dynamic simulation of regional desertification coupled with natural and human elements. The overall framework and structure of the model are as follows figure 2 Shown.
Embodiment 2
[0071] Example 2: The relationship and simulation of climate-soil water-potential vegetation NPP
[0072] The relationship structure diagram of climate, soil water, and potential vegetation NPP is shown in image 3 Shown.
[0073] The simulation method of the relationship between climate, soil water and potential vegetation NPP is:
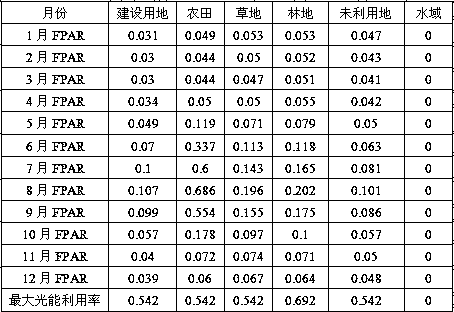
[0074] (1) Based on the monthly rainfall and average temperature data of meteorological stations, and the maximum potential evapotranspiration (PET) data calculated according to the Penman-Monteith model, establish a monthly fitting equation of PET, rainfall and average temperature, and conduct monthly PET simulations; And according to the PET simulation results, calculate the water and temperature limiting factor data of vegetation NPP simulation;
[0075] (2) Based on rainfall, average temperature, maximum potential evapotranspiration (PET), soil sand content, and soil clay content data, according to the soil moisture module of the CASA (Carnegie Ames S...
Embodiment 3
[0081] Example 3: The relationship and simulation of economy-population-vegetation NPP
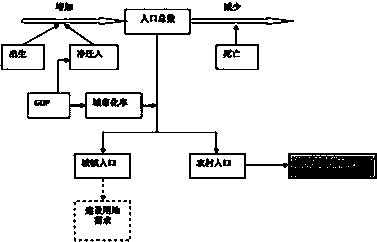
[0082] The relationship structure diagram of economy, population, and vegetation NPP is as follows Figure 4 Shown.
[0083] The simulation method of the relationship between economy, population and vegetation NPP is:
[0084] (1) Based on the data of regional gross product (GDP) and urbanization rate, establish a fitting equation between urbanization rate and GDP to simulate the impact of GDP on urbanization rate;
[0085] (2) Based on the data of regional gross product (GDP) and net migrant population, establish a fitting equation between net migrant population and GDP to simulate the impact of GDP on net migrant population;
[0086] (3) Simulate the total population based on the birth rate, death rate, and net immigration;
[0087]
[0088] (4) Based on the total population and the urbanization rate, simulate the number of urban and rural populations;
[0089] (5) Based on the number of rural popul...
PUM
 Abstract
Description
Claims
Application Information
 - R&D
- Intellectual Property
- Life Sciences
- Materials
- Tech Scout
- Unparalleled Data Quality
- Higher Quality Content
- 60% Fewer Hallucinations
Browse by: Latest US Patents, China's latest patents, Technical Efficacy Thesaurus, Application Domain, Technology Topic, Popular Technical Reports.
© 2025 PatSnap. All rights reserved.Legal|Privacy policy|Modern Slavery Act Transparency Statement|Sitemap|About US| Contact US: help@patsnap.com


