Method for determining longitudinal dispersion coefficient based on space-time matching tracer test of sampled data

A tracer test and sampling data technology, applied in the direction of electrical digital data processing, special data processing applications, diffusion analysis, etc., can solve problems such as difficult to capture peak concentration, low concentration value, difficult measurement, etc., to overcome subjectivity and man-made The effect of strong intervention, reducing the impact of random errors, and less human subjective intervention

Active Publication Date: 2018-06-15
HOHAI UNIV
View PDF4 Cites 2 Cited by
  • Summary
  • Abstract
  • Description
  • Claims
  • Application Information

AI Technical Summary

Problems solved by technology

[0004] (1) If the distance between the sampling section and the feeding point is too short, it is difficult to ensure that the concentration reaches the cross-section uniform mixing. If the distance is too long, the concentration value will be very low, resulting in difficulty in measurement;
[0005] (2) Since the instantaneous tracer concentration process curve is a skewed distribution, the concentration peak does not appear at t=x 0 At / u time, it is difficult to capture the peak concentration. If the time interval is large, it is difficult for the sampling time to match the concentration deviation process line well. If the time interval is small, the workload of sampling and test analysis will increase exponentially;
[0006] (3) The concentration distribution obtained from the natural river tracer test often has a "long tail". Sampling at equal intervals from the release time, the initial concentration is basically 0, and the later concentration value is low and very close, resulting in a large amount of monitoring data being useless data , a waste of manpower and material resources
[0007] It can be seen that the traditional tracer test sampling method has high sampling costs and it is difficult to obtain time-space matching sampling data, which affects the accuracy of the obtained discrete coefficient values

Method used


Image

  • Method for determining longitudinal dispersion coefficient based on space-time matching tracer test of sampled data
  • Method for determining longitudinal dispersion coefficient based on space-time matching tracer test of sampled data
  • Method for determining longitudinal dispersion coefficient based on space-time matching tracer test of sampled data

Examples


Embodiment Construction

[0046] In order to describe the technical solution disclosed in the present invention in detail, further elaboration will be made below in conjunction with the accompanying drawings and specific embodiments.

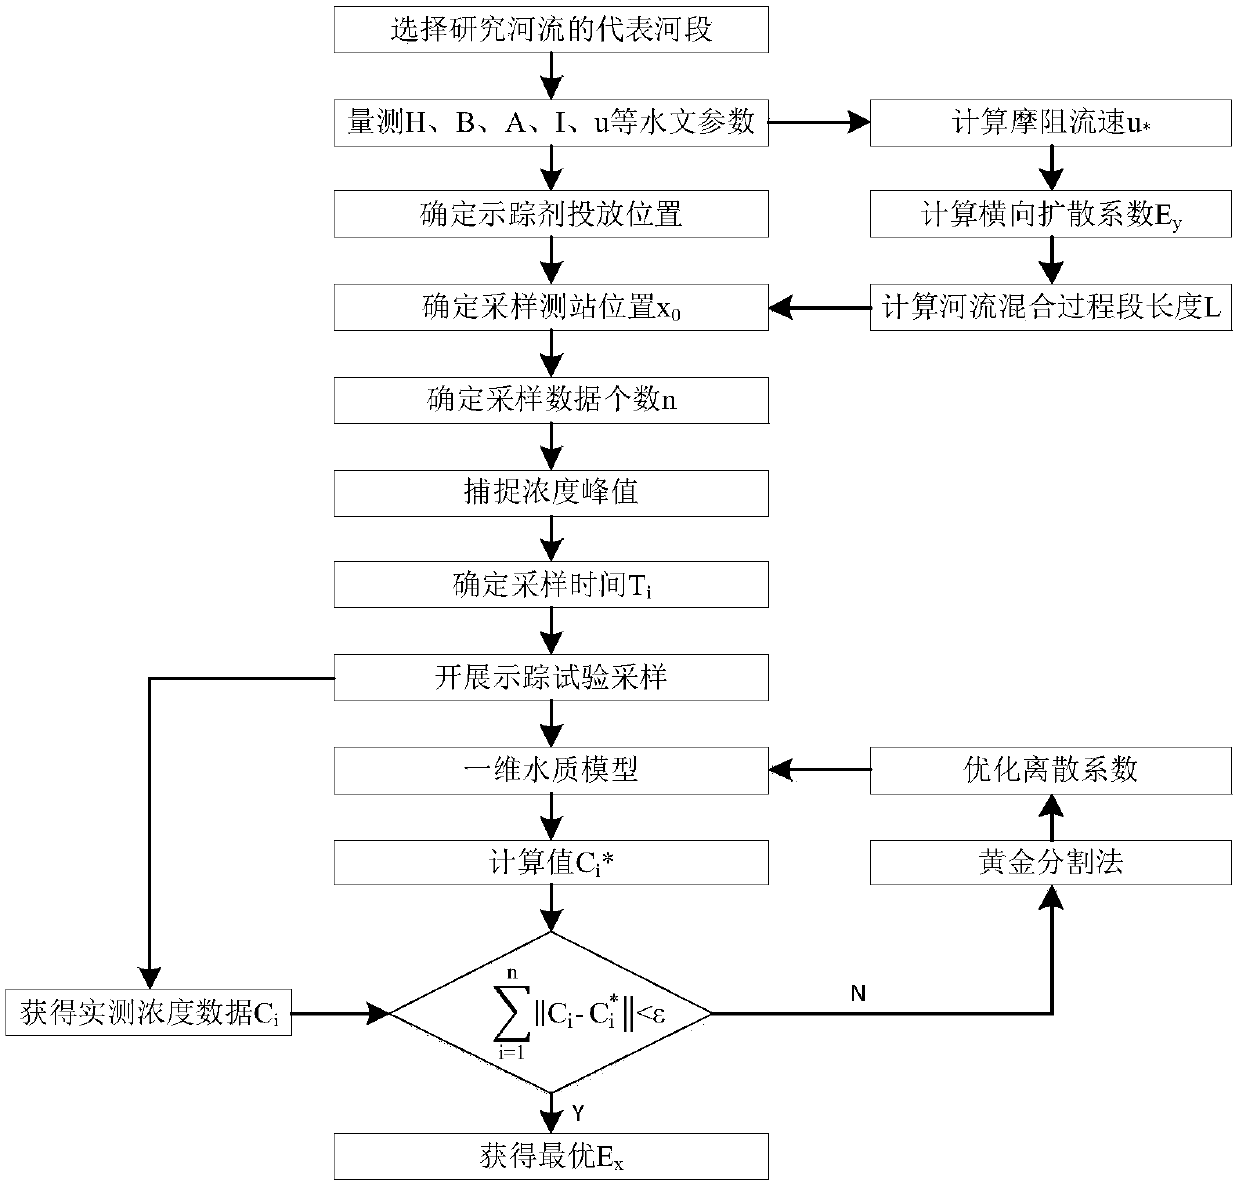
[0047] A certain river selected in this embodiment has an average water depth of 2.0m, a river width of 10m, a longitudinal gradient of 0.0005, and an average cross-sectional velocity of 0.5m / s. It is necessary to determine its longitudinal dispersion coefficient value through a tracer test, the release amount of the tracer is 10kg, and the tracer is preferably rhinidine. Its steps are as follows figure 1 shown.

[0048] (1) Select the section of the river that can represent the water depth and width of the whole river as the tracer test section, and determine the reasonable location of the sampling station x 0 .

[0049] Calculate river friction velocity:

[0050]

[0051] Compute the lateral diffusion coefficient for a river:

[0052] E. y =0.6Hu * =0.6*2*0.1=0...


PUM


Abstract

The invention discloses a method for determining a longitudinal dispersion coefficient based on a space-time matching tracer test of sampled data, comprising the steps of firstly, selecting a representative river section from a natural river to measure hydrological parameters thereof, and determining a reasonable sampling station according to the mixing-length theory; secondly, capturing a concentration peak, and determining a sampling time series matched with the concentration peak; thirdly, carrying out a tracer test, and sampling at a downstream station to obtain a corresponding concentration data sequence; and finally, solving an optimization problem by using a river water quality model coupled golden section method to calculate an optimal solution, i.e., the longitudinal dispersion coefficient of the river. The sampling time matches well with the sampling position, invalid data sampling at the initial stage and long tail stage of a skewed distribution curve is discarded, the sampling cost is saved while the parameter estimation accuracy is satisfied, the shortcomings of subjectivity and strong human intervention in the traditional method are overcome, and a key technical support is provided for accurately and quickly determining the longitudinal dispersion coefficient of the river and improving the precision of the water quality model.

Description

technical field [0001] The invention belongs to water environment monitoring and protection thereof, and in particular relates to a method for determining longitudinal dispersion coefficients based on a time-space matching trace test of sampling data. Background technique [0002] In the study of river water environment and its pollution process, the longitudinal dispersion coefficient reflects the longitudinal mixing characteristics of pollutants in the river, and is a key parameter of the river water quality model, and its magnitude determines the success or failure of the calculation of pollutant concentration distribution. At present, the determination methods of longitudinal dispersion coefficient include theoretical formula, empirical formula, tracer test method, etc. Relatively speaking, the discrete values ​​obtained by tracer experiments are more accurate and reliable than other methods, and can more accurately reflect the discrete characteristics of the river itsel...

Claims


Application Information

Patent Timeline
Patent Type & Authority Applications(China)
IPC IPC(8): G06F17/50G01N13/00
CPCG01N13/00G01N2013/003G06F30/20Y02A20/152
Inventor 刘晓东李玲琪华祖林顾莉褚克坚杨婷
Owner HOHAI UNIV
Why Eureka
Try Eureka