A Method of Quickly Obtaining Contour Data of Radar Composite Reflectivity

A technology of reflectivity and contour lines, applied in radio wave measurement systems, instruments, etc., can solve the problems of increasing product data volume, reducing data acquisition efficiency, and consuming large computing overhead, achieving good technical effects and shortening response time , the effect of reducing the amount of calculation data

Active Publication Date: 2022-06-24
NANJING UNIV OF INFORMATION SCI & TECH
View PDF0 Cites 0 Cited by
  • Summary
  • Abstract
  • Description
  • Claims
  • Application Information

AI Technical Summary

Problems solved by technology

[0002] At present, the acquisition of conventional radar combined reflectivity contour data is calculated through the existing combined reflectivity raster data. However, the calculation of the combined reflectivity raster data itself is based on a regular grid. Here In the process, there is a big difference between the arrangement of the regular grid and the radar scanning method. Therefore, it is necessary to perform a large number of interpolation calculations through the existing radar detection data to obtain the detection data value corresponding to each regular small grid. In this way, the corresponding combined reflectance raster data is finally obtained, and then the contour data is obtained on this basis. On the one hand, this method consumes a lot of computing overhead and reduces the efficiency of data acquisition. On the other hand, it will Introduce redundant data to a certain extent, increase the data volume of product data, and bring unnecessary obstacles to applications such as data transmission

Method used


Image

  • A Method of Quickly Obtaining Contour Data of Radar Composite Reflectivity
  • A Method of Quickly Obtaining Contour Data of Radar Composite Reflectivity
  • A Method of Quickly Obtaining Contour Data of Radar Composite Reflectivity

Examples


Embodiment 1

[0047] The method for combining the reflectivity contour data of the radar of the present invention includes the following specific steps:

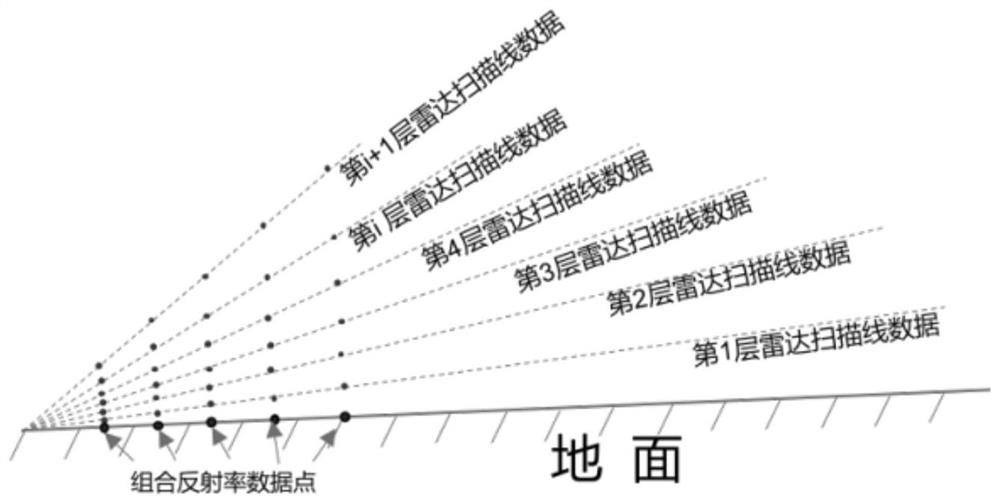
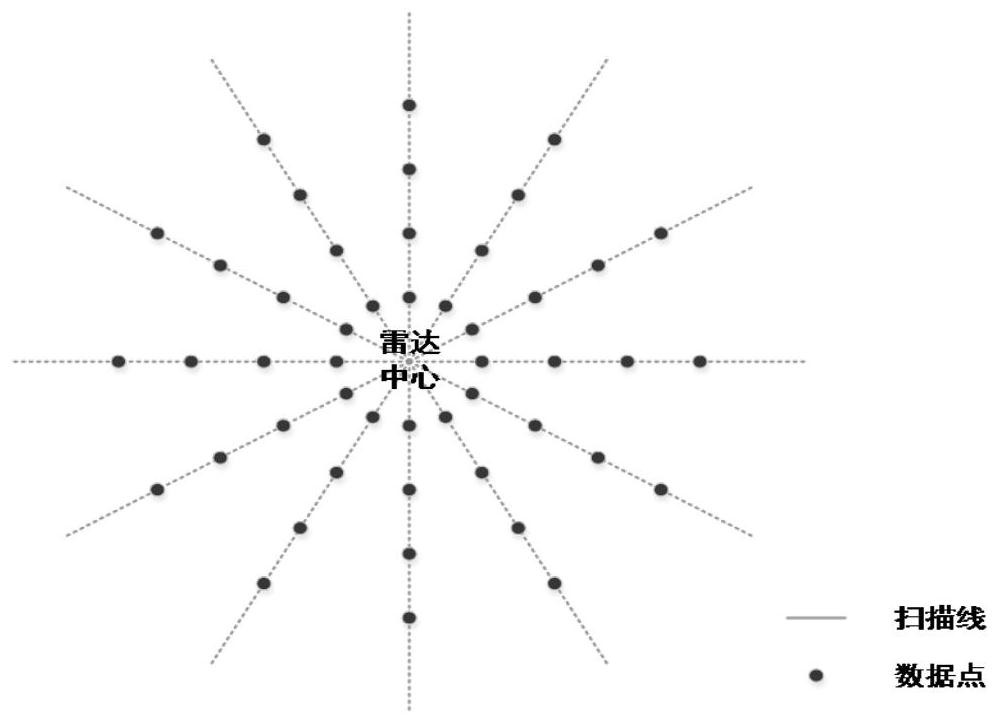
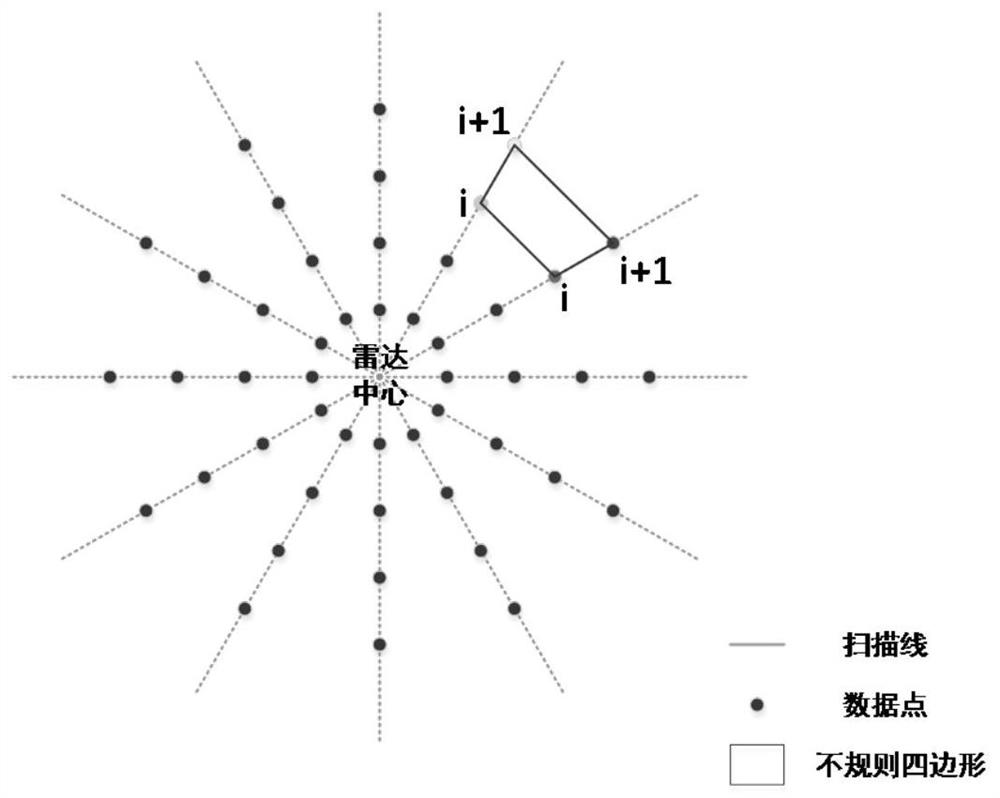
[0048] 1. Normalization of radar 3D scan data: From the original radar 3D scan reflectivity data, obtain the data of each scan layer, and construct the radar antenna position as the center and the azimuth angle as j degrees in each scan layer taken. , the elevation angle is the elevation angle corresponding to each scan layer, the number of data points is the line data of the original data number of any scan line in each scan layer, a total of 360 scan line data, where j represents the azimuth angle corresponding to the scan line Angle, the value range of j is 0 ≤j ≤359 and j is an integer. On the newly constructed 360 line data, the spatial interval between the i-th data point and the i+1-th data point is 1 km, where i represents the number of detection data points on the scan line from the radar center, 1≤i ≤ the number of data points on...

Embodiment 2

[0067] For the radar combined reflectance contour data obtained in the first embodiment, the corresponding color is given to each contour according to the reflectivity factor Z value, and the result is as follows Figure 8 shown.

[0068] In this example, different colors are assigned to the contour lines of different values, which can intuitively express the size of the echo value. For example, if the contour line is red or dark red, it means that the contour line represents high echo values. The area allows meteorological experts to intuitively determine the area of ​​heavy rainfall.

[0069] This kind of product data can intuitively express different callback areas, especially in the form of contour vector data, which has the characteristics of accurate location and easy data sharing and use. When superimposed and displayed with various image data, the use of this contour data with vector characteristics can avoid visual confusion with other image data.


PUM


Abstract

The invention processes the detection data points of the radar so as to obtain the radar combined reflectivity contour data with vector features. The method for quickly obtaining radar combined reflectivity vector contour data includes the following parts: normalization of radar three-dimensional scanning data; calculation of radar combined reflectivity data points; combined reflectivity data grid construction; combined reflectivity equivalent line build. The invention can facilitate the global sharing of radar product data, provide effective decision-making support for disaster reduction and prevention of meteorological disasters, and have good social and economic effects; at the same time, its ability to quickly obtain data has good technical effects and can shorten correlation Sector response time to disasters.

Description

Technical field: [0001] The invention relates to a method for rapidly acquiring radar combined reflectivity contour data. Background technique: [0002] At present, the conventional radar combined reflectance contour data is obtained by calculating the existing combined reflectivity grid data. However, the combined reflectivity grid data calculation itself is based on the regular grid. In the process, there is a big difference between the arrangement of the regular grid and the radar scanning method. Therefore, it is necessary to perform a large number of interpolation calculations through the existing radar detection data to obtain the detection data value corresponding to each regular small grid. In this way, the corresponding combined reflectivity raster data is finally obtained, and then the contour data is obtained on this basis. To a certain extent, redundant data is introduced, which increases the data volume of product data and brings unnecessary obstacles to applic...

Claims


Application Information

Patent Timeline
Patent Type & Authority Patents(China)
IPC IPC(8): G01S7/41
CPCG01S7/41
Inventor 路明月闵锦忠毕硕本毛远翔王新昊
Owner NANJING UNIV OF INFORMATION SCI & TECH
Why Eureka
Try Eureka