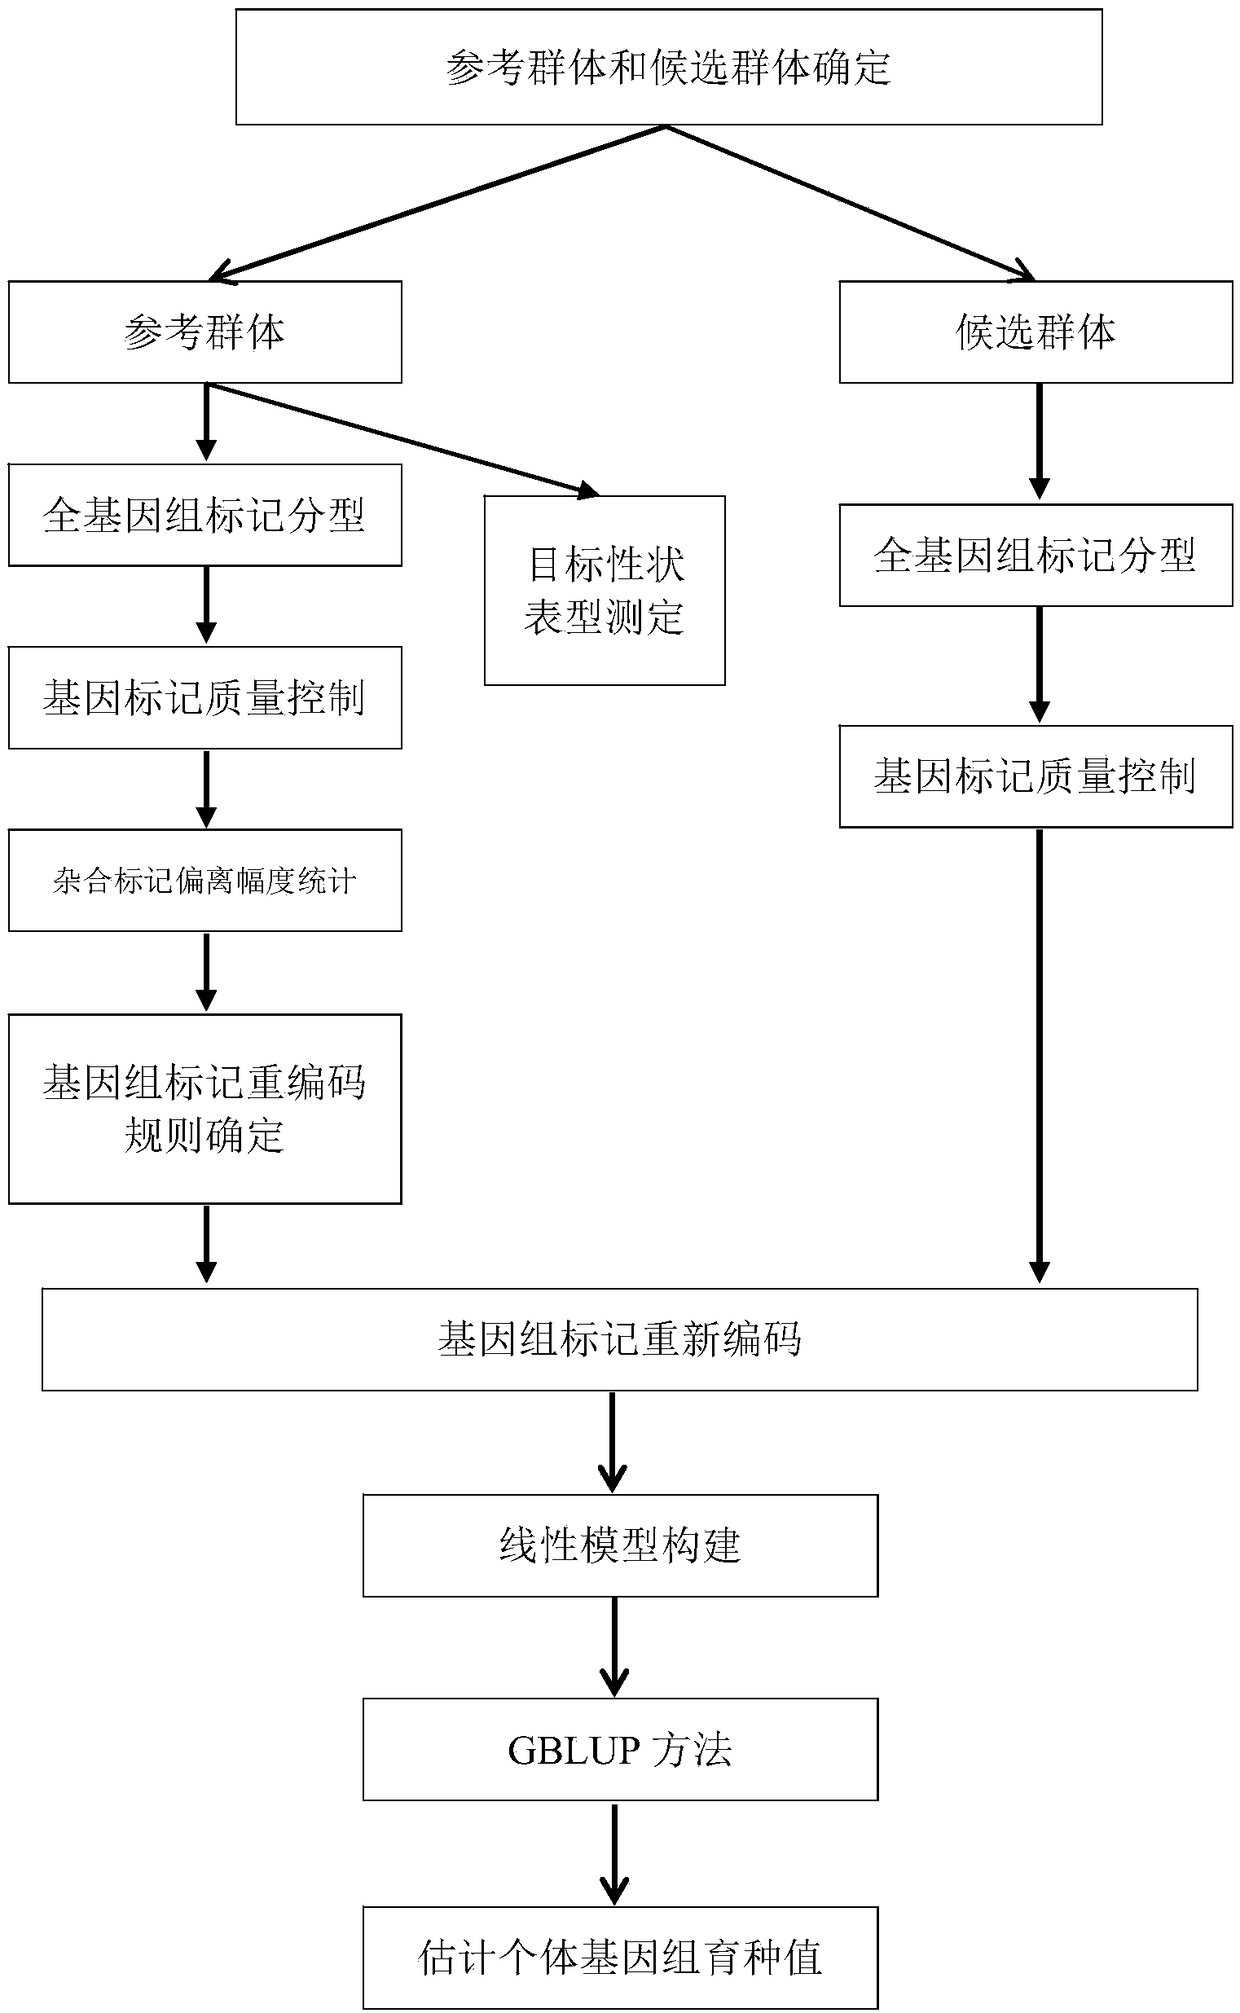
A method for estimating genomic breeding value integrating dominance effects
A genome and breeding value technology, which is applied in the field of livestock and poultry genetic selection, can solve the problems of not considering the dominant effect and the accuracy of the genome estimation breeding value, etc., and achieve the effects of easy convergence, fast calculation speed and improved accuracy
- Summary
- Abstract
- Description
- Claims
- Application Information
AI Technical Summary
Problems solved by technology
Method used
Image
Examples
Embodiment 1
[0038] Example 1 Method for Estimating Genome Breeding Value of Yellow Feather Broiler AH Population Weight
[0039] In order to verify the effect of the method of the present invention, we use the cross-validation method to divide the reference population and the candidate population, and compare the accuracy of the genome estimation breeding value of the method of the present invention and other two common methods.
[0040] The AH population of yellow-feathered broiler chickens was designed and constructed by the F2 design of high-quality broiler A line and Huiyang bearded chickens. In this embodiment, a total of 582 genotyped individuals were used, including 20 individuals of the F0 generation, 51 individuals of the F1 generation, and 511 individuals of the F2 generation. The F2 generation came from 8 half-sib families, all with 12-week body weight records.
[0041] In this example, the target trait is body weight at 12 weeks. The 10-fold cross-validation method was used ...
Embodiment 2
[0078] Example 2 Method for Estimating Breeding Value of Pig Population Genome
[0079] The pig data used in the examples are disclosed in the document "A Common Dataset for Genomic Analysis of Livestock Populations.G3: Genes|Genomes|Genetics 2012, 2(4):429-435."
[0080] The pig group comes from a core strain of the PIC Breeding Pig Improvement International Group Company. The specific name of the core strain and the detailed names of the measured traits are not disclosed in the pig herd data set. The measured traits are named after the symbols T1, T2, T3, T4 and T5 Instead, all phenotype values have been subjected to fixed effects removal. In this example, "T1" is selected as the target trait, which is a trait with low heritability, the heritability is 0.07, and there are 2804 phenotype records in total. The 10-fold cross-validation method was used to randomly divide the population into 10 uniform groups, including 6 groups with 280 pigs and 4 groups with 281 pigs. Among...
PUM
 Abstract
Description
Claims
Application Information
 - R&D
- Intellectual Property
- Life Sciences
- Materials
- Tech Scout
- Unparalleled Data Quality
- Higher Quality Content
- 60% Fewer Hallucinations
Browse by: Latest US Patents, China's latest patents, Technical Efficacy Thesaurus, Application Domain, Technology Topic, Popular Technical Reports.
© 2025 PatSnap. All rights reserved.Legal|Privacy policy|Modern Slavery Act Transparency Statement|Sitemap|About US| Contact US: help@patsnap.com


