Fault location visualization system and method based on operation and maintenance data prediction

A technology for fault location, operation and maintenance data, applied in electrical digital data processing, error detection/correction, instruments, etc. It can solve problems such as heavy workload, excessive log information data, and high risk, and achieve accurate prediction and positioning. Effect

Pending Publication Date: 2020-06-16
FUDAN UNIV +1
View PDF5 Cites 4 Cited by
  • Summary
  • Abstract
  • Description
  • Claims
  • Application Information

AI Technical Summary

Problems solved by technology

[0004] Although there are so many frameworks for network fault analysis and location, these solutions also have many shortcomings and deficiencies in the current environment
First of all, most solutions mainly rely on the threshold method and error log information extraction to detect and locate faults in detecting anomalies. This method is difficult to detect errors in time and is prone to false positives. In the growing network environment, the risk of its existence is getting higher and higher. getting bigger
Moreover, the threshold of the framework is generally specified by experts. With the frequent updates of the system upgrade, the workload of re-understanding the system setting parameters is too large, and t

Method used


Image

  • Fault location visualization system and method based on operation and maintenance data prediction
  • Fault location visualization system and method based on operation and maintenance data prediction
  • Fault location visualization system and method based on operation and maintenance data prediction

Examples


Embodiment Construction

[0038] The technical solutions of the present invention will be described in detail below in conjunction with the accompanying drawings and embodiments.

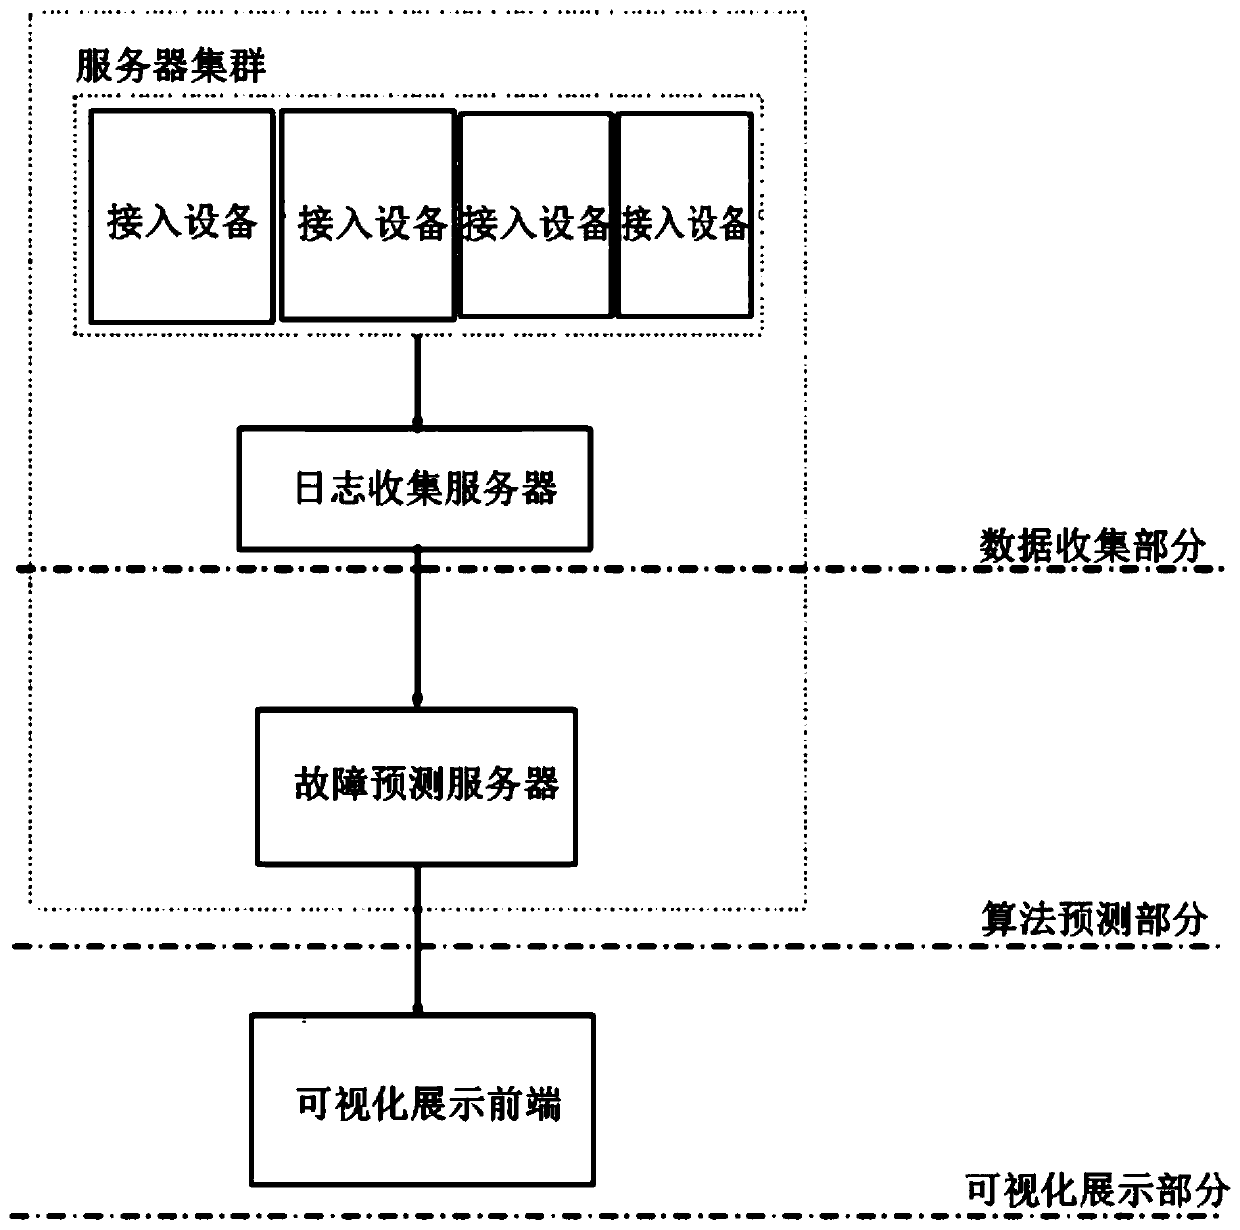
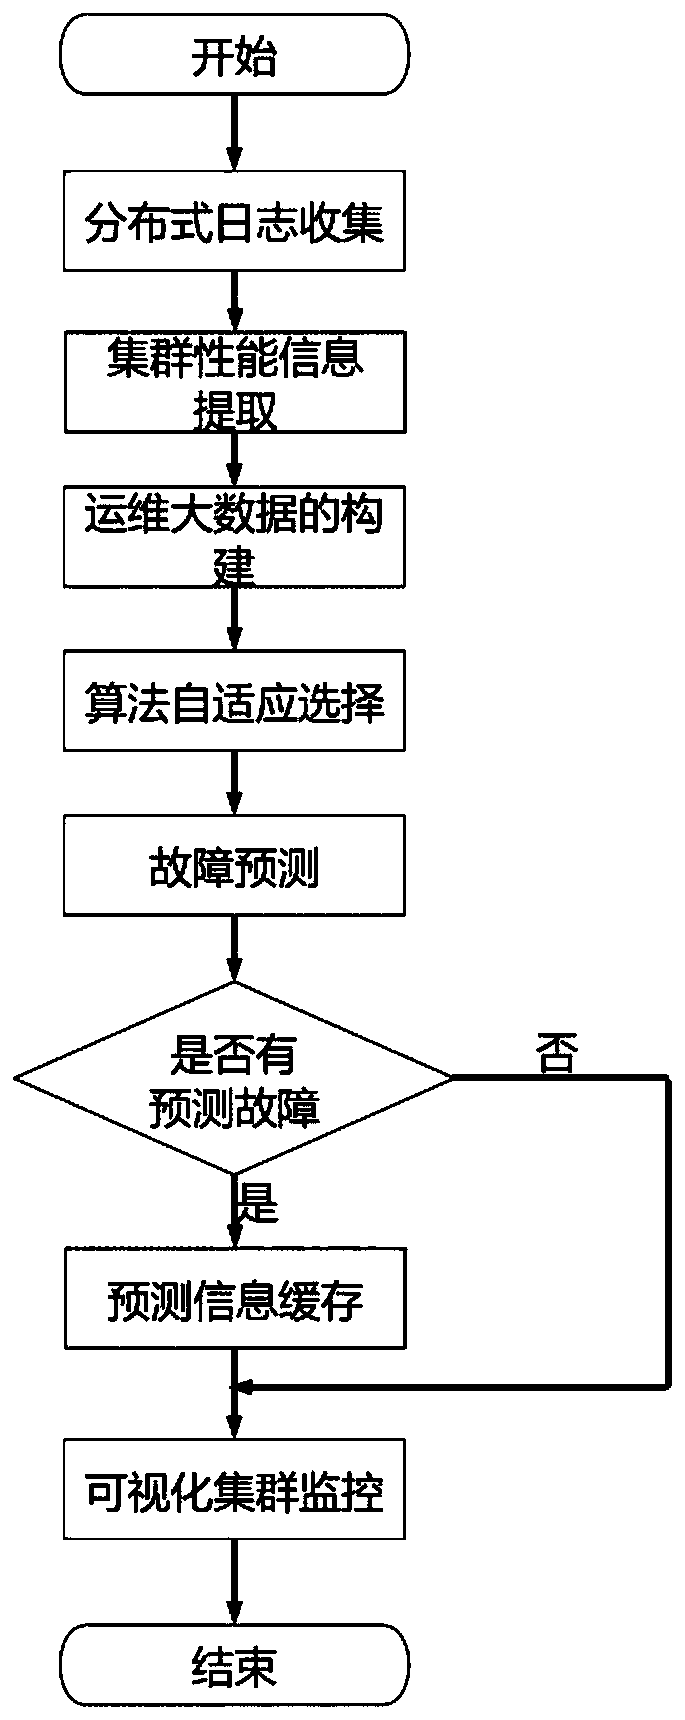
[0039] The present invention first uses a distributed log collection framework to collect machine log information on each device, and then extracts key information from the machine log information as the performance index of the machine at that time, and constructs big data for operation and maintenance. Afterwards, the processed operation and maintenance big data is used to train the artificial intelligence model. When the latest real-time performance data is input, the model can predict whether these machines will fail in the next period of time, and the graph will be displayed It can be visualized to the operation and maintenance personnel in the form of tables and tables, helping the operation and maintenance personnel to identify problems and prepare solutions in advance, thus solving the problem that the operation and m...


PUM


Abstract

The invention discloses a fault positioning visualization system and method based on operation and maintenance data prediction. According to the method, an existing log collection framework is used for collecting machine and application log information in a network cluster to generate operation and maintenance big data, and then an artificial intelligence method is used for processing the operation and maintenance big data, so that network faults can be predicted in advance and displayed in a visual mode. The method has the advantages that the fault can be efficiently and accurately recognized; the network fault can be predicted in advance; sufficient time is provided for operation and maintenance personnel to carry out operation and maintenance work in time; and the work efficiency of theoperation and maintenance personnel is effectively improved in an assisting mode.

Description

technical field [0001] The invention relates to a fault location visualization system and method based on operation and maintenance data prediction, and relates to the technical field of computer network and intelligent operation and maintenance. Background technique [0002] With the maturity of network technology, the coverage of wireless networks is gradually increasing, and at the same time, there are more and more smart devices around people, so the number of devices connected to the network has also increased dramatically. On this basis, the quality of the information service provided by the network is a key factor affecting user experience. For example, if there is an access control authentication system in the network, if there is a failure, the user's work efficiency of the access control system may be greatly reduced. Based on the above two points, the current network puts forward higher requirements for the accuracy and timeliness of fault location, so network fau...

Claims


Application Information

Patent Timeline
IPC IPC(8): G06F11/30G06F11/32G06F11/34G06N20/00
CPCG06F11/3006G06F11/3065G06F11/323G06F11/327G06F11/3409G06F11/3476G06N20/00
Inventor 王子健周扬帆付娇娇陈昊蔡煜曹袖
Owner FUDAN UNIV
Why Eureka
Try Eureka